The Deloitte CFO Survey: 2013 Q1 results
•
0 gostou•1,079 visualizações

The survey found signs that economic uncertainty among CFOs has decreased to a two-and-a-half year low. Lower uncertainty has lifted business confidence for a third consecutive quarter and reduced corporate emphasis on defensive strategies like cost control. CFOs also reported that credit conditions have improved and are more optimistic about their own companies' financial prospects. Overall the survey showed a broad-based rise in confidence among UK businesses.

Recomendados
Recomendados
Mais conteúdo relacionado
Mais procurados
Mais procurados (19)
Destaque
Semelhante a The Deloitte CFO Survey: 2013 Q1 results
Semelhante a The Deloitte CFO Survey: 2013 Q1 results (20)
Mais de Deloitte UK
Mais de Deloitte UK (20)
Último
Último (20)
The Deloitte CFO Survey: 2013 Q1 results
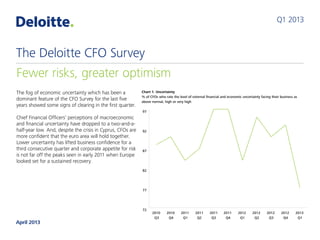
- 1. The fog of economic uncertainty which has been a dominant feature of the CFO Survey for the last five years showed some signs of clearing in the first quarter. Chief Financial Officers’ perceptions of macroeconomic and financial uncertainty have dropped to a two-and-a- half-year low. And, despite the crisis in Cyprus, CFOs are more confident that the euro area will hold together. Lower uncertainty has lifted business confidence for a third consecutive quarter and corporate appetite for risk is not far off the peaks seen in early 2011 when Europe looked set for a sustained recovery. Reduced stress in financial markets has delivered improvements in credit conditions for large UK corporates. CFOs say credit is more available and cheaper than at any time since the survey started in September 2007. CFOs have edged away from their previous emphasis on cost control and cash flow. Our index of corporate defensiveness, having trended higher for two-and-a-half years, has declined sharply. Q2 2013 Fewer risks, greater optimism The Deloitte CFO Survey May 2013
- 2. Chart 1. Uncertainty % of CFOs who rate the level of external financial and economic uncertainty facing their business as above normal, high or very high 72 77 82 87 92 97 2013 Q1 2012 Q4 2012 Q3 2012 Q2 2012 Q1 2011 Q4 2011 Q3 2011 Q2 2011 Q1 2010 Q4 2010 Q3 The Deloitte CFO Survey
- 3. British business looks set to benefit from a less risky, and improving, global economic backdrop. UK-based businesses with strong overseas exposure are shifting towards more expansionary policies. UK-focused businesses remain defensive, but optimism among these companies has risen too. Overall this quarter’s survey shows a strikingly broad- based rise in confidence among the UK’s largest businesses. Authors Ian Stewart Chief Economist 020 7007 9386 istewart@deloitte.co.uk Debapratim De Senior Economic Analyst 020 7303 0888 dde@deloitte.co.uk Alex Cole Economic Analyst 020 7007 2947 alecole@deloitte.co.uk Contacts Ian Stewart Chief Economist 020 7007 9386 istewart@deloitte.co.uk Mark FitzPatrick Vice Chairman and CFO Programme Leader 020 7303 5167 mfitzpatrick@deloitte.co.uk The Deloitte CFO Survey
- 4. Optimism rises CFO optimism about financial prospects for their own companies has risen for the third consecutive quarter. Companies that generate a large share of their revenues abroad and those that are more UK-focused have both become more optimistic. Chart 2. Financial prospects Net % of CFOs who are more optimistic about financial prospects for their company now than three months ago LessoptimisticMoreoptimistic -70 -50 -30 -10 10 30 50 70 13 Q1 12 Q3 12 Q1 11 Q3 11 Q1 10 Q3 10 Q1 09 Q3 09 Q1 08 Q3 08 Q1 07 Q3
- 5. Greater optimism among CFOs is also reflected in the continued easing of their fears of a euro breakup, despite the crisis in Cyprus. CFOs now attach an 18% probability to the euro breaking up in 12 months – exactly half the level last summer. Chart 3. Average probability of euro secession Probability assigned by UK CFOs to the likelihood of any of the existing members of the euro area not being in the single currency in the next 12 months (%) 2013 Q12012 Q42012 Q32012 Q22012 Q12011 Q4 37% 26% 36% 27% 22% 18% Optimism rises
- 6. Our panel of CFOs, mostly representing large UK corporates, also report a continued improvement in credit conditions. CFOs report credit is cheaper and more easily available now than at any time in the past five years. Chart 4. Cost and availability of credit Net % of CFOs reporting credit is costly and credit is easily available Cost of credit (LHS) Availability of credit (RHS) CreditiscostlyCreditischeap CreditisavailableCreditishardtoget -100 -80 -60 -40 -20 0 20 40 60 80 100 -100 -80 -60 -40 -20 0 20 40 60 80 100 13 Q1 12 Q3 12 Q1 11 Q3 11 Q1 10 Q3 10 Q1 09 Q3 09 Q1 08 Q3 08 Q1 07 Q3 Optimism rises
- 7. Investment drivers This section compares CFO sentiment on nine key drivers of corporate investment today and six months ago. The big message is that improving macroeconomic and financial conditions are easing the constraints on business investment. The radar chart below rates CFO sentiment on a score of zero to ten, with ten the most positive. The blue line depicts CFOs’ assessment six months ago; the green line shows the current position. CFOs are more positive on eight out of the nine drivers, thus the green line almost envelops the blue line. CFOs’ biggest worries, denoted by low absolute scores on the lines, relate to economic uncertainty, the weakness of the euro area and fiscal consolidation in the UK. But, encouragingly, they are less worried today about weak growth in Europe and uncertainty than six months ago. Concerns about UK fiscal consolidation have increased, but only marginally. CFOs are most optimistic, and increasingly so, about prospects for long-term growth in demand for their own products and economic activity in emerging markets, the US and the Asia-Pacific region. Sentiment on the cost and availability of finance has also improved, and CFOs do not see credit conditions exerting a dampening effect on investment.
- 8. Chart 5. Factors affecting corporate investment plans CFOs’ assessment of the effect of each of the following factors on their investment plans: Q3 2012 (blue line) and Q1 2013 (green line). On a 10-point scale where 0 implies the most negative effect and 10 the most positive. Economic and financial uncertainty Growth in the euro area Fiscal consolidation in the UK Growth in the UK Cost and availability of external financeAvailability of internal finance Q3 2012 Growth in emerging markets Growth in the US and Asia-Pacific Secular or long-term growth in demand for companies’ products Q1 2013 1 2 3 4 5 6 7 8 9 10 Investment drivers
- 9. Rising risk appetite In recent months investors have increasingly turned to risk assets, such as equities, in search of higher returns. The S&P 500 has gained 10% this year hitting an all-time high in the first week of April. Chart 6. Standard & Poor’s 500 equity index Source: Thomson Reuters Datastream 600 800 1000 1200 1400 1600 2013201220112010200920082007
- 10. CFOs’ attitudes to risk tend to mirror those of investors. Corporate risk appetite rose to almost a two-year high in the first quarter. Companies that derive most of their revenues from foreign markets display a significantly greater appetite for risk than their UK-facing peers. Chart 7. Risk appetite % of CFOs who think this is a good time to take greater risk onto their balance sheets 0 10 20 30 40 50 13 Q1 12 Q3 12 Q1 11 Q3 11 Q1 10 Q3 10 Q1 09 Q3 09 Q1 08 Q3 08 Q1 07 Q3 Rising risk appetite
- 11. Expectations for an increase in corporate revenues also rose in the first quarter. Chart 8. Outlook for revenue growth Net % of CFOs who expect UK corporates’ revenues to increase in the next 12 months IncreaseDecrease -35 -25 -15 -5 5 15 25 35 45 55 65 13 Q1 12 Q4 12 Q3 12 Q2 12 Q1 11 Q4 11 Q3 11 Q2 11 Q1 10 Q4 10 Q3 Rising risk appetite
- 12. CFOs are placing less emphasis on defensive strategies, such as reducing costs and increasing cash flow, than in the previous quarter. Nonetheless, cost reduction and increasing cash flow remain the top two priorities for corporates, albeit by a narrowing margin. Chart 9. Corporate priorities in the next 12 months % of CFOs who rated each of the following as a strong priority for their business in the next 12 months Disposing of assets Increasing capital expenditure Reducing leverage Expanding by acquisition Raising dividends or share buybacks Introducing new products/ services or expanding into new markets Increasing cash flow Reducing costs 42% 39% 35% 18% 17% 13% 15% 6% 50% 49% 34% 8% 17% 11% 20% 8% 2013 Q12012 Q4 CFOs less defensive
- 13. Our index of corporate defensiveness, having trended higher for two-and-a-half years, has dropped sharply. Chart 10. CFO priorities: Expansionary vs. defensive strategies Defensive Arithmetic average of the % of CFOs who rated expansionary and defensive strategies as a strong priority for their business in the next 12 months. Expansionary strategies are introducing new products/services or expanding into new markets, expanding by acquisition and increasing capital expenditure. Defensive strategies are reducing costs, reducing leverage and increasing cash flow. Expansionary 19% 21% 23% 25% 27% 29% 31% 33% 35% 37% 39% 13 Q1 12 Q4 12 Q3 12 Q2 12 Q1 11 Q4 11 Q3 11 Q2 11 Q1 10 Q4 10 Q3 CFOs less defensive
- 14. International companies, those deriving more than 70% of their revenue from outside the UK, have decisively shifted from a defensive to an expansionary stance. UK-facing corporates, those deriving less than 30% of their revenues from abroad, remain defensive. Chart 11. Index of corporate expansion: International & UK-facing corporates Difference between the arithmetic averages of the % of CFOs who rated expansionary and defensive strategies as a strong priority for their business in the next 12 months. Defensive and expansionary strategies defined under Chart 10. International UK-facing ExpansionaryDefensive -30% -20% -10% 0% 10% 20% 30% 13 Q1 12 Q4 12 Q3 12 Q2 12 Q1 11 Q4 11 Q3 11 Q2 Overseas markets beckon
- 15. Lower costs and improved availability of credit have ensured that raising debt, through bond issuance or bank borrowing, remains the most attractive form of financing for our panel of large corporates. Equity issuance has also gained favour among CFOs. Chart 12. Favoured source of corporate funding Net % of CFOs reporting the following sources of funding as attractive Bond issuance Bank borrowing Equity issuance AttractiveUnattractive -60 -40 -20 0 20 40 60 80 13 Q1 12 Q3 12 Q1 11 Q3 11 Q1 10 Q3 10 Q1 09 Q3 09 Q1 08 Q3 08 Q1 07 Q3 Overseas markets beckon
- 16. CFOs consider equities to be overvalued for the first time in three years. Government bonds continue to be seen, as they have been for five years, as the most overvalued asset. Chart 13. UK valuations Net % of respondents who think the following assets are overvalued Government bonds Commercial real estate Equities OvervaluedUndervalued -80 -60 -40 -20 0 20 40 60 80 100 13 Q1 12 Q3 12 Q1 11 Q3 11 Q1 10 Q3 10 Q1 09 Q3 09 Q1 08 Q3 08 Q1 07 Q3 Overseas markets beckon
- 17. The macroeconomic backdrop to the Deloitte CFO Survey Q1 2013 Economic activity in the UK and the euro area appears to have stagnated in the first quarter and growth forecasts for 2013 have drifted lower. However, the British Chambers of Commerce reported a rise in optimism among small UK companies. Market nerves about the US deficit eased and US housing and employment activity improved. The outlook for growth in emerging markets improved as fears of a ‘hard landing’ eased. The bold monetary and fiscal stimulus policies introduced by Japan’s new government led to a strong rally in Japanese equities and boosted confidence about Japan’s growth prospects. Financial markets continued to strengthen, with the UK FTSE 100 up 8.7% between January and the end of March, and the S&P 500 and Dow Jones Industrial Average reaching all-time highs. Financial market optimism was only briefly dented by the €17 billion bailout of Cypriot banks. The episode set new precedents with private depositors being forced to contribute to the rescue and the imposition of capital controls. Economic and financial context
- 18. Economic and financial context UK GDP growth: Actual and forecast (%) -8 -6 -4 -2 0 2 4 6 2013201220112010200920082007 UK growth to see weak recovery Quarter-on-quarter growth Forecasts Year-on-year growth Source: ONS, consensus forecasts from The Economist and Deloitte calculations
- 19. Economic and financial context VIX Index – a measure of equity market volatility 0 10 20 30 40 50 60 70 80 90 2013201220112010200920082007 Financial stress has eased Source: ONS, consensus forecasts from The Economist and Deloitte calculations Greaterfinancialstress
- 20. UK private and public sector job growth (thousands) Source: ONS Private sector hiring offsets public sector job losses Private sector -300 -200 -100 0 100 200 300 400 500 12 Q4 12 Q1 11 Q1 10 Q1 09 Q1 08 Q1 07 Q1 Public sector Economic and financial context
- 21. Economic and financial context UK annual CPI inflation (%) 0 1 2 3 4 5 6 7 8 9 121008060402009896949290 UK consumer price inflation has edged up recently Source: ONS
- 22. Two-chart summary of key survey messages Uncertainty % of CFOs who rate the level of external financial and economic uncertainty facing their business as above normal, high or very high Sharp fall in uncertainty 72 77 82 87 92 97 13 Q1 12 Q4 12 Q3 12 Q2 12 Q1 11 Q4 11 Q3 11 Q2 11 Q1 10 Q4 10 Q3
- 23. Two-chart summary of key survey messages CFO priorities: Expansionary vs. defensive strategies Defensive CFOs less defensive Arithmetic average of the % of CFOs who rated expansionary and defensive strategies as a strong priority for their business in the next 12 months. See page 10 for definitions of expansionary and defensive strategies. Expansionary 19% 21% 23% 25% 27% 29% 31% 33% 35% 37% 39% 13 Q1 12 Q4 12 Q3 12 Q2 12 Q1 11 Q4 11 Q3 11 Q2 11 Q1 10 Q4 10 Q3
- 24. Deloitte refers to one or more of Deloitte Touche Tohmatsu Limited (“DTTL”), a UK private company limited by guarantee, and its network of member firms, each of which is a legally separate and independent entity. Please see www.deloitte.co.uk/about for a detailed description of the legal structure of DTTL and its member firms. Deloitte LLP is the United Kingdom member firm of DTTL. This publication has been written in general terms and therefore cannot be relied on to cover specific situations; application of the principles set out will depend upon the particular circumstances involved and we recommend that you obtain professional advice before acting or refraining from acting on any of the contents of this publication. Deloitte LLP would be pleased to advise readers on how to apply the principles set out in this publication to their specific circumstances. Deloitte LLP accepts no duty of care or liability for any loss occasioned to any person acting or refraining from action as a result of any material in this publication. © 2013 Deloitte LLP. All rights reserved. Deloitte LLP is a limited liability partnership registered in England and Wales with registered number OC303675 and its registered office at 2 New Street Square, London EC4A 3BZ, United Kingdom. Tel: +44 (0) 20 7936 3000 Fax: +44 (0) 20 7583 1198. Designed and produced by The Creative Studio at Deloitte, London. 26539A About the survey This is the 23rd quarterly survey of Chief Financial Officers and Group Finance Directors of major companies in the UK. The 2013 first quarter survey took place between 14th and 28th March. 120 CFOs participated, including the CFOs of 26 FTSE 100 and 44 FTSE 250 companies. The rest were CFOs of other UK-listed companies, large private companies and UK subsidiaries of major companies listed overseas. The combined market value of the 69 UK-listed companies surveyed is £671 billion, or approximately 32% of the UK quoted equity market. The Deloitte CFO Survey is the only survey of major corporate users of capital that gauges attitudes to valuations, risk and financing. To join our panel of CFO respondents and for additional copies of this report, please contact Tulaine Trimble on 020 7007 1684 or email ttrimble@deloitte.co.uk Please visit www.deloitte.co.uk/cfosurvey for current and past copies of the survey, historical data and coverage of the survey in the media and elsewhere.