SlideShare uma empresa Scribd logo
1 de 65
Baixar para ler offline
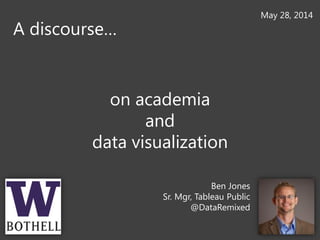
on academia
and
data visualization
A discourse…
Ben Jones
Sr. Mgr, Tableau Public
@DataRemixed
May 28, 2014
A Canadian from Los Angeles who started a
dataviz website
…and moved to Washington to join Tableau
About Ben
Free software to quickly create and
share interactive data graphics on the web
http://www.nhl.com/ice/careerstats.htm
Gathering
Structuring
Analyzing
Communicating
Tables, Spreadsheets, Lists Charts, Graphs, Maps
INFORMATION INSIGHT
http://dataremixed.com website stats, Aug 2011 – May 2014
Source | Google Analytics
why data visualization?
because visualization amplifies cognition…
first for you, then for your audience
question gathering
data
structuring
data
exploring
data
communicating
data
The Data Discovery Horse Track
Anscomb’s Quartet
data visualization isn’t new
it’s been going on for centuries now
Joseph Priestley, 1769
William Playfair, 1786
John Snow, 1854
Florence Nightingale, 1858
visualization is for academics
some of the most influential findings have been communicated visually
“What motivates me now
are the ideas I developed
10, 20 or 30 years ago,
and the feeling that
these ideas may be lost
if I don’t push them a
little bit further.”
-Benoit Mandlebrot
UW: West, Bergstrom, Jacquet, Brooks, Aragon
http://www.eigenfactor.org/gender/#
Visualization can be both
c l e a r
AND
beautiful
Data should be visually appealing
Data should be easy to understand
but visualization isn’t a panacea
just because you visualize something, doesn’t mean it’s intelligible
http://de.wikipedia.org/wiki/Kühlschifffahrt
http://commons.wikimedia.org/wiki/File:Pie_chart_of_US_population_by_state.png
http://flowingdata.com/2014/04/04/fox-news-bar-chart-gets-it-wrong/
http://phylonetworks.blogspot.com/2012/03/biological-versus-phylogenetic-networks.html
Protein interaction network
and hey, visualization can be fun
just because you visualize something, doesn’t mean it’s intelligible
What does
this remind
you of?
Via Christopher Ingraham
Twitter: @_cingraham
Oh, and you can only
use exploded pies
when telling jokes…
but it can also be heavy-hitting
some facts about our world are very grave
visualization is an opportunity for
academic research
getting your ideas out there, making them stick
3 Classic Problems:
The Technical Problem
The Semantic Problem
The Effectiveness Problem
C. Shannon W. Weaver
UW: West, Bergstrom, Jacquet, Brooks, Aragon
http://www.eigenfactor.org/gender/#
My message to academic researchers:
Don’t just communicate your findings with your peers using
jargon.
Use visualization to communicate your findings with the world.
There is an appetite for your ideas. If you don’t push them, who
will?

Mais conteúdo relacionado

Semelhante a Data Viz for Academic Research

Data Con LA 2018 - Best Practices in Data Visualization by Shilpa Balan
Data Con LA 2018 - Best Practices in Data Visualization by Shilpa BalanData Con LA 2018 - Best Practices in Data Visualization by Shilpa Balan
Data Con LA 2018 - Best Practices in Data Visualization by Shilpa BalanData Con LA
 
Data Visualisation Literacy - Learning to See
Data Visualisation Literacy - Learning to SeeData Visualisation Literacy - Learning to See
Data Visualisation Literacy - Learning to SeeAndy Kirk
 
Telling stories with your data
Telling stories with your dataTelling stories with your data
Telling stories with your dataJohn Whalen
 
How to make the best data visualization - Piotr Ocalewicz
How to make the best data visualization - Piotr OcalewiczHow to make the best data visualization - Piotr Ocalewicz
How to make the best data visualization - Piotr OcalewiczPiotr Ocalewicz
 
The Digital Academic: The opportunities for scholarly communication, discussi...
The Digital Academic: The opportunities for scholarly communication, discussi...The Digital Academic: The opportunities for scholarly communication, discussi...
The Digital Academic: The opportunities for scholarly communication, discussi...Andy Tattersall
 
AI and the Researcher: ChatGPT and DALL-E in Scholarly Writing and Publishing
AI and the Researcher: ChatGPT and DALL-E in Scholarly Writing and PublishingAI and the Researcher: ChatGPT and DALL-E in Scholarly Writing and Publishing
AI and the Researcher: ChatGPT and DALL-E in Scholarly Writing and PublishingErin Owens
 
Data Visualization - What can you see? #baai17
Data Visualization - What can you see? #baai17Data Visualization - What can you see? #baai17
Data Visualization - What can you see? #baai17Eugene O'Loughlin
 
DN18 | From Counting to Connecting: A Networked and Data-Driven Approach to M...
DN18 | From Counting to Connecting: A Networked and Data-Driven Approach to M...DN18 | From Counting to Connecting: A Networked and Data-Driven Approach to M...
DN18 | From Counting to Connecting: A Networked and Data-Driven Approach to M...Dataconomy Media
 
'Drinking from the fire hose? The pitfalls and potential of Big Data'.
'Drinking from the fire hose? The pitfalls and potential of Big Data'.'Drinking from the fire hose? The pitfalls and potential of Big Data'.
'Drinking from the fire hose? The pitfalls and potential of Big Data'.Josh Cowls
 
Challenges in-archiving-twitter
Challenges in-archiving-twitterChallenges in-archiving-twitter
Challenges in-archiving-twitterKatrin Weller
 
CLAC 2010: Five Futures for Higher Education
CLAC 2010: Five Futures for Higher EducationCLAC 2010: Five Futures for Higher Education
CLAC 2010: Five Futures for Higher EducationBryan Alexander
 
Data vispresupdate.pptx
Data vispresupdate.pptxData vispresupdate.pptx
Data vispresupdate.pptxFan Feng
 
How to Entertain audiences using data led content - Trend Report Spring 2015
How to Entertain audiences using data led content - Trend Report Spring 2015How to Entertain audiences using data led content - Trend Report Spring 2015
How to Entertain audiences using data led content - Trend Report Spring 2015infogr8
 
Data Science in 2016: Moving Up
Data Science in 2016: Moving UpData Science in 2016: Moving Up
Data Science in 2016: Moving UpPaco Nathan
 
Data Science in 2016: Moving up by Paco Nathan at Big Data Spain 2015
Data Science in 2016: Moving up by Paco Nathan at Big Data Spain 2015Data Science in 2016: Moving up by Paco Nathan at Big Data Spain 2015
Data Science in 2016: Moving up by Paco Nathan at Big Data Spain 2015Big Data Spain
 
Be Data Informed Without Being a Data Scientist
Be Data Informed Without Being a Data ScientistBe Data Informed Without Being a Data Scientist
Be Data Informed Without Being a Data ScientistPamela Pavliscak
 
STA-O Discussion Question Four - Statistics.pdf Discussi.docx
STA-O Discussion Question Four - Statistics.pdf Discussi.docxSTA-O Discussion Question Four - Statistics.pdf Discussi.docx
STA-O Discussion Question Four - Statistics.pdf Discussi.docxdessiechisomjj4
 

Semelhante a Data Viz for Academic Research (20)

Data Con LA 2018 - Best Practices in Data Visualization by Shilpa Balan
Data Con LA 2018 - Best Practices in Data Visualization by Shilpa BalanData Con LA 2018 - Best Practices in Data Visualization by Shilpa Balan
Data Con LA 2018 - Best Practices in Data Visualization by Shilpa Balan
 
Data Visualisation Literacy - Learning to See
Data Visualisation Literacy - Learning to SeeData Visualisation Literacy - Learning to See
Data Visualisation Literacy - Learning to See
 
Telling stories with your data
Telling stories with your dataTelling stories with your data
Telling stories with your data
 
SENCER_panel.ppt
SENCER_panel.pptSENCER_panel.ppt
SENCER_panel.ppt
 
How to make the best data visualization - Piotr Ocalewicz
How to make the best data visualization - Piotr OcalewiczHow to make the best data visualization - Piotr Ocalewicz
How to make the best data visualization - Piotr Ocalewicz
 
The Digital Academic: The opportunities for scholarly communication, discussi...
The Digital Academic: The opportunities for scholarly communication, discussi...The Digital Academic: The opportunities for scholarly communication, discussi...
The Digital Academic: The opportunities for scholarly communication, discussi...
 
AI and the Researcher: ChatGPT and DALL-E in Scholarly Writing and Publishing
AI and the Researcher: ChatGPT and DALL-E in Scholarly Writing and PublishingAI and the Researcher: ChatGPT and DALL-E in Scholarly Writing and Publishing
AI and the Researcher: ChatGPT and DALL-E in Scholarly Writing and Publishing
 
Data Visualization - What can you see? #baai17
Data Visualization - What can you see? #baai17Data Visualization - What can you see? #baai17
Data Visualization - What can you see? #baai17
 
DN18 | From Counting to Connecting: A Networked and Data-Driven Approach to M...
DN18 | From Counting to Connecting: A Networked and Data-Driven Approach to M...DN18 | From Counting to Connecting: A Networked and Data-Driven Approach to M...
DN18 | From Counting to Connecting: A Networked and Data-Driven Approach to M...
 
Dataviz 101: Data is beautiful, please don't ruin it by Anne-Marie Tousch, Se...
Dataviz 101: Data is beautiful, please don't ruin it by Anne-Marie Tousch, Se...Dataviz 101: Data is beautiful, please don't ruin it by Anne-Marie Tousch, Se...
Dataviz 101: Data is beautiful, please don't ruin it by Anne-Marie Tousch, Se...
 
'Drinking from the fire hose? The pitfalls and potential of Big Data'.
'Drinking from the fire hose? The pitfalls and potential of Big Data'.'Drinking from the fire hose? The pitfalls and potential of Big Data'.
'Drinking from the fire hose? The pitfalls and potential of Big Data'.
 
Rogers digitalmethods 4nov2010
Rogers digitalmethods 4nov2010Rogers digitalmethods 4nov2010
Rogers digitalmethods 4nov2010
 
Challenges in-archiving-twitter
Challenges in-archiving-twitterChallenges in-archiving-twitter
Challenges in-archiving-twitter
 
CLAC 2010: Five Futures for Higher Education
CLAC 2010: Five Futures for Higher EducationCLAC 2010: Five Futures for Higher Education
CLAC 2010: Five Futures for Higher Education
 
Data vispresupdate.pptx
Data vispresupdate.pptxData vispresupdate.pptx
Data vispresupdate.pptx
 
How to Entertain audiences using data led content - Trend Report Spring 2015
How to Entertain audiences using data led content - Trend Report Spring 2015How to Entertain audiences using data led content - Trend Report Spring 2015
How to Entertain audiences using data led content - Trend Report Spring 2015
 
Data Science in 2016: Moving Up
Data Science in 2016: Moving UpData Science in 2016: Moving Up
Data Science in 2016: Moving Up
 
Data Science in 2016: Moving up by Paco Nathan at Big Data Spain 2015
Data Science in 2016: Moving up by Paco Nathan at Big Data Spain 2015Data Science in 2016: Moving up by Paco Nathan at Big Data Spain 2015
Data Science in 2016: Moving up by Paco Nathan at Big Data Spain 2015
 
Be Data Informed Without Being a Data Scientist
Be Data Informed Without Being a Data ScientistBe Data Informed Without Being a Data Scientist
Be Data Informed Without Being a Data Scientist
 
STA-O Discussion Question Four - Statistics.pdf Discussi.docx
STA-O Discussion Question Four - Statistics.pdf Discussi.docxSTA-O Discussion Question Four - Statistics.pdf Discussi.docx
STA-O Discussion Question Four - Statistics.pdf Discussi.docx
 

Mais de Ben Jones

Data Literacy Presentation at Madison Tableau User Group
Data Literacy Presentation at Madison Tableau User GroupData Literacy Presentation at Madison Tableau User Group
Data Literacy Presentation at Madison Tableau User GroupBen Jones
 
Data Literacy Webinar 003 - Finding & Gathering Data
Data Literacy Webinar 003 - Finding & Gathering DataData Literacy Webinar 003 - Finding & Gathering Data
Data Literacy Webinar 003 - Finding & Gathering DataBen Jones
 
17 Key Traits of Data Literacy
17 Key Traits of Data Literacy17 Key Traits of Data Literacy
17 Key Traits of Data LiteracyBen Jones
 
Using Data Visualization to Inform and Inspire
Using Data Visualization to Inform and InspireUsing Data Visualization to Inform and Inspire
Using Data Visualization to Inform and InspireBen Jones
 
Data Visualization and Law Enforcement
Data Visualization and Law EnforcementData Visualization and Law Enforcement
Data Visualization and Law EnforcementBen Jones
 
Nature and Viz
Nature and VizNature and Viz
Nature and VizBen Jones
 
Beyond bar charts best practices in data visualization
Beyond bar charts   best practices in data visualizationBeyond bar charts   best practices in data visualization
Beyond bar charts best practices in data visualizationBen Jones
 
How Non Profits Use Tableau to Affect Social Change
How Non Profits Use Tableau to Affect Social ChangeHow Non Profits Use Tableau to Affect Social Change
How Non Profits Use Tableau to Affect Social ChangeBen Jones
 
Communicating Data with Tableau Webinar, Aug 26, 2014
Communicating Data with Tableau Webinar, Aug 26, 2014Communicating Data with Tableau Webinar, Aug 26, 2014
Communicating Data with Tableau Webinar, Aug 26, 2014Ben Jones
 
eyeo 2014 - Thinking with Data
eyeo 2014 - Thinking with Dataeyeo 2014 - Thinking with Data
eyeo 2014 - Thinking with DataBen Jones
 
Tableau Public Overview
Tableau Public OverviewTableau Public Overview
Tableau Public OverviewBen Jones
 
The briefing room how data visualization enhances the news
The briefing room   how data visualization enhances the newsThe briefing room   how data visualization enhances the news
The briefing room how data visualization enhances the newsBen Jones
 
7 Lessons from the Pioneers of Data Visualization
7 Lessons from the Pioneers of Data Visualization7 Lessons from the Pioneers of Data Visualization
7 Lessons from the Pioneers of Data VisualizationBen Jones
 
How to view your website stats in tableau
How to view your website stats in tableauHow to view your website stats in tableau
How to view your website stats in tableauBen Jones
 
Data visualization new york 20130701
Data visualization new york 20130701Data visualization new york 20130701
Data visualization new york 20130701Ben Jones
 
Beyond the written word - visual data in journalism IRE 2013
Beyond the written word - visual data in journalism IRE 2013Beyond the written word - visual data in journalism IRE 2013
Beyond the written word - visual data in journalism IRE 2013Ben Jones
 
Tableau tech activist conference
Tableau   tech activist conferenceTableau   tech activist conference
Tableau tech activist conferenceBen Jones
 
My week at 12
My week at 12My week at 12
My week at 12Ben Jones
 
How to create a tableau waterfall chart
How to create a tableau waterfall chartHow to create a tableau waterfall chart
How to create a tableau waterfall chartBen Jones
 

Mais de Ben Jones (19)

Data Literacy Presentation at Madison Tableau User Group
Data Literacy Presentation at Madison Tableau User GroupData Literacy Presentation at Madison Tableau User Group
Data Literacy Presentation at Madison Tableau User Group
 
Data Literacy Webinar 003 - Finding & Gathering Data
Data Literacy Webinar 003 - Finding & Gathering DataData Literacy Webinar 003 - Finding & Gathering Data
Data Literacy Webinar 003 - Finding & Gathering Data
 
17 Key Traits of Data Literacy
17 Key Traits of Data Literacy17 Key Traits of Data Literacy
17 Key Traits of Data Literacy
 
Using Data Visualization to Inform and Inspire
Using Data Visualization to Inform and InspireUsing Data Visualization to Inform and Inspire
Using Data Visualization to Inform and Inspire
 
Data Visualization and Law Enforcement
Data Visualization and Law EnforcementData Visualization and Law Enforcement
Data Visualization and Law Enforcement
 
Nature and Viz
Nature and VizNature and Viz
Nature and Viz
 
Beyond bar charts best practices in data visualization
Beyond bar charts   best practices in data visualizationBeyond bar charts   best practices in data visualization
Beyond bar charts best practices in data visualization
 
How Non Profits Use Tableau to Affect Social Change
How Non Profits Use Tableau to Affect Social ChangeHow Non Profits Use Tableau to Affect Social Change
How Non Profits Use Tableau to Affect Social Change
 
Communicating Data with Tableau Webinar, Aug 26, 2014
Communicating Data with Tableau Webinar, Aug 26, 2014Communicating Data with Tableau Webinar, Aug 26, 2014
Communicating Data with Tableau Webinar, Aug 26, 2014
 
eyeo 2014 - Thinking with Data
eyeo 2014 - Thinking with Dataeyeo 2014 - Thinking with Data
eyeo 2014 - Thinking with Data
 
Tableau Public Overview
Tableau Public OverviewTableau Public Overview
Tableau Public Overview
 
The briefing room how data visualization enhances the news
The briefing room   how data visualization enhances the newsThe briefing room   how data visualization enhances the news
The briefing room how data visualization enhances the news
 
7 Lessons from the Pioneers of Data Visualization
7 Lessons from the Pioneers of Data Visualization7 Lessons from the Pioneers of Data Visualization
7 Lessons from the Pioneers of Data Visualization
 
How to view your website stats in tableau
How to view your website stats in tableauHow to view your website stats in tableau
How to view your website stats in tableau
 
Data visualization new york 20130701
Data visualization new york 20130701Data visualization new york 20130701
Data visualization new york 20130701
 
Beyond the written word - visual data in journalism IRE 2013
Beyond the written word - visual data in journalism IRE 2013Beyond the written word - visual data in journalism IRE 2013
Beyond the written word - visual data in journalism IRE 2013
 
Tableau tech activist conference
Tableau   tech activist conferenceTableau   tech activist conference
Tableau tech activist conference
 
My week at 12
My week at 12My week at 12
My week at 12
 
How to create a tableau waterfall chart
How to create a tableau waterfall chartHow to create a tableau waterfall chart
How to create a tableau waterfall chart
 

Último

presentation ICT roal in 21st century education
presentation ICT roal in 21st century educationpresentation ICT roal in 21st century education
presentation ICT roal in 21st century educationjfdjdjcjdnsjd
 
"I see eyes in my soup": How Delivery Hero implemented the safety system for ...
"I see eyes in my soup": How Delivery Hero implemented the safety system for ..."I see eyes in my soup": How Delivery Hero implemented the safety system for ...
"I see eyes in my soup": How Delivery Hero implemented the safety system for ...Zilliz
 
Apidays Singapore 2024 - Scalable LLM APIs for AI and Generative AI Applicati...
Apidays Singapore 2024 - Scalable LLM APIs for AI and Generative AI Applicati...Apidays Singapore 2024 - Scalable LLM APIs for AI and Generative AI Applicati...
Apidays Singapore 2024 - Scalable LLM APIs for AI and Generative AI Applicati...apidays
 
Web Form Automation for Bonterra Impact Management (fka Social Solutions Apri...
Web Form Automation for Bonterra Impact Management (fka Social Solutions Apri...Web Form Automation for Bonterra Impact Management (fka Social Solutions Apri...
Web Form Automation for Bonterra Impact Management (fka Social Solutions Apri...Jeffrey Haguewood
 
Connector Corner: Accelerate revenue generation using UiPath API-centric busi...
Connector Corner: Accelerate revenue generation using UiPath API-centric busi...Connector Corner: Accelerate revenue generation using UiPath API-centric busi...
Connector Corner: Accelerate revenue generation using UiPath API-centric busi...DianaGray10
 
Boost Fertility New Invention Ups Success Rates.pdf
Boost Fertility New Invention Ups Success Rates.pdfBoost Fertility New Invention Ups Success Rates.pdf
Boost Fertility New Invention Ups Success Rates.pdfsudhanshuwaghmare1
 
Polkadot JAM Slides - Token2049 - By Dr. Gavin Wood
Polkadot JAM Slides - Token2049 - By Dr. Gavin WoodPolkadot JAM Slides - Token2049 - By Dr. Gavin Wood
Polkadot JAM Slides - Token2049 - By Dr. Gavin WoodJuan lago vázquez
 
Repurposing LNG terminals for Hydrogen Ammonia: Feasibility and Cost Saving
Repurposing LNG terminals for Hydrogen Ammonia: Feasibility and Cost SavingRepurposing LNG terminals for Hydrogen Ammonia: Feasibility and Cost Saving
Repurposing LNG terminals for Hydrogen Ammonia: Feasibility and Cost SavingEdi Saputra
 
Artificial Intelligence Chap.5 : Uncertainty
Artificial Intelligence Chap.5 : UncertaintyArtificial Intelligence Chap.5 : Uncertainty
Artificial Intelligence Chap.5 : UncertaintyKhushali Kathiriya
 
Apidays New York 2024 - The value of a flexible API Management solution for O...
Apidays New York 2024 - The value of a flexible API Management solution for O...Apidays New York 2024 - The value of a flexible API Management solution for O...
Apidays New York 2024 - The value of a flexible API Management solution for O...apidays
 
Corporate and higher education May webinar.pptx
Corporate and higher education May webinar.pptxCorporate and higher education May webinar.pptx
Corporate and higher education May webinar.pptxRustici Software
 
Automating Google Workspace (GWS) & more with Apps Script
Automating Google Workspace (GWS) & more with Apps ScriptAutomating Google Workspace (GWS) & more with Apps Script
Automating Google Workspace (GWS) & more with Apps Scriptwesley chun
 
MINDCTI Revenue Release Quarter One 2024
MINDCTI Revenue Release Quarter One 2024MINDCTI Revenue Release Quarter One 2024
MINDCTI Revenue Release Quarter One 2024MIND CTI
 
Ransomware_Q4_2023. The report. [EN].pdf
Ransomware_Q4_2023. The report. [EN].pdfRansomware_Q4_2023. The report. [EN].pdf
Ransomware_Q4_2023. The report. [EN].pdfOverkill Security
 
AWS Community Day CPH - Three problems of Terraform
AWS Community Day CPH - Three problems of TerraformAWS Community Day CPH - Three problems of Terraform
AWS Community Day CPH - Three problems of TerraformAndrey Devyatkin
 
GenAI Risks & Security Meetup 01052024.pdf
GenAI Risks & Security Meetup 01052024.pdfGenAI Risks & Security Meetup 01052024.pdf
GenAI Risks & Security Meetup 01052024.pdflior mazor
 
Strategize a Smooth Tenant-to-tenant Migration and Copilot Takeoff
Strategize a Smooth Tenant-to-tenant Migration and Copilot TakeoffStrategize a Smooth Tenant-to-tenant Migration and Copilot Takeoff
Strategize a Smooth Tenant-to-tenant Migration and Copilot Takeoffsammart93
 
Architecting Cloud Native Applications
Architecting Cloud Native ApplicationsArchitecting Cloud Native Applications
Architecting Cloud Native ApplicationsWSO2
 
TrustArc Webinar - Unlock the Power of AI-Driven Data Discovery
TrustArc Webinar - Unlock the Power of AI-Driven Data DiscoveryTrustArc Webinar - Unlock the Power of AI-Driven Data Discovery
TrustArc Webinar - Unlock the Power of AI-Driven Data DiscoveryTrustArc
 
MS Copilot expands with MS Graph connectors
MS Copilot expands with MS Graph connectorsMS Copilot expands with MS Graph connectors
MS Copilot expands with MS Graph connectorsNanddeep Nachan
 

Último (20)

presentation ICT roal in 21st century education
presentation ICT roal in 21st century educationpresentation ICT roal in 21st century education
presentation ICT roal in 21st century education
 
"I see eyes in my soup": How Delivery Hero implemented the safety system for ...
"I see eyes in my soup": How Delivery Hero implemented the safety system for ..."I see eyes in my soup": How Delivery Hero implemented the safety system for ...
"I see eyes in my soup": How Delivery Hero implemented the safety system for ...
 
Apidays Singapore 2024 - Scalable LLM APIs for AI and Generative AI Applicati...
Apidays Singapore 2024 - Scalable LLM APIs for AI and Generative AI Applicati...Apidays Singapore 2024 - Scalable LLM APIs for AI and Generative AI Applicati...
Apidays Singapore 2024 - Scalable LLM APIs for AI and Generative AI Applicati...
 
Web Form Automation for Bonterra Impact Management (fka Social Solutions Apri...
Web Form Automation for Bonterra Impact Management (fka Social Solutions Apri...Web Form Automation for Bonterra Impact Management (fka Social Solutions Apri...
Web Form Automation for Bonterra Impact Management (fka Social Solutions Apri...
 
Connector Corner: Accelerate revenue generation using UiPath API-centric busi...
Connector Corner: Accelerate revenue generation using UiPath API-centric busi...Connector Corner: Accelerate revenue generation using UiPath API-centric busi...
Connector Corner: Accelerate revenue generation using UiPath API-centric busi...
 
Boost Fertility New Invention Ups Success Rates.pdf
Boost Fertility New Invention Ups Success Rates.pdfBoost Fertility New Invention Ups Success Rates.pdf
Boost Fertility New Invention Ups Success Rates.pdf
 
Polkadot JAM Slides - Token2049 - By Dr. Gavin Wood
Polkadot JAM Slides - Token2049 - By Dr. Gavin WoodPolkadot JAM Slides - Token2049 - By Dr. Gavin Wood
Polkadot JAM Slides - Token2049 - By Dr. Gavin Wood
 
Repurposing LNG terminals for Hydrogen Ammonia: Feasibility and Cost Saving
Repurposing LNG terminals for Hydrogen Ammonia: Feasibility and Cost SavingRepurposing LNG terminals for Hydrogen Ammonia: Feasibility and Cost Saving
Repurposing LNG terminals for Hydrogen Ammonia: Feasibility and Cost Saving
 
Artificial Intelligence Chap.5 : Uncertainty
Artificial Intelligence Chap.5 : UncertaintyArtificial Intelligence Chap.5 : Uncertainty
Artificial Intelligence Chap.5 : Uncertainty
 
Apidays New York 2024 - The value of a flexible API Management solution for O...
Apidays New York 2024 - The value of a flexible API Management solution for O...Apidays New York 2024 - The value of a flexible API Management solution for O...
Apidays New York 2024 - The value of a flexible API Management solution for O...
 
Corporate and higher education May webinar.pptx
Corporate and higher education May webinar.pptxCorporate and higher education May webinar.pptx
Corporate and higher education May webinar.pptx
 
Automating Google Workspace (GWS) & more with Apps Script
Automating Google Workspace (GWS) & more with Apps ScriptAutomating Google Workspace (GWS) & more with Apps Script
Automating Google Workspace (GWS) & more with Apps Script
 
MINDCTI Revenue Release Quarter One 2024
MINDCTI Revenue Release Quarter One 2024MINDCTI Revenue Release Quarter One 2024
MINDCTI Revenue Release Quarter One 2024
 
Ransomware_Q4_2023. The report. [EN].pdf
Ransomware_Q4_2023. The report. [EN].pdfRansomware_Q4_2023. The report. [EN].pdf
Ransomware_Q4_2023. The report. [EN].pdf
 
AWS Community Day CPH - Three problems of Terraform
AWS Community Day CPH - Three problems of TerraformAWS Community Day CPH - Three problems of Terraform
AWS Community Day CPH - Three problems of Terraform
 
GenAI Risks & Security Meetup 01052024.pdf
GenAI Risks & Security Meetup 01052024.pdfGenAI Risks & Security Meetup 01052024.pdf
GenAI Risks & Security Meetup 01052024.pdf
 
Strategize a Smooth Tenant-to-tenant Migration and Copilot Takeoff
Strategize a Smooth Tenant-to-tenant Migration and Copilot TakeoffStrategize a Smooth Tenant-to-tenant Migration and Copilot Takeoff
Strategize a Smooth Tenant-to-tenant Migration and Copilot Takeoff
 
Architecting Cloud Native Applications
Architecting Cloud Native ApplicationsArchitecting Cloud Native Applications
Architecting Cloud Native Applications
 
TrustArc Webinar - Unlock the Power of AI-Driven Data Discovery
TrustArc Webinar - Unlock the Power of AI-Driven Data DiscoveryTrustArc Webinar - Unlock the Power of AI-Driven Data Discovery
TrustArc Webinar - Unlock the Power of AI-Driven Data Discovery
 
MS Copilot expands with MS Graph connectors
MS Copilot expands with MS Graph connectorsMS Copilot expands with MS Graph connectors
MS Copilot expands with MS Graph connectors
 

Data Viz for Academic Research