

Recomendados
Mais conteúdo relacionado
Mais procurados
Mais procurados (20)
Destaque
Semelhante a 09 11 17 Web 2.0 Weekly
Semelhante a 09 11 17 Web 2.0 Weekly (20)
Mais de David Shore
Mais de David Shore (17)
Último
Último (20)
09 11 17 Web 2.0 Weekly
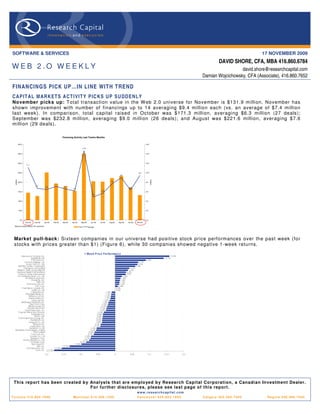
- 1. SOFTWARE & SERVICES 17 NOVEMBER 2009 DAVID SHORE, CFA, MBA 416.860.6784 WEB 2.O WEEKLY david.shore@researchcapital.com Damian Wojcichowsky, CFA (Associate), 416.860.7652 FINANCINGS PICK UP…IN LINE WITH TREND CA P IT AL M AR K ET S AC T I VIT Y P IC K S U P S U DD E NL Y November picks up: Total transaction value in the W eb 2.0 universe for November is $131.9 million. November has shown improvement with number of financings up to 14 averaging $9.4 million each (vs. an average of $7.4 million last week). In comparison, total capital raised in October was $171.3 million, averaging $6.3 million (27 deals); September was $232.8 million, averaging $9.0 million (26 deals); and August was $221.6 million, averaging $7.6 million (29 deals). Financing Activity Last Twelve Months 400.0 16.0 14.6 350.0 14.0 300.0 12.0 11.1 250.0 9.4 10.0 9.0 (US$m) (US$m) 200.0 7.6 8.0 7.1 6.7 6.6 6.5 6.3 6.2 150.0 5.6 6.0 4.9 100.0 4.0 50.0 2.0 0.0 0.0 Nov-08 Dec-08 Jan-09 Feb-09 Mar-09 Apr-09 May-09 Jun-09 Jul-09 Aug-09 Sep-09 Oct-09 Nov-09 *May-09 includes $200m FB investment Total Average Market pull-back: Sixteen companies in our universe had positive stock price performances over the past week (for stocks with prices greater than $1) (Figure 6), while 30 companies showed negative 1-week returns. 1 Wee k P rice P erformance Openw ave S y s tems Inc . 15.8% G igaMedia L td. 14.1% Y nk K orea Inc . 9.0% Tenc ent Holdings L td. 6. 7% A ctoz S oft Co., L td. 6.5% NEOWIZ G ames Corporation 5. 9% Changy ou. c om L imited 4. 1% Modern Times G roup Mtg A B 3. 7% G amania Digital Entertainment 3.2% Chines e G amer International 3.0% S K Communic ations Co., L td. 2.0% IA C/InterA c tiveCorp. 1. 6% S hutterfly, Inc . 1.4% XING A G 1. 2% TheS treet. com, Inc . 1. 2% CDC Corp. 0. 8% Fluid Mus ic Canada, Inc . 0. 0% Eolith Co. L td. 0. 0% V alueClic k Inc . -1.0% PNI Digital Media Inc . -1. 1% Neteas e.c om Inc . -1.2% United Online Inc . -1.3% S ohu.c om Inc . -1.6% NetDragon WebS of t, Inc . -1. 9% Open Tex t Corp. -2.0% My riad G roup A G -2. 3% S handa Interac tive -2.5% S park Netw orks , Inc . -2.6% Frogs ter Interactive Pic tures -3. 3% Cy berplex Inc . -3. 6% DA DA S pA -3. 6% G iant Interac tive G roup, Inc . -3.7% HanbitS of t, Inc . -3.8% K ings of t Co. L td. -3.8% W ebz en Inc . -4.2% L ookS mart, L td. -4.3% G ameOn Co L td. -5. 4% Northgate Technologies L imited -5.5% The9 L imited -6.0% Tree.Com, Inc . -6. 2% G ravity Co. , L td -7. 0% Quepas a Corp. -7.1% Perfec t World Co., L td. -7.6% Y D Online Corp. -8.4% Ngi G roup Inc . -9.8% Mix i, Inc . -13. 2% A Q Interac tive, Inc . -15.6% G ree, Inc . -17.7% -0.2 -0. 15 -0.1 -0.05 0 0. 05 0.1 0. 15 0. 2 This report has been created b y Anal ysts that are emplo yed b y Research Capital Corporation, a Canadian Investment Dealer. For further disclosures, please see last page of this report. w w w . r e s e a rc h c a p i t a l . c o m T o ro n t o 4 1 6 . 8 6 0 . 7 6 0 0 Montreal 514.399.1500 Vancouver 604.662.1800 Calgary 403.265.7400 Regina 306.566.7550
- 2. Page 2 THE WEB 2.0 UNIVERSE Eighty-nine public Web 2.0 companies: Our W eb 2.0 universe contains 89 companies, with a combined market cap of approximately $72 billion (Figure 1). The median market cap for the group is $41 million, with average trailing revenue of $163 million (median $56 million). The companies are also generally profitable with a median EBITDA margin of 11.6%. On a valuation basis, the overall average is 5.1x trailing revenue (median 1.7x) and 11.1x trailing EBITDA (median 7.8x). Twenty of the companies have more than 500 employees. C omparable C ompany Analys is > Web 2.0 Trading C urrent US D Market US D L TM Total US D L TM Total E B ITDA TE V/L TM TE V/L TM C ompany Name L TM as of Ticker E xc hange C urrency HQ P rice C ap ($m) R ev ($m) E B ITDA ($m) % R evenue E B ITDA E mployees Accelerize New Media , Inc. 6/30/2009 AC LZ OT C B B US D United S ta tes 0. 73 20. 4 4. 4 (3.7) -83. 3% 5. 7x - 11 Actoz S oft C o. , Ltd. 6/30/2009 A052790 K OS E KR W S outh K orea 16,450 119. 5 108.7 25. 9 23. 8% 0. 8x 3. 4x NA AQ Interactive, Inc. 6/30/2009 3838 TS E JPY J a pan 40,000 24. 3 66. 1 (2.0) -2.9% 0. 0x - NA As s ociated Media Holdings Inc. 6/30/2007 AS MH OT C P K US D United S ta tes 0. 76 32. 9 0. 1 (2.3) NM - - 3 B igs tring C orp. 6/30/2009 BS GC OT C B B US D United S ta tes 0. 03 1.9 0. 1 (1.5) NM 47.2x - 4 B eta wave C orporation 6/30/2009 B W AV OT C B B US D United S ta tes 0. 04 1.0 9. 4 (12. 6) NM - - 51 B eyond C ommerce, Inc. 6/30/2009 B Y OC OT C B B US D United S ta tes 0. 06 3.0 11. 7 (12. 8) NM 0. 8x - 101 B right T hings plc 3/31/2009 AIM: B G T AIM GBP United K ingdom 0. 01 5.1 0. 0 (2.7) NM - - NA B roa dW ebAs ia Inc. 9/30/2008 BWBA OT C P K US D United S ta tes 0. 07 5.9 0. 0 (4.6) NM - - 46 C DC C orp. 6/30/2009 C HIN. A Na s daqG S US D Hong K ong 2. 54 269. 2 361.6 25. 1 6.9% 0. 7x 10. 5x 2, 227 #R E F ! 9/30/2009 C Y OU Na s daqG S US D C hina 34. 50 1,897. 5 255.3 157.4 61. 7% 6. 2x 10. 1x 628 C hina G a teway C orporation 9/30/2008 CGWY OT C P K US D United S ta tes 0. 00 0.0 6. 7 (6.6) -98. 9% 0. 0x - 37 C hines e G amer Interna tiona l 9/30/2009 G T S M: 3083 GTS M TWD T aiwa n 458 1,186. 5 68. 3 39. 6 58. 0% 16.2x 27. 9x NA C LIC K E R Inc. 5/31/2009 C LK Z OT C B B US D United S ta tes 0. 01 0.6 2. 5 (1.2) -45. 8% 0. 3x - 22 C ornerW orld C orpora tion 7/31/2009 CWR L OT C B B US D United S ta tes 0. 06 5.7 6. 8 NM NM 2. 4x - 16 C yberplex Inc. 6/30/2009 T S X :C X TS X C AD C anada 1 81. 1 89. 8 9.7 10. 8% 0. 7x 6. 3x NA DADA S pA 6/30/2009 C M: DA CM E UR Italy 7. 09 168. 2 241.9 31. 8 13. 1% 0. 9x 6. 8x NA DXN Holdings B hd 8/31/2009 DX N K LS E MY R Ma la ys ia 0. 62 40. 5 77. 3 (84. 0) NM 0. 7x - NA Dibz International, Inc. NA DIB Z OT C P K US D United S ta tes 0. 00 0.0 NA NM NM - - NA DigitalP os t Interactive, Inc. 6/30/2009 DG LP OT C B B US D United S ta tes 0. 06 4.6 1. 0 (1.4) NM 6. 6x - 7 DigitalT own, Inc. 8/31/2009 DG T W OT C B B US D United S ta tes 1. 20 32. 8 0. 0 (1.8) NM - - 3 Dolphin Digital Media , Inc. 6/30/2009 DP DM OT C B B US D United S ta tes 0. 33 17. 7 0. 6 (3.4) NM 32.1x - NA E olith C o. Ltd. 12/31/2008 A041060 K OS E KR W S outh K orea 570 34. 6 15. 4 (3.6) -23. 6% 2. 4x - NA E xtens ions , Inc. 6/30/2009 E XT I OT C P K US D United S ta tes 0. 30 13. 3 NM NM NM - - 2 F luid Mus ic C a nada , Inc. 6/30/2009 T S X :F MN TS X C AD United S ta tes 1. 80 86. 8 5. 3 (5.1) -95. 2% 15.4x - NA F rogs ter Interactive P ictures AG 6/30/2009 FRG XT R A E UR G ermany 18. 05 67. 7 9. 6 (4.5) -47. 0% 6. 9x - NA G ama nia Digita l E ntertainment C o., Ltd. 9/30/2009 6180 GTS M TWD T aiwa n 46. 50 217. 8 151.2 24. 9 16. 5% 1. 3x 7. 8x NA G ameOn C o Ltd. 6/30/2009 3812 TS E JPY J a pan 68,300 73. 9 81. 9 20. 1 24. 5% - - NA G eoS entric O yj 6/30/2009 G E O 1V HL S E E UR F inland 0. 06 78. 9 5. 4 (17. 4) NM 14.5x - 115 G iant Interactive G roup, Inc. 6/30/2009 GA NY S E US D C hina 7 1,587. 4 198.5 124.1 62. 5% - - 1, 570 G iga Media Ltd. 3/31/2009 G IG M Na s daqG S US D T aiwa n 4. 36 237. 7 183.6 NM NM 0. 9x - 751 G ravity C o., Ltd 6/30/2009 GR VY Na s daqG M US D S outh K orea 1. 46 40. 6 49. 1 16. 6 33. 9% - - 469 G ree, Inc. 9/30/2009 T S E : 3632 TS E JPY J a pan 4,450 2,227. 9 210.3 122.2 58. 1% 10.1x 17. 4x NA G ungHo O nline E ntertainment, Inc. 6/30/2009 3765 OS E JPY J a pan 169,000 216. 5 119.5 26. 6 22. 2% 1. 5x 6. 9x NA HanbitS oft, Inc. 6/30/2009 A047080 K OS E KR W S outh K orea 3,445 63. 2 60. 7 1.4 2.3% 0. 8x 35. 1x NA IAC /InterActiveC orp. 9/30/2009 IAC I Na s daqG S US D United S ta tes 19. 93 2,630. 2 1, 359. 6 82. 4 6.1% 0. 7x 12. 0x 3, 200 IAS E nergy, Inc. 4/30/2009 IAS A. E OT C B B US D C anada 0. 12 8.5 0. 0 (0.6) NM - - NA is eemedia Inc. 6/30/2009 IE E T S XV C AD C anada 0. 17 8.2 1. 7 (4.5) NM 4. 7x - NA J umbuck E nterta inment Limited 6/30/2009 AS X :J MB AS X AUD Aus tralia 0. 33 14. 0 16. 7 7.2 42. 8% 0. 5x 1. 1x 79 K AB Dis tribution Inc. 6/30/2009 T S X :K AB TS X C AD C anada 0 0.6 67. 9 4.0 5.8% - - NA K ings oft C o. Ltd. 6/30/2009 3888 S E HK HK D C hina 7 1,033. 9 139.1 61. 4 44. 2% 7. 4x 16. 7x 2, 463 Lingo Media C orporation 6/30/2009 T S X V :LM T S XV C AD C anada 0. 99 11. 3 1. 2 (1.9) NM 8. 7x - NA LiveW orld Inc. 9/30/2009 LVW D OT C P K US D United S ta tes 0. 03 1.0 10. 4 0.4 4.1% - - NA LookS mart, Ltd. 9/30/2009 L OO K Na s daqG M US D United S ta tes 1. 12 19. 2 54. 0 (4.5) -8.4% - - 90 Magnitude Information S ys tems Inc. 6/30/2009 MAG Y OT C B B US D United S ta tes 0. 02 8.6 0. 1 (2.5) NM - - 14 Mixi, Inc. 9/30/2009 2121 TS E JPY J a pan 642000. 00 1,106. 3 139.6 46. 2 33. 1% 7. 0x 21. 1x NA Modern T imes G roup Mtg AB 9/30/2009 MT G B OM SEK S weden 335. 00 3,170. 3 2, 002. 6 282.9 14. 1% 1. 9x 13. 1x 2, 969 MO K O .mobi Limited 6/30/2009 MK B AS X AUD Aus tralia 0. 09 8.3 0. 7 (2.4) NM 10.6x - NA Myriad G roup AG 6/30/2009 MY R N SWX C HF S witzerland 4. 68 200. 7 63. 0 3.4 5.4% 3. 1x - 405 NE O W IZ G ames C orpora tion 12/31/2008 A095660 K OS E KR W S outh K orea 41550. 00 734. 0 207.3 55. 7 26. 8% 3. 5x 13. 0x NA NetDragon W ebS oft, Inc. 6/30/2009 777 S E HK HK D C hina 5 344. 4 89. 3 25. 7 28. 7% 2. 2x 7. 7x 3, 109 Neteas e. com Inc. 6/30/2009 NT E S Na s daqG S US D C hina 41. 48 5,368. 6 472.4 297.4 63. 0% - - 3, 109 NeuLion Incorporated 6/30/2009 T S X :NLN TS X C AD C anada 0. 72 77. 1 21. 5 (13. 0) -60. 3% 3. 1x - 237 NeXplore C orporation 6/30/2009 NX P C OT C P K US D United S ta tes 1 38. 5 1. 7 (13. 3) NM 25.0x - NA Ngi G roup Inc. 6/30/2009 2497 TS E JPY J a pan 24000. 00 33. 2 93. 0 6.9 7.4% - - NA Northgate T echnologies L imited 6/30/2009 590057 BSE INR India 29. 15 21. 2 82. 9 (41. 5) -50. 0% 0. 3x - NA O pen T ext C orp. 9/30/2009 OT E X Na s daqG S US D C anada 38. 24 2,156. 0 814.5 211.1 25. 9% 2. 7x 10. 5x 3, 900 O penwave S ys tems Inc. 9/30/2009 OP W V Na s daqG S US D United S ta tes 2. 49 208. 0 190.5 6.2 3.3% 0. 5x 16. 6x 590 P erfect W orld C o. , Ltd. 6/30/2009 PWRD Na s daqG S US D C hina 45. 37 2,286. 3 255.6 142.2 55. 6% 0. 8x 1. 4x 2, 096 P NI Digital Media Inc. 6/30/2009 T S X V :P N T S XV C AD C anada 1. 74 54. 7 21. 0 2.3 11. 0% 2. 5x 22. 8x NA Q uepa s a C orp. 6/30/2009 QP S A OT C B B US D United S ta tes 1 16. 6 0. 2 (10. 6) NM - - 74 O AO R B C Information S ys tems 12/31/2007 R BCI R TS US D R us s ia 1. 60 222. 0 157.4 20. 6 13. 1% 0. 0x 0. 4x NA S handa Interactive E nterta inment Ltd. 6/30/2009 S NDA Na s daqG S US D C hina 49. 13 3,304. 2 629.0 296.7 47. 2% - - 3, 124 S hutterfly, Inc. 9/30/2009 S FLY Na s daqG S US D United S ta tes 15. 76 404. 6 223.1 27. 0 12. 1% 1. 3x 10. 8x 514 S K C ommunications C o., Ltd. 12/31/2008 A066270 K OS E KR W S outh K orea 7290. 00 255. 8 192.7 12. 5 6.5% 1. 3x 20. 4x NA S NAP Interactive, Inc. 6/30/2009 S TVI OT C B B US D United S ta tes 0 2.2 3. 5 0.9 27. 0% 0. 2x 0. 6x 11 S NM G loba l Holdings 9/30/2008 S NMN OT C P K US D United S ta tes 0. 00 0.0 2. 0 (0.7) -34. 8% 1. 1x - 33 S ocial Media V entures Inc. 12/31/2008 S MV I OT C P K US D United S ta tes 0 0.0 0. 1 (0.1) -60. 6% 4. 5x - NA S ocialwis e, Inc. 6/30/2009 S C LW OT C B B US D United S ta tes 0. 51 22. 6 0. 0 (5.6) NM - - NA S ohu. com Inc. 9/30/2009 S O HU Na s daqG S US D C hina 56. 94 2,189. 7 501.0 218.4 43. 6% 3. 3x 7. 5x 3, 197 S park Networks , Inc. 9/30/2009 L OV AME X US D United S ta tes 3 53. 5 47. 5 10. 0 21. 0% 1. 0x 5. 0x 183 S pectrumDNA, Inc. 6/30/2009 S P XA OT C B B US D United S ta tes 0 7.3 0. 1 (2.5) NM - - 7 T encent Holdings Ltd. 6/30/2009 700 S E HK HK D C hina 148 34, 735.2 1, 391. 6 680.3 48. 9% 27.6x - 6, 421 T he P arent C ompany 8/2/2008 K IDS . Q OT C P K US D United S ta tes 0. 01 0.2 112.0 (13. 5) -12. 0% 0. 2x - 347 T he9 Limited 12/31/2008 NC T Y Na s daqG S US D C hina 7. 41 185. 9 250.6 85. 5 34. 1% - - 1, 626 T heS treet. com, Inc. 3/31/2009 TS CM Na s daqG M US D United S ta tes 2. 48 75. 9 67. 0 1.9 2.9% 0. 2x 5. 8x 310 T ree.C om, Inc. 9/30/2009 TR E E Na s daqG M US D United S ta tes 7. 30 79. 6 217.1 9.7 4.5% 0. 2x 5. 5x 700 Unis erve C ommunica tions C orp. 8/31/2009 T S X V :US S T S XV C AD C anada 0. 04 0.8 16. 1 0.1 0.9% 0. 3x 36. 4x NA United O nline Inc. 9/30/2009 UNT D Na s daqG S US D United S ta tes 8. 22 695. 3 996.8 214.9 21. 6% 1. 0x 4. 4x 1, 469 UOMO Media, Inc 7/31/2009 UO MO OT C B B US D C anada 0 5.9 0. 8 (0.4) -54. 2% 8. 0x - NA V alueC lick Inc. 9/30/2009 V C LK Na s daqG S US D United S ta tes 10 882. 4 545.7 130.8 24. 0% 1. 3x 5. 5x 1, 189 V OIS , Inc. 6/30/2009 V O IS OT C B B US D United S ta tes 0 5.5 0. 0 (1.0) NM - - 4 W ebzen Inc. 6/30/2009 W ZE N Na s daqG M US D S outh K orea 2. 96 35. 1 23. 2 2.3 9.9% - - 328 W izzard S oftwa re C orporation 6/30/2009 W ZE AME X US D United S ta tes 0. 49 24. 6 5. 3 (4.5) -84. 9% 4. 8x - 110 W orlds . com Inc. 6/30/2009 W DDD OT C B B US D United S ta tes 0. 10 5.2 0. 1 (0.7) NM - - 1 W ynds torm C orpora tion NA W Y ND OT C P K US D United S ta tes 0. 10 1.8 NA NM NM - - NA XING AG 6/30/2009 O 1B C XT R A E UR G ermany 32. 70 252. 5 58. 9 17. 0 28. 8% 3. 4x 11. 8x 246 Y D O nline C orp. 12/31/2007 A052770 K OS E KR W S outh K orea 6520. 00 82. 0 57. 4 12. 4 21. 6% 1. 6x 7. 3x NA Y nk K orea Inc. 12/31/2008 A023770 K OS E KR W S outh K orea 4380. 00 19. 6 11. 9 1.3 10. 5% - - NA High 34, 735.2 2,002. 6 680. 3 63. 0% 47.2x 36. 4x 6, 421 Low 0.0 0. 0 -84.0 -98. 9% - - 1 Average 808.7 163.0 39.4 6.3% 5.1x 11.1x 945 Median 40. 5 55.7 1. 7 11. 6% 1. 6x 7. 8x 246 Figure 1. Web 2.0 Universe Summary Source. Capital IQ
- 3. Page 3 C A P I T A L M A R K E T S A C T I V I T Y (M & A A N D F I N A N C I N G ) November picks up: Total transaction value in the W eb 2.0 universe for November is $131.9 million. November has shown improvement with number of financings up to 14 averaging $9.4 million each (vs. an average of $7.4 million last week). In comparison, total capital raised in October was $171.3 million, averaging $6.3 million (27 deals); September was $232.8 million, averaging $9.0 million (26 deals); and August was $221.6 million, averaging $7.6 million (29 deals). Financing Activity Last Twelve Months 400.0 16.0 14.6 350.0 14.0 300.0 12.0 11.1 250.0 9.4 10.0 9.0 (US$m) (US$m) 200.0 7.6 8.0 7.1 6.7 6.6 6.5 6.3 6.2 150.0 5.6 6.0 4.9 100.0 4.0 50.0 2.0 0.0 0.0 Nov-08 Dec-08 Jan-09 Feb-09 Mar-09 Apr-09 May-09 Jun-09 Jul-09 Aug-09 Sep-09 Oct-09 Nov-09 *May-09 includes $200m FB investment Total Average Figure 2. Financings, Last Twelve Months Source. Company reports
- 4. Page 4 eal round-up for November start: The large deal highlights for the month include: • Playfish – the UK-based social gaming company – was acquired by Electronic Arts in a deal potentially valued up to $400 million. • Playfire – the social gaming company – raised $43 million in its first round of venture financing. • Sezmi – maker of set top box tech – raised $25 million in a third round of VC funding. • Motley Fool – the financial information site – raised $25 million in an unattributed financing. • Phoenix New Media – the subsidiary of Phoenix Television, a popular Chinese news portal and media site – raised $25 million from Intel Capital and Bertelsmann Asia Investment Fund. All other deals in the month were in the amount of $10 million or less. For additional details on financings, see Figures 23 and 24 (at end of note). Financing & M/A Summary - Last Three Months 200.0 180.0 160.0 140.0 120.0 Nov-09 (US$m) 100.0 Oct-09 Sep-09 80.0 60.0 40.0 20.0 0.0 Phoenix New Media Motley Fool DailyMotion Millennial Media Jive Software Mzinga InXpo NextBio Reality Mobile HiveLive Aviary AppNexus Mocapay Fwix Vantrix Fizzback Linkedex Twitter Yext Box.net Skype PlayFish Evernote Ooyala Jobvite wooga Eventbrite YuMe Booyah Overtone Playfire Greystripe DailyBooth OnLive NowPublic Ecast Network Livebookings Alliance Health Networks MashLogic Tiny Pictures DataSync Dopplr Unisfair Fluther Scoopler VEVO Mint HubSpot StatusNet Aurora Feint Sezmi Technorati Ensequence Engine Yard CubeTree Vuclip Vdopia NeoEdge Credit Karma ViVu Blekko Godengo Loomia FourSquare EduFire Onehub Hot Potato IngBoo Chango Listia Altruik Scout Labs Conduit Labs Adfonic Playdom FeedRoom Alice.com Prosper.com Spigit ScanScout Amie Street TransGaming Inc. PopCap Games Riot Games Sometrics Imeem Gamelab.com Watercooler Figure 3. Capital Market Activity, Last Three Months Source. Company reports
- 5. Page 5 Social Networks the most active sector: Social Networks experienced the most financing activity among our W eb 2.0 sector categories in the past three months by number of transactions (9). Collaboration-related companies have been hot recently, garnering the second highest number of deals (7). Advertising continues to be among the highest activity sectors in the past quarter (7 deals) (Figure 4). The $2.0 billion acquisition of Skype skews the dollars transacted to the SMS/Voice segment, while the $400 million acquisition of Playfish brings the Virtual W orlds segment to the second highest total. Finally, the $170 million acquisition of Mint brings the Vertical Communities segment into third place. Capital Market Activity by Sector - Last Three Months 200.0 180.0 160.0 140.0 120.0 (US$m) 100.0 80.0 60.0 40.0 20.0 2,025.0 417.1 178.3 100.9 93.3 87.0 57.0 51.4 45.5 44.9 37.5 30.0 25.6 18.6 17.2 16.2 13.0 10.0 9.9 6.4 6.0 4.0 3.6 2.2 1.5 1.3 0.0 Comment/Reputation Social Commerce Communities Gaming Documents Microblog Media Collaboration Enterprise Mobile Publishing Online Learning Music Financial Services SMS/Voice Infrastructure Search Mobile Ad Classified Social Networks Virtual World Video Advertising Crowdsourced Aggregation Analytics Vertical Content # companies 1 4 2 2 6 6 3 9 7 7 3 4 2 3 2 5 4 1 2 2 1 3 2 1 1 1 Figure 4. Capital Market Activity, by Sector, Last Three Months Source. Company reports
- 6. Page 6 C A P I T A L M A R K E T S A C T I V I T Y (P R I C E P E R F O R M A N C E ) Web 2.0 index continues to outpace NASDAQ recovery: Our W eb 2.0 index (market-cap weighted) essentially mirrored the performance of the NASDAQ composite index from mid-2008 until Q1/09. Since then, the index has diverged in a much stronger recovery relative to the NASDAQ index (Figure 5). Web 2.0 Index Price Performance 250 200 150 100 50 0 11/17/2008 12/1/2008 12/15/2008 12/29/2008 1/12/2009 1/26/2009 2/9/2009 2/23/2009 3/9/2009 3/23/2009 4/6/2009 4/20/2009 5/4/2009 5/18/2009 6/1/2009 6/15/2009 6/29/2009 7/13/2009 7/27/2009 8/10/2009 8/24/2009 9/7/2009 9/21/2009 10/5/2009 10/19/2009 11/2/2009 11/16/2009 Index: Web 2.0 (Market Cap) ^COMP - Share Pricing Figure 5. Web 2.0 Price Performance Source. Capital IQ
- 7. Page 7 Market pull-back: Sixteen companies in our universe had positive stock price performances over the past week (for stocks with prices greater than $1) (Figure 6), while 30 companies showed negative 1-week returns. 1 Week P rice P erformance Openw ave S y s tems Inc. 15.8% G igaMedia Ltd. 14.1% Y nk K orea Inc. 9.0% Tencent Holdings Ltd. 6.7% A ctoz S of t Co., Ltd. 6.5% NEOWIZ Games Corporation 5.9% Changy ou.com Limited 4.1% Modern Times G roup Mtg A B 3.7% G amania Digita l Entertainment 3.2% Chines e Gamer International 3.0% S K Communications Co., Ltd. 2.0% IA C/InterA ctiveCorp. 1.6% S hutterfly , Inc. 1.4% XING A G 1.2% TheS treet.com, Inc. 1.2% CDC Corp. 0.8% Fluid Mus ic Cana da, Inc. 0.0% Eolith Co. Ltd. 0.0% V alueClick Inc. -1.0% PNI Digital Media Inc. -1.1% Neteas e.com Inc. -1.2% United Online Inc. -1.3% S ohu.com Inc. -1.6% NetDragon WebS of t, Inc. -1.9% Open Tex t Corp. -2.0% My riad Group A G -2.3% S handa Interactive -2.5% S park Netw orks , Inc. -2.6% Frogs ter Interactive Pictures -3.3% Cy berplex Inc. -3.6% DA DA S pA -3.6% Giant Interac tive G roup, Inc. -3.7% HanbitS of t, Inc. -3.8% K ings of t Co. Ltd. -3.8% Webz en Inc. -4.2% LookS mart, Ltd. -4.3% G ameOn Co Ltd. -5.4% Northgate Technologies Limited -5.5% The9 Limited -6.0% Tree.Com, Inc. -6.2% G ravity Co., Ltd -7.0% Quepas a Corp. -7.1% Perfect World Co., Ltd. -7.6% Y D Online Corp. -8.4% Ngi G roup Inc. -9.8% Mix i, Inc. -13.2% A Q Interactive, Inc. -15.6% G ree, Inc. -17.7% -0.2 -0.15 -0.1 -0.05 0 0.05 0.1 0.15 0.2 Figure 6. 1-Week Price Performance Source. Capital IQ
- 8. Page 8 P U B L I C C O M P A N Y I N D U S T R Y N E W S (P A R T N E R S H I P S , F I N A N C I A L R E S U L T S , N E W P R O D U C T S ) K ey Developments C ompany Headline Notes DigitalFX International, Inc . DigitalF X Interna tiona l, Inc. has a nnounced tha t it ha s filed a F orm 15 with the S ecurities a nd E xcha nge C ommis s ion to (OTC B B : DG FX) Digita lF X Interna tional F iles F orm 15 volunta rily deregis ter its common s tock under the S ecurities E xcha nge Act of 1934, a s a mended. T he par va lue of the common s tock is $0. 001 per s ha re. Hunan TV & B roadc as t Intermediary S ha nda Intera ctive E nterta inment L td. a nd Huna n T V & B roa dca s t Intermedia ry C o. L td. ha ve partnered to launch a joint C o., L td. (S ZS E : 000917); S handa venture. S ha nda will inves t $100 million in the new J V , for which L ong will be a ppointed chief opera ting officer (C E O ). No Interac tive E ntertainment L td. S ha nda Interactive E ntertainment, Huna n T V to L a unch J oint V enture officia l la unch da te ha s been dis clos ed. (Nas daqG S : S NDA) Quepas a C orp. (OTC B B : QP S A) Quepa s a C orp. a nnounced the forma tion of a cros s -functiona l tea m dedica ted to e-ma il ma nagement a nd delivera bility. As pa rt of this initiative, the company hired T ony P a tti a s Director of Delivera bilty. T ony is a recognized lea der in the field of e- ma il delivera bility. W ith a record of s ucces s s pa nning over a deca de, T ony ha s developed focus ed, cus tomized deliverability Quepas a C orp. Appoints T ony P a tti a s Director of Delivera bilty s olutions for s uch bra nds a s T ra velocity.com a nd T rue.com, helping them a chieve unprecedented delivery-to-inbox ra tes . As a n expert in e-ma il ma rketing, IS P rela tions , a nd the la tes t in indus try trends a nd s ta ndards , T ony's delivera bility s tewa rds hip ens ures tha t Quepas a's vita l ma rketing inves tment pa ys -ins tea d of being los t in s pa m filters . Open Text C orp. (Nas daqG S : OTE X) Open T ext C orp. announced tha t it ha s developed enterpris e fa x functiona lity s ea mles s ly integra ted with Micros oft E xcha nge S erver 2010. T his ens ures that enterpris es ca n migra te to E xcha nge S erver 2010, pres erve their inves tments in network- ba s ed fa x ca pa bility and unified mes s a ging s ys tems and provides the ability to a cces s faxing from mobile devices . Open T ext is a Micros oft G old C ertified P a rtner a nd 2009 IS V L ine of B us ines s P artner of the Y ea r fina lis t. F a xing continues to be a critica l requirement for many bus ines s es tha t need s igna tures , dra wings , a nd other pa per-bas ed content. In indus tries a nd bus ines s es s uch a s ba nking, hea lthca re, mortga ge compa nies , and patent offices , fa xes a re recognized a s importa nt lega l documents a nd vita l to bus ines s opera tion. W ith O pen T ext F a x S erver, R ightF ax E dition a nd E xcha nge S erver 2010, faxing becomes an integra l pa rt of the overall enterpris e infra s tructure, providing a s trong return on inves tment a nd reducing or elimina ting the need for phys ical fa x ma chines . Micros oft E xcha nge S erver 2010 is now a va ila ble for bus ines s es worldwide a nd will help orga niza tions reduce cos ts , protect communica tions a nd improve us er productivity. Open T ext F a x S erver is well-proven in the ma rketpla ce a nd it gives cus tomers a fa x s olution tha t s ea mles s ly connects with E xcha nge S erver 2010 Unified Mes s a ging. W orking Open T ext C orp. Develops E nterpris e F a x F unctiona lity S ea mles s ly Integra ted with Micros oft E xcha nge S erver 2010 clos ely with Micros oft, the compa ny developed the E xcha nge C onnector for E xchange S erver 2010, which routes fa xes into a nd out of the E xcha nge S erver 2010 s ys tem us ing O pen T ext F a x S erver, R ightF a x E dition, a s olution offered a s part of the Open T ext E C M S uite. W hen a fa x comes into a n enterpris e, E xcha nge S erver 2010 Unified Mes s a ging forwa rds it to the O pen T ext F a x S erver, which proces s es the document s o it ca n be tra ns mitted to a nd viewed within Micros oft O ffice Outlook a s a na tive fa x mes s a ge. It then routes the fa x through E xcha nge S erver to the recipient's Outlook inbox. T he origina l fa x a ppea rs a s a n e-mail a tta chment tha t a us er ca n s elect a nd view. Us ers ca n a ls o s end e-ma il mes s a ges and a tta chments to the F ax S erver from their Outlook inbox for fa xing to recipients outs ide the enterpris e. A s ignifica nt adva nta ge of Open T ext F a x S erver, is tha t fa xes a re digita lly protected, helping to prevent los s or a uthorized viewing of documents . L ogging a nd a uditing fea tures provide the a bility to review a nd tra ck a ll fa xes from s ender to recipient. VOIS , Inc . (OTC B B : VOIS ) V OIS Inc. a nnounced plans to introduce its Apple iP hone a pplica tion during the firs t quarter of 2010. T he new a pp is to be des igned to ena ble members of V OIS to ea s ily pos t projects , bid on projects , a nd s ocia lize the s a me wa y they currently do V OIS Inc. P la ns to Introduce Apple iP hone App During the F irs t Qua rter of 2010 on the V OIS web pla tform, but cus tomized to iP hone s pecifica tions . In a dva nce of the iP hone a pp V O IS is offering a V OIS webclip. T his will open up 3 buttons . Figure 7a. Key Developments Source. Capital IQ
- 9. Page 9 K ey Developments C ompany Headline Notes IAC /InterAc tiveC orp. (Nas daqG S : IAC I) IAC /InterA ctiveC orp. a nnounced tha t J oey Levin, currently IA C 's S enior V ice P res ident, Mergers & Acquis itions and F inance, ha s been na med C hief E xecutive Officer of Minds pa rk Intera ctive Network. S ha na F is her, currently S V P , Mergers IA C /InterActivecorp. Announces E xecutive C hanges & A cquis itions a nd S tra tegy of IA C will a s s ume J oey's M& A res pons ibilities in a ddition to her own. C urrent V ice P res ident of IAC F ina ncial P la nning & Ana lys is Ma rk S chneider will a s s ume J oey's fina nce res pons ibilities , reporting to E V P a nd C F O T om McInerney. R evyver, L L C ; S pec trumDNA, Inc . S pectrumDNA , Inc. (OT C B B : S P XA ) s igned a letter of intent to a cquire R evyver on November 10, 2008. T he fina ncia l terms (OTC B B : S P XA) S pectrumDNA, Inc. (O T C B B : S P XA) ca ncelled the a cquis ition of R evyver. of the trans a ction were not dis clos ed. A fter the tra ns a ction R evyver will opera te a s s ubs idia ry of S pectrumDNA , Inc. S ocialwis e, Inc . (OTC B B : S C L W ) On November 9, 2009, S ocia lwis e, Inc. has entered into a n a mendment of the 12% S enior Note between the compa ny a nd G emini Ma s ter F und, L td. da ted Ma rch 31, 2009. T he a mendment cha nged the prior requirement under the Note for ma nda tory ea rly repa yment to the following: T he compa ny will ma ke a ca s h pa yment of $250, 000 to the Holder on or before November 20, 2009 (in a ddition to the $25, 000 pa id by the compa ny on or a bout November 3, 2009) a nd a n a dditional ca s h Socialwise, Inc. Enters Amendment of the 12% Senior Note pa yment to the Holder of $100,000 on or before December 15, 2009. If the compa ny s ucces s fully ma kes both of the previous two pa yments , then the compa ny, in its s ole dis cretion, ma y extend the ma turity da te until F ebrua ry 28, 2010 in cons idera tion for 75, 000 s ha res of common s tock, provided tha t there is no brea ch or default or event of defa ult under this Note. DigitalFX International, Inc . DigitalF X Interna tiona l, Inc’s common s tock ha s been deleted from O T C B ulletin B oa rd effective November 11, 2009 on (OTC B B : DG FX) DigitalFX International Deleted From OTCBB a ccount of its filing form 15. T he compa ny ha s been a dded other NB B . C yberplex Inc . (TS X: C X) Cyberplex Inc. Announces Unaudited Consolidated Financial Results for the Third Quarter and C yberplex Inc. a nnounced una udited cons olida ted fina ncia l res ults for the third quarter a nd nine months ended S eptember 30, 2009. F or the qua rter, the compa ny reported revenue of $28.2 million was a n increa s e of 156% over the $11. 0 million genera ted during the s a me period a yea r a go. T his growth res ulted from the performa nce of the W eb A dvertis ing divis ion a nd by focus ing on k ey bus ines s vertica ls a nd through interna tiona l ma rket expa ns ion. C omprehens ive income was $919,996 or $0. 01 per ba s ic a nd diluted s ha re compa red to comprehens ive income of $633,167 or $0. 01 per ba s ic a nd diluted s ha re a year ago. Income before a mortiza tion of capita l a s s ets a nd inta ngible a s s ets wa s $1, 067,274 compa red to $752,513 a yea r a go. Income from opera tions wa s $954, 984 compa red to $645, 003 a yea r a go. Net income wa s $712, 371 compa red to $633, 167 a yea r a go. Nine Months Ended September 30, 2009 C yberplex Inc . (TS X: C X) Cyberplex Inc. Reports Unaudited Consolidated Financial Results for the Third Quarter and C yberplex Inc. reported una udited cons olidated fina ncia l res ults for the third qua rter a nd nine months ended S eptember 30, 2009. F or the qua rter, the compa ny reported income before taxes of $1. 0 million aga ins t $0.6 million for s a me period a yea r a go. E a rnings before a mortization, interes t, ta xes a nd foreign excha nge was $2. 7 million or 4 cents per s ha re. F or nine months , the compa ny reported income before ta xes of $6.2 million a ga ins t $0. 9 million for s a me period a yea r a go. Nine Months Ended September 30, 2009 NeuL ion Incorporated (TS X: NL N) NeuLion Incorporated Reports Unaudited Condensed Consolidated Earnings for the Third NeuL ion Incorporated reported unaudited condens ed cons olida ted ea rnings for the third qua rter a nd nine months ended S eptember 30, 2009. F or the qua rter, the compa ny reported opera ting los s of $5, 408, 414, net los s a nd comprehens ive los s of $7, 463, 951 or $0. 07 per bas ic a nd diluted s ha re on revenue of $6, 061, 302 a gains t opera ting los s of $1, 352, 218, net los s a nd comprehens ive los s of $1, 377, 667 or $0. 03 per bas ic a nd diluted s ha re on revenue of $2,699, 041 for the s a me period a year ago. C as h provided by opera ting a ctivities wa s $1,937, 748 a gains t $49, 431 for the s ame period a yea r a go. P roperty, pla nt and equipment expenditures were $362,108 a ga ins t $182, 918 for the s a me period a year ago. F or the nine months , the compa ny reported opera ting los s of $15,513, 615, net los s a nd comprehens ive los s of $18,185, 960 or $0.16 per ba s ic a nd diluted s ha re on revenue of $19,097,767 a ga ins t opera ting los s of $3,411, 255, net los s a nd comprehens ive los s of $4, 413, 792 or $0.10 per ba s ic and diluted s hare on revenue of $7,635,789 for the s ame period a yea r a go. C a s h provided us ed in opera ting a ctivities wa s $7,186, 903 a ga ins t $148,559 for the s a me period a yea r a go. P roperty, p Quarter and Nine Months Ended September 30, 2009 Tencent Holdings L td. (S E HK : 700) T encent Holdings L td., B oa rd Meeting, Nov 11, 2009 Agenda : T o a pprove the una udited third qua rter res ults a nd Tencent Holdings Ltd., Board Meeting, Nov 11, 2009 a nnouncement of the compa ny a nd its s ubs idiaries for the three a nd nine months ending 30 S eptember 2009 a nd cons idering the pa yment of a dividend, if a ny. is eemedia Inc . (TS XV: IE E ) is eemedia Inc. a nnounced tha t it ha s begun deployment of a n S MS -ba s ed pus h-ma il s ervice with T ata Indicom a nd T a ta Docomo, the C DMA and G S M offering res pectively of T a ta T eles ervices L td. T he commercia l la unch is expected to be iseemedia Inc. Provides SMS-Based Push-Mail Service to Tata Indicom and Tata Docomo completed by November 2009. T he cons umer ema il will join enterpris e ema il as a s ta nda rd s ervice on mobile devices in the coming years . T T S L is pos itioning this s ervice to ca pture a s izea ble s ha re of the ra pidly growing us er s egment us ing On-T he- G o ema il s ervices , us ing the is eemedia s olution. Tencent Holdings L td. (S E HK : 700) Tencent Holdings Ltd. Reports Unaudited Consolidated Earnings Results for the Third Quarter T encent Holdings L td. reported una udited cons olida ted earnings res ults for the third qua rter ended S eptember 30, 2009. F or the qua rter, the company reported tota l revenues were R MB 3, 368.9 million (US D 493. 3 million), a n increa s e of 17. 0% over the s econd qua rter of 2009 or a n increas e of 66. 4% to R MB 2, 024. 5 million for the third qua rter of 2008. O perating profit wa s R MB 1, 680. 3 million (US D 246. 1 million), an increas e of 20. 1% qua rter on qua rter or an increas e of 107. 3% yea r on yea r compa red to R MB 810.5 million for the s a me qua rter a yea r a go. P rofit a ttributable to equity holders of the compa ny wa s R MB 1, 419. 9 million (US D 207. 9 million), an increas e of 19. 1% qua rter on qua rter or an increas e of 92. 6% year on yea r or R MB 0. 767 per diluted s ha re compa red to profit a ttributa ble to equity holders of the compa ny of R MB 737. 1 million or R MB 0. 400 per diluted s ha re for the s a me qua rter a yea r a go. P rofit before income ta x wa s R MB 1,683 million compa red to R MB 802.4 million for the s a me qua rter a yea r a go. C a pita l expenditure was R MB 269. 1 million for the third qua rter of 2009 a s compa red with R MB 191.3 million for the previous qua rter. Ended September 30, 2009 Openwave S ys tems Inc . Openwa ve S ys tems Inc. a nnounced the Openwa ve(R ) Mobile Internet R ea dyS et, a low-cos t, prepa cka ged pla tform tha t (Nas daqG S : OP WV) provides opera tors with a centra l point from which to offer new, revenue genera ting, mobile internet s ervices . Openwa ve will demons tra te its R ea dyS et s olution, a s well a s its la tes t mobile internet, mes s aging a nd loca tion s oftwa re a pplica tions a nd infras tructure a t A frica C om C ongres s & E xhibition loca ted in C a pe T own, S outh Africa on November 11-12, 2009. Openwa ve's R ea dyS et provides a complete mobile internet s olution cons is ting of tra ffic ma nagement tools including content Openwave Introduces Mobile Internet Readyset Solution for Operators in Emerging Markets a da pta tion and a cceleration, ba ndwidth optimis ation, and s ervice promotion and billing, in a s ingle pa cka ge. W ith very low- cos t hardwa re a nd s ta ndard pre-configured deployment options , R ea dyS et is idea l for s ma ller operators a nd newer ma rkets which require a quick return on inves tment for minima l ca pita l outla y. Additiona lly, R ea dyS et is s ca la ble a nd will expand to meet s ubs criber growth a nd dema nds both in terms of increa s ed numbers a nd increa s ed us er expecta tion. Tencent Holdings L td. (S E HK : 700) Tencent Holdings Ltd., Q3 2009 Earnings Call, Nov-11-2009 T encent Holdings L td., Q3 2009 E a rnings C a ll, Nov-11-2009 S hutterfly, Inc . (Nas daqG S : S FL Y) Shutterfly, Inc. - Conference Presentation Call S hutterfly, Inc. - C onference P res enta tion C a lls Tencent Holdings L td. (S E HK : 700) Tencent Holdings Ltd. Reports Unaudited Consolidated Earnings Results for the Nine Months T encent Holdings L td. reported una udited cons olida ted earnings res ults for the nine months ended S eptember 30, 2009. F or the nine months , the compa ny reported profit of R MB 3, 688. 56 million a nd profit attributa ble to equity holders of the compa ny was R MB 3, 647. 70 million or R MB 1.980 per s ha re on revenues of R MB 8,751. 69 million compa red to profit of R MB 1, 939. 50 million a nd profit attributa ble to equity holders of the compa ny wa s R MB 1, 915.480 million or R MB 1.040 per s ha re on revenues of R MB 5,057,163 million for the s a me period a yea r a go. P rofit before income ta x wa s R MB 4,254. 91 million compa red to R MB 2, 168. 06 million for the s a me period a yea r a go. Opera ting profit wa s R MB 4, 243.83 million compa red to R MB 2, 313. 12 million for the s a me period a yea r a go. Net ca s h flows genera ted from opera ting a ctivities wa s R MB 5, 741. 80 million compared to R MB 2, 087.18 million for the s a me period a yea r a go. Ended September 30, 2009 C yberplex Inc . (TS X: C X) Cyberplex Inc., Q3 2009 Earnings Call, Nov-12-2009 C yberplex Inc. , Q3 2009 E a rnings C a ll, Nov-12-2009 G olden E agle B roadc as ting; S handa S ha nda Intera ctive E nterta inment L td. a nd G olden E agle B roa dcas ting (G B S ) a nnounced s trategic coopera tion in S hangha i Interac tive E ntertainment L td. on November 12, 2009. Under the a greement, S ha nda a nd G B S will s et up a joint venture with a n inves tment of C N Y 600 (Nas daqG S : S NDA) Shanda Interactive Entertainment Ltd. and Golden Eagle Broadcasting to Set Up Joint Venture million. T he venture will be enga ged in film a nd T V pla yer ma king, dis tribution, a nd other rela ted s ervices . T he coopera tion with G B S ena bles S ha nda to ma ke inroa ds into the film s ector, a pa rt from bus ines s es like online ga mes , litera ture, a s well a s mus ic. DigitalP os t Interactive, Inc . DigitalP os t Intera ctive Inc. announced the s igning of a contra ct with T he P icture P eople Inc. T his pa rtners hip will expa nd (OTC B B : DG L P ); The P icture P eople, DigitalP os t's dis tribution cha nnel a long with providing potential revenue growth. P icture P eople plans to enha nce its online Inc . pres ence by a dapting a nd re-bra nding Digita lP os t's fa mily webs ite pla tform for their cus tomer ba s e. T his new platform DigitalPost Interactive Signs Agreement with the Picture People, Inc provides a s tunning vis ual dis pla y a nd eas y-to-us e a dminis tra tion fea tures tha t will ena ble T he P icture P eople to enter new ma rkets with Digita lP os t's a ward winning photo/video-s haring technology. Figure 7b. Key Developments – continued Source. Capital IQ