SlideShare uma empresa Scribd logo
1 de 16
Baixar para ler offline
370


Evolutionary Adaptation to Freeze-Thaw-Growth Cycles in
Escherichia coli


Sean C. Sleight*                                                             is whether a population can survive the stress and persist on
Richard E. Lenski                                                            an evolutionary timescale or whether it will become extinct,
Department of Microbiology and Molecular Genetics,                           and many factors influence the outcome: the frequency of stress
Michigan State University, East Lansing, Michigan 48824                      conditions, the conditions for growth between bouts of stress,
                                                                             and so on. Assuming that a population survives, then there
Accepted 2/13/2007; Electronically Published 5/7/2007                        exists the potential for evolutionary changes that improve sur-
                                                                             vival and recovery under the same or similar stresses in the
                                                                             future.
                                                                                The direct study of evolutionary changes can be accom-
ABSTRACT
                                                                             plished by observing populations of bacteria or other organisms
Fifteen populations of Escherichia coli were propagated for 150              with suitably short generations while they are propagated in
freeze-thaw-growth (FTG) cycles in order to study the phe-                   controlled and reproducible laboratory environments (Rose
notypic and genetic changes that evolve under these stressful                1984; Lenski et al. 1991; Bennett et al. 1992; Bennett and Lenski
conditions. Here we present the phenotypic differences between               1999; Wichman et al. 1999, 2000; Elena and Lenski 2003; Lenski
the evolved lines and their progenitors as measured by com-                  2004; Riehle et al. 2005; Chippindale 2006; Herring et al. 2006;
petition experiments and growth curves. Three FTG lines                      Leu and Murray 2006; Schoustra et al. 2006; Zeyl 2006). Ad-
evolved from an ancestral strain that was previously used to                 vantages of using bacteria in experimental evolution include
start a long-term evolution experiment, while the other 12 FTG               their rapid generations and large populations as well the ca-
lines are derived from clones that had previously evolved for                pabilities of establishing replicate populations from the same
20,000 generations at constant 37 C. Competition experiments                 ancestral clone and reviving ancestral and derived cells stored
indicate that the former FTG group improved their mean fitness                at different times in an experiment. Also, bacteria reproduce
under the FTG regime by about 90% relative to their progenitor,              asexually, and thus, stable genetic markers can be used to dis-
while the latter FTG group gained on average about 60% rel-                  tinguish ancestral from derived genotypes during competition
ative to their own progenitors. These increases in fitness result             experiments to measure their relative fitness. Moreover, a
from both improved survival during freezing and thawing and                  wealth of genetic, biochemical, and physiological information
more rapid recovery to initiate exponential growth after thaw-               exists for model species, including Escherichia coli, that can
ing. This shorter lag phase is specific to recovery after freezing            enrich and inform analyses built around evolution experiments.
and thawing. Future work will seek to identify the mutations                    In a long-term evolution experiment, Lenski and colleagues
responsible for evolutionary adaptation to the FTG environ-                  studied the dynamics of phenotypic and genomic evolution in
ment and use them to explore the physiological mechanisms                    12 initially identical populations of E. coli while they were prop-
that allow increased survival and more rapid recovery.                       agated in a glucose-supplemented minimal medium at 37 C
                                                                             for more than 20,000 generations (Lenski et al. 1991; Lenski
                                                                             and Travisano 1994; Cooper and Lenski 2000; Rozen and Lenski
                                                                             2000; Schneider et al. 2000; Cooper et al. 2003; Lenski et al.
Introduction                                                                 2003; Pelosi et al. 2006; Woods et al. 2006). Bennett and col-
                                                                             leagues performed related experiments in which bacteria de-
Most physiological and genetic studies of adaptation to stressful            rived from this long-term study were used to establish several
environments focus on the proximate mechanisms that pro-                     sets of new populations that continued to evolve in the same
mote survival and growth. By contrast, research on the evo-                  medium but under different thermal regimes, including con-
lutionary adaptation of organisms to stressful environments                  stant lower and higher temperatures as well as in temporally
examines how new stress responses evolve or existing stress                  fluctuating environments (Bennett et al. 1992; Lenski and Ben-
responses are reshaped by selection. One immediate question                  nett 1993; Leroi et al. 1994; Travisano et al. 1995; Mongold et
                                                                             al. 1996, 1999; Bennett and Lenski 1999; Cullum et al. 2001;
* Corresponding author; e-mail: sleight3@msu.edu.
                                                                             Riehle et al. 2001, 2003, 2005). The latter studies have shown
Physiological and Biochemical Zoology 80(4):370–385. 2007. 2007 by The       adaptation that is often temperature specific, with frequent but
University of Chicago. All rights reserved. 1522-2152/2007/8004-6111$15.00   not universal trade-offs in performance at other temperatures.
Evolutionary Adaptation in Escherichia coli        371


There is evidence from these studies, as well as others, to suggest   ice formation and dehydration resulting from hyperosmotic
that rates of evolutionary adaptation to stressful environments       shock (Mazur 1984; Gao and Critser 2000). Also, freezing and
may often exceed corresponding rates in nonstressful environ-         thawing cause oxidative damage (Cox and Heckly 1973) and
ments (Parsons 1987; Hoffman and Parsons 1993; Lenski and             can thus be mutagenic (Grecz et al. 1980; Calcott and Gargett
Bennett 1993; Bennett and Lenski 1997; Rutherford and Lind-           1981). In the face of all these potentially damaging effects, many
quist 1998; Queitsch et al. 2002).                                    bacteria nonetheless can protect themselves or otherwise re-
   In this study, we examine the evolutionary adaptation of E.        cover under the right circumstances (Calcott 1985). Several
coli populations to a regime of alternating days of freezing          variables have been shown to affect whether bacteria can survive
without added cryoprotectant at 80 C and thawing at room              freezing and thawing, including nutritional status, growth
temperature, followed by growth at the benign temperature of          phase, and cooling rate (Calcott 1985; Gao and Critser 2000).
37 C. In preliminary work, we found that repeated freeze-thaw         For example, bacteria harvested in stationary phase survive
(FT) cycles cause mortality such that without intervening op-         freezing and thawing much better than those harvested during
portunities for growth, populations become extinct. Therefore,        exponential growth (Souzu et al. 1989). Furthermore, preex-
the opportunity for growth every other day allows populations         posure to cold, osmotic, and other stresses can increase sub-
to recover and multiply, including the generation of new mu-          sequent FT survival, presumably owing to changes in levels of
tations that might allow improved survival during or faster           particular proteins or other cell components that provide cross
recovery following FT cycles. Our aims here are to report the         tolerance (Thammavongs et al. 1996; Drouin et al. 2000; Panoff
basic experimental design, provide evidence for adaptation to         et al. 2000).
this regime, and determine whether adaptation occurs by im-              Various approaches could be pursued to investigate the mo-
proved survival, faster recovery, or both. Also, our study shows      lecular genetic basis of FT tolerance. The traditional genetic
how evolutionary history can influence evolutionary changes            approach screens sets of insertion mutants to identify those
because the populations were founded by strains that had dif-         that are deficient in FT survival but not in their ability to grow
ferent histories before this experiment. We will conclude by          under permissive conditions, presumably owing to knockouts
outlining our future plans to identify the genetic and physio-        of genes whose products are specifically required for FT survival
logical bases of the adaptations reported here.                       or recovery. Analyses of changes in mRNA and protein levels
   Before turning to this evolution experiment, we now provide        might allow the identification of other genes whose expression
a brief overview of bacteria in nature that experience freezing       levels are altered during freezing, thawing, or subsequent re-
and thawing conditions, their physiological responses to freez-       covery. An evolutionary approach, such as the one we have
ing and thawing, and a preliminary experiment that we per-            pursued, differs because it allows the study of improvements
formed to identify the conditions for our evolution experiment.       in the stress response and not just the basis of the tolerance as
Many different bacterial species live in environments that are        it presently exists in a particular strain or species. Indeed, there
subject to freezing and thawing, including Siberian permafrost        may be many different types of evolutionary adaptations that
(Rivkina et al. 2000), arctic tundra (Eriksson et al. 2001), and      could improve FT survival and recovery, some of which might
Antarctic ponds (Mountfort et al. 2003). Some of these bacteria       involve genes other than those already known to be important
live as parts of mat communities that include diatoms and green       for this stress response. By studying the evolution of multiple
algae as well as cyanobacteria. Metabolic activity and growth         experimental lines, including ones started with different an-
have been reported for some permafrost bacteria at tempera-           cestral strains, one can observe the uniformity or diversity of
tures as low as 10 C (Bakermans et al. 2003). Comparative             responses to any given stress. Also, the use of a mesophilic
evidence suggests that evolutionary adaptation to these FT en-        organism such as E. coli, instead of a psychrophilic species that
vironments has involved changes in cold shock or cold active          is already cold adapted, may increase the opportunity to see
proteins (Cloutier et al. 1992; Hebraud and Potier 1999; Sid-         new evolutionary adaptations to FT conditions on an experi-
diqui and Cavicchioli 2006), membrane fluidity (Russell 1990;          mental timescale. In a study by another group, Lactobacillus
Hebraud and Potier 1999; Ponder et al. 2005), and enzymes             delbrueckii were found to evolve greater FT tolerance after serial
that inhibit or promote ice nucleation (Muryoi et al. 2004;           propagation in milk with intermittent freezing and thawing
Walker et al. 2006). In general, however, little is known about       (Monnet et al. 2003).
the timescale over which such changes have occurred, the num-            We performed a pilot experiment to isolate cryotolerant mu-
ber of mutations needed to allow survival starting from a FT-         tants of E. coli that could better survive repeated freezing and
sensitive progenitor, whether survival during freezing or re-         thawing. The ancestor of the long-term experimental popula-
covery on thawing is the more important target of selection,          tions was subjected to daily FT cycles without added nutrients,
and other such issues that can be explored by experimental            but no viable cells remained after 40 d. Therefore, for this study
evolution.                                                            we introduced a growth phase after the FT cycle to allow pop-
   Freezing and thawing are multifaceted stresses that involve        ulations to recover and, potentially, to evolve. Elsewhere, we
not only low temperature but also potentially lethal intracellular    have also reported that 12 populations of E. coli that evolved
372 S. C. Sleight and R. E. Lenski


in a minimal salts medium with glucose at 37 C for 20,000           FTG Evolution Experiment
generations all became more sensitive to repeated FT cycles
                                                                    Figure 1 gives an overview of our FTG evolution experiment.
than their ancestor, although the extent of this change varied
                                                                    The 15 FTG populations include three replicates, designated
among the derived lines (Sleight et al. 2006). These findings
                                                                    group A, founded by the Ara variant of the original ancestor,
demonstrate genetic variation in FT tolerance, and they also
                                                                    and 12 populations founded by clones sampled from each of
indicate that some of the mutations responsible for improved
                                                                    the long-term populations at generation 20,000, designated
fitness in that warm environment are detrimental under FT
                                                                    group B. These 15 populations evolved for 150 2-d FTG cycles,
conditions. Also, because these lineages are preadapted to the
                                                                    which equals some 1,000 generations based on the 100-fold
growth conditions at 37 C, they are interesting progenitors to
                                                                    dilution and regrowth in alternating days; in fact, somewhat
start an evolution experiment under the freeze-thaw-growth
                                                                    more generations occurred because additional cell growth also
(FTG) regime. We can compare the adaptation to the FTG
                                                                    offset death during the FT cycle in alternating days. To start
regime of the 37 C-evolved lines and their progenitors with
                                                                    the evolution experiment, 1 mL of stationary phase DM25 cul-
our a priori expectations that the 37 C-evolved lines have more
                                                                    ture was transferred into a freezer tube and put in a 80 C
scope for improvement with respect to FT cycles but less op-
                                                                    freezer for 22.5 h. The tubes were then thawed at room tem-
portunity to improve further during the growth phase.
                                                                    perature (∼22 C) for 1.5 h, after which time the contents were
                                                                    diluted 1 : 100 into fresh DM25 and incubated at 37 C without
                                                                    shaking for 24 h. The use of unshaken tubes, rather than shaken
Material and Methods
                                                                    flasks, during the growth phase represents a small departure
                                                                    from the methods used in the long-term evolution experiment.
Culture Media and Experimental Preconditioning                      This change allowed us to handle more cultures simultaneously.
                                                                    Any effect on oxygen levels is small, owing to the low sugar
The bacterial clones used in our experiments, including those
                                                                    concentration used in our experiments and the resulting low
evolved in our experiment as well as their progenitors, are kept
                                                                    population density (about 3–5 # 107 cells/mL in stationary
in long-term storage at 80 C with glycerol added as a cryo-
                                                                    phase, roughly two orders of magnitude below the density in
protectant. However, in the FTG evolution experiment and in
                                                                    most research with E. coli). In a previous study, there was no
our assays of FT survival and relative fitness under the FTG
                                                                    discernible difference in relative fitness between shaken flasks
regime, we used medium without added glycerol in order to
                                                                    and unshaken tubes under conditions similar to those used in
investigate the evolution of changes in survival and recovery.
                                                                    our study (Travisano 1997).
To ensure that cells were in comparable physiological states at
                                                                       Thus, the populations in our evolution experiment experi-
the start of assays of FT survival and competitive fitness, cells
                                                                    enced cycles of a day of freezing and thawing that alternated
were removed from the freezer, inoculated into Luria-Bertani
medium independently for each replicate assay, and incubated
at 37 C for 24 h; they were then diluted 10,000-fold into Davis
minimal medium supplemented with glucose at 25 mg/L
(DM25) and incubated at 37 C again for 24 h, at which point
these cells were used to start all assays.


Long-Term Evolution Experiment and Bacterial Strains

The long-term evolution experiment at constant 37 C is de-
scribed in detail elsewhere (Lenski et al. 1991; Lenski 2004). In
brief, 12 replicate populations evolved for 20,000 generations
(3,000 d) starting from two variants of the same ancestral strain
of E. coli B. One variant (REL606) cannot grow on arabinose,        Figure 1. Evolutionary histories of freeze-thaw-growth (FTG) popu-
while the other (REL607) is a spontaneous Ara mutant; six           lations. Three lines in FTG-evolved group A were founded by the
populations were founded from each type. The Ara marker is          ancestor of another evolution experiment. Twelve lines in FTG-evolved
neutral in the long-term experimental environment (Lenski et        group B were founded by clones sampled from populations that pre-
al. 1991), which consists of daily 1 : 100 transfers into flasks     viously evolved for 20,000 generations at 37 C. All 15 of the FTG lines
                                                                    evolved for 1,000 generations under the FTG regime, with alternating
that contain DM25 and incubation with shaking at 37 C. The          days of a FT cycle and growth at 37 C. The culture medium used for
dilution and subsequent regrowth allow about 6.6 (plog2100)         growth days was the same one used during the evolution of the pro-
generations/d.                                                      genitors of FTG group B.
Evolutionary Adaptation in Escherichia coli       373


with a day in which they grew in the same medium and at the           Quantifying FTG Fitness and Its Components
same temperature as in the long-term evolution experiment.
                                                                      For each replicate competition assay, we first calculated each
Populations and clones were sampled and stored every 100
                                                                      competitor’s realized (net) growth rate r over the 2-d FTG cycle
generations (30 d) in freezer vials with glycerol for future study.
                                                                      as follows:
During the long-term evolution experiment at 37 C, unique
mutations were substituted at certain loci in each population
(Woods et al. 2006); we confirmed by sequencing the presence
of at least one such mutation in each group B line, which
                                                                                             r p ln   (
                                                                                                      N2 # 100
                                                                                                         N0
                                                                                                               ,  )
demonstrates they were all derived from their intended pro-
genitors (S. C. Sleight and R. E. Lenski, unpublished data).          where N2 is that competitor’s final cell density, N0 is its initial
                                                                      cell density, and the factor of 100 takes into account the 100-
                                                                      fold dilution between the 2 d of the FTG cycle. The overall
                                                                      FTG fitness of one competitor relative to another is simply the
                                                                      ratio of their respective realized growth rates over the complete
FTG Competition Experiments                                           cycle.
                                                                         We also calculated each competitor’s FT survival s and sub-
We performed competitions to measure the extent of evolu-             sequent growth rate g over the two separate days of the FTG
tionary adaptation of the FTG-evolved lines relative to their         cycle as follows:
progenitors. Competitions were performed in the exact same
environment as used in the FTG evolution experiment. For                                          N1
                                                                                             sp      ,
group A, the FTG-evolved lines competed directly against the                                      N0
ancestor with the opposite Ara marker state. For group B, the
FTG-evolved lines and their 37 C-evolved progenitors each
competed separately against the original ancestor bearing the
                                                                                             g p ln   (   N2 # 100
                                                                                                             N1   ),
opposite marker state.
   The densities of two competitors were estimated by serially        where N1 is the viable cell density measured after the first day
diluting cultures on tetrazolium-arabinose (TA) indicator             of the cycle before the 100-fold dilution. Note that survival is
plates, except for one FTG-evolved line and its progenitor that       a proportion, whereas growth is a rate. In any case, the relative
form poor colonies on TA medium and whose densities were              survival and growth of two competitors are expressed as the
estimated from minimal glucose plates. Plates were incubated          ratio of the relevant parameters, so that they are dimensionless
for 24 h at 37 C, and the resulting number of colony-forming          quantities, as is the overall FTG fitness.
units was used to estimate the corresponding density. The Ara            All these quantities—relative fitness, relative survival, and
and Ara cells form white and red colonies, respectively, when         relative growth rate—were first calculated separately for each
grown on TA plates. As a control for any effect of the Ara            replicate assay. We then averaged the values from the replicate
marker, the Ara and Ara ancestral variants also competed in           assays to obtain the estimate for each line within a group.
each batch of competition experiments; the Ara marker is neu-         Finally, for each group, the overall means were calculated by
tral in the FTG regime, as was shown under the growth con-            averaging the estimates obtained for each line in the group,
ditions of the long-term experiment.                                  except in the case of the single ancestor of group A, where the
   Before starting a competition, each competitor was separately      mean was based on the replicate assays. Details of the statistical
conditioned as described previously. Equal volumes of each            analyses are given in “Statistical Methods.”
competitor were then mixed, and 1 mL was transferred into a
tube and placed in a 80 C freezer. After 22.5 h, the tube was
                                                                      Growth Curves
thawed at room temperature for 1.5 h. Then 0.1 mL was diluted
into 9.9 mL of DM25 and incubated at 37 C for 24 h. Mea-              We obtained separate growth curves, based on optical density
surements of the densities of the competitors were taken at the       (OD), for the evolved clones and their progenitors in order to
start (before freezing), after thawing, and again after the growth    estimate the durations of their lag phase before commencing
phase that completes the full FTG cycle. From these data, we          growth as well as their doubling times during the growth phase.
estimated the relative fitness of the two competitors over the         These growth parameters were first calculated for each line by
course of the complete FTG cycle by using the initial and final        averaging nine replicate growth trajectories for that line. Group
samples, as described next. In addition, we partitioned the over-     means were then calculated by averaging the estimates for each
all FTG fitness into two components that reflect FT survival            line in the group, except for the single ancestor of group A
and subsequent growth by using the middle sample, also as             whose parameters were estimated directly from the nine rep-
described next.                                                       licates. OD measurements were made at the 420-nm wavelength
374 S. C. Sleight and R. E. Lenski


on 0.2-mL cultures in 96-well microtiter plates incubated at
37 C. The data were collected following either an FT cycle or
stationary phase at 37 C, with a comparison between the two
curves permitting an estimate of the effect of the FT cycle on
the time required to achieve exponential growth following di-
lution into fresh DM25 medium, as described next.


Calculations of Lag Phase Duration and Doubling Time
Calculations of the duration of lag phase used the general
method given by Lenski et al. (1994) with modifications as
described here. OD values from growth curve experiments were
standardized by dividing by the initial OD (measured imme-
diately after the FT cycle before dilution and divided by 100
to take the dilution factor into account) and log2 transformed
                                                                     Figure 2. Schematic illustration showing how the apparent duration
in order to express changes as doublings. The transformed data       of lag phase is corrected for freeze-thaw (FT) survival to calculate the
were then plotted and inspected to identify the window of            actual duration of the physiological lag before growth. The apparent
exponential growth, and linear regression was performed on           duration is calculated by extrapolating the regression line based on
those exponential-phase data. The doubling time was calculated       exponential growth back to the initial optical density. In this hypo-
as the inverse of the slope of the regression. The “apparent”        thetical example, 50% of the cells survived the FT treatment; therefore,
                                                                     the initial density of viable cells is half that implied by the initial optical
lag phase was then estimated by extrapolating the exponential        density (log2 0.5 p 1). The actual duration of the physiological lag
growth back in time until the regression intersected the initial     is then obtained by extending the extrapolated growth trajectory until
OD measurement (Fig. 2). Note, however, that this apparent           it intersects the initial density of viable cells.
lag phase does not take into account any contribution of dead
cells to OD, so it overestimates the actual duration of the lag      conservative. We used one-tailed tests for those hypotheses with
phase. We corrected for this mortality by independently mea-         clear a priori expectations about the direction of the outcome;
suring the FT survival of the clone and then transforming the        otherwise, two-tailed tests were used conservatively, including
proportion surviving to a log2 scale; that proportion is generally   those cases with potentially opposing effects. For example, we
below 1, and hence the value is negative on a log scale, with        expect overall fitness and its components to increase for all
more negative values corresponding to higher mortality. As           FTG-evolved lines when measured in the FTG environment.
shown schematically in Figure 2, the log2-transformed survival       We also expect the lines in group B, which previously evolved
value was plotted as a horizontal line on the graphs showing         in the same medium at 37 C and suffered correlated losses in
the exponential-phase growth data, where the intersection of         FT survival, to show less improvement in growth rate but
this line with the extrapolated regression then provides an es-      greater gains in FT survival than the lines in group A.
timate of the actual duration of the physiological lag (i.e., the
duration corrected for FT mortality).                                Results
                                                                     Evolutionary Adaptation to the FTG Regime
Statistical Methods
                                                                     Figure 3 shows that the lines evolved under the FTG regime
We performed t-tests to compare performance measures be-             improved in their overall fitness when measured under that
tween the FTG-evolved lines and their progenitors. Paired tests      same regime. The three lines in group A increased their fitness,
were always used when comparing B group–evolved lines with           on average, by 89% relative to the ancestral strain. The 12 lines
their progenitors, owing to their unique relationships. Paired       in group B improved relative to their 37 C-evolved progenitors
tests were also used to compare the A group–evolved lines with       by 60%, on average. Notice that the progenitors of group B
the common ancestor when the relevant assays for each evolved        were themselves much more fit than the common ancestor
line were paired with particular assays for the ancestor. Oth-       under the FTG regime; this result indicates that their improve-
erwise, we used a t-test for comparing a single specimen, the        ments in growth during 20,000 generations at 37 C more than
ancestor, with a sample, the three evolved group A lines (Sokal      offset their losses in FT survival. The fitness gains in groups A
and Rohlf 1981, pp. 229–231). This test assumes equal standard       and B relative to their own progenitors were both significant
deviations for the distributions from which the single specimen      (one-tailed paired t-tests: group A, df p 2, P p 0.0034; group
and the sample are drawn; in fact, the ancestor, being a ho-         B, df p 11, P ! 0.0001). Also, the proportional gains in group
mogenous type, should have a lower standard deviation than           A, relative to their ancestor, were significantly greater than those
the independently derived lines, which makes our inferences          observed in group B, relative to their progenitors, during the
Evolutionary Adaptation in Escherichia coli           375


                                                                            values measured previously on the same generational samples
                                                                            (Cooper and Lenski 2000) in that benign environment (r p
                                                                              0.1673, df p 10, two-tailed P p 0.6033). Although the me-
                                                                            dium per se is the same, the ancestral and FTG environments
                                                                            are so dissimilar overall that performance in one does not pre-
                                                                            dict performance in the other. However, we recently showed
                                                                            that while all the B progenitors have greater sensitivity to FT
                                                                            mortality than the common ancestor, the extent of their in-
                                                                            creased sensitivity was significantly correlated with their fitness
                                                                            gains in the benign environment (Sleight et al. 2006). Thus,
                                                                            prior adaptation by the B progenitors reduced the scope for
                                                                            adaptation to the growth period of the FTG regime while in-
                                                                            creasing potential adaptation to the FT treatment.
                                                                               The overall adaptation to the FTG regime can be partitioned
                                                                            into improvements in FT survival and subsequent growth per-
Figure 3. Relative fitness of freeze-thaw-growth (FTG)-evolved groups
                                                                            formance. Figure 5A shows the changes in FT survival. Both
A and B and their progenitors over the 2-d FTG cycle. For group A,
each of the three evolved lines competed against the ancestor with the      group A and group B lines survived freezing and thawing better
opposite Ara marker state. For group B, each of the 12 evolved lines        than their progenitors (one-tailed paired t-tests: group A,
and their progenitors competed separately against the original ancestor     df p 2, P p 0.0014; group B, df p 11, P p 0.0023). The im-
with the opposite marker state. The mean value for each evolved group       provement in survival was significantly greater in group B than
(gray) is adjacent to the corresponding mean for its progenitors (white).
                                                                            in group A (one-tailed t-test with unequal variances, df p 13,
Means for each group were calculated from the average values for each
member in the group, except for the single ancestor of group A, where       P p 0.0432), as expected given the higher initial mortality in
the mean is based on six independent measurements. Error bars are           B progenitors. The resulting final survival values did not differ
95% confidence intervals based on the number of independently                significantly between groups A and B (two-tailed t-test with
evolved lines, except for the ancestor, for which the interval is based     unequal variances, df p 13 , P p 0.3691). Figure 5B shows the
on the six replicate assays.
                                                                            corresponding changes in growth performance after an FT cycle
                                                                            and dilution into fresh medium. Both groups underwent sig-
FTG evolution (two-tailed t-test with unequal variances,
df p 13, P p 0.0417), although B had a final mean fitness that
was significantly higher than that of A (two-tailed t-test with
unequal variances, df p 13, P p 0.0003).
   Figure 4 illustrates the extent of variation among the 15
evolved lines and their progenitors in overall fitness under the
FTG regime. The three group A lines improved to a similar
extent, and their fitness gains were all highly significant (P !
0.0001, based on one-tailed t-tests comparing six replicate assays
for an evolved line and two assays for the ancestor that were
paired with each evolved line). The group B lines showed much
more variability, reflecting differences in their progenitors’ fit-
ness as well as their subsequent gains. Eleven of the B lines
improved significantly (all P ! 0.05 , based on one-tailed t-tests
comparing six replicate assays for each evolved line with six
replicate assays for its own progenitor), while the gain in line
A 5 was not significant. The A 5 progenitor had the highest
FT survival of all group B progenitors; therefore, it had less              Figure 4. Relative fitness of the 15 freeze-thaw-growth (FTG)-evolved
                                                                            lines and their progenitors. Fitness values were measured in compe-
scope to improve in this respect.                                           tition with the common ancestor over the 2-d FTG cycle. Each evolved
   The fitness values for the B progenitors, which previously                line (gray) is paired with its progenitor (white). The three group A
evolved at constant 37 C for 20,000 generations, vary by about              lines are shown with different ancestral replicates (designated A, B,
twofold under the FTG regime (Fig. 4), whereas they vary much               and C). The 12 group B lines were derived from long-term lines,
less, although significantly, in the benign environment where                designated A 1 to A 6, that previously evolved for 20,000 gener-
                                                                            ations at 37 C. Error bars show 95% confidence intervals based on six
they evolved (Lenski et al. 1991; Lenski and Travisano 1994;                replicate fitness assays for each line or progenitor, except for the group
Cooper and Lenski 2000). There is no significant correlation                 A ancestor, where two of the replicate assays were paired with each of
between the FTG fitness values measured here and the fitness                  the three evolved lines in that group.
376 S. C. Sleight and R. E. Lenski


                                                                          20,000 generations, may be surprising at first glance. However,
                                                                          when we performed 1-d competitions in the same medium
                                                                          without an FT cycle, the evolved group B lines did not show
                                                                          any improvement in growth performance (S. C. Sleight and R.
                                                                          E. Lenski, unpublished data). As we will show next, their im-
                                                                          provement does not come from faster rates of exponential
                                                                          growth, but instead they evolved faster recovery of their growth
                                                                          capacity following the FT treatment.


                                                                          Changes in Growth Dynamics Including the Duration
                                                                          of Lag Phase
                                                                          Figure 6 shows the growth dynamics, based on OD, for both
                                                                          FTG-evolved groups and their progenitors under two slightly
                                                                          different conditions. In Figure 6A, the growth data correspond
                                                                          precisely to day 2 of the FTG regime, with cells having been
                                                                          frozen and thawed before their dilution into fresh medium
                                                                          at 37 C. In Figure 6B, the populations were started from
                                                                          stationary-phase cultures grown at 37 C without the interven-
                                                                          ing FT cycle.
                                                                             Several interesting features are apparent from the growth
                                                                          dynamics following the FT cycle (Fig. 6A). First, notice that
                                                                          both evolved groups (gray curves) increase much sooner than
                                                                          their respective progenitors (black curves). Second, the group
                                                                          B–evolved lines (solid gray curve) perform better, on average,
                                                                          than the group A lines (dashed gray curve), although the dif-
                                                                          ference is much less than between their progenitors (solid black,
                                                                          dashed black curves, respectively). Third, the improvement in
                                                                          group A (dashed gray curve) relative to their ancestor (dashed
Figure 5. Decomposition of overall fitness gains under the freeze-thaw-
                                                                          black curve) appears to involve both earlier and faster growth.
growth (FTG) regime into changes in freeze-thaw (FT) survival (A)
and growth performance (B). All values were measured with, and are           Now compare these dynamics with those observed without
shown relative to, a marked variant of the common ancestor. FT sur-       the intervening FT treatment (Fig. 6B). First, notice that all
vival reflects changes in viable cell density during the first day of FTG   four growth trajectories now rise earlier than before. These
competitions. Growth performance reflects the net rate of increase on      differences imply that some portion of the lags after the FT
the second day after dilution into fresh medium. The mean for each
                                                                          treatment reflect demographic recovery, physiological recovery,
evolved group (gray) is adjacent to the corresponding mean for its
progenitors (white). Means for each group were calculated from average    or both from that stress. Second, the trajectories for the group
values for each member in the group, except for the single ancestor       B lines and their progenitors (solid gray, solid black curves,
of group A where the mean is based on six independent measurements.       respectively) are almost perfectly superimposed. This similarity,
Error bars are 95% confidence intervals based on the number of in-         in contrast to the difference seen after the FT treatment, implies
dependently evolved lines, except for the ancestor, for which the in-
                                                                          that the group B lines have adapted by accelerating their re-
terval is based on the six replicate assays.
                                                                          covery from the stress. Third, the trajectories for group A and
                                                                          the ancestor (dashed gray, dashed black curves, respectively) are
nificant improvement (one-tailed paired t-tests: group A,                  much closer than they were following the FT treatment. The
df p 2, P p 0.0042; group B, df p 11, P ! 0.0001). The pro-               remaining difference between them appears to reflect faster
portional gain in growth performance was greater for group A              growth by the evolved A lines rather than a shorter lag phase.
than for group B (one-tailed t-test with unequal variances,               After quantifying these differences, we will turn in the next
df p 13, P p 0.0056), as expected given the higher initial level          subsection to more intensive experiments to disentangle the
for the group B progenitors. However, the final growth per-                roles of demographic and physiological recovery from the FT
formance was still higher in B than in A (two-tailed t-test with          treatment.
unequal variances, df p 13, P p 0.0001).                                     For each FTG-evolved line and its progenitor, we calculated
   The fact that group B lines showed such large improvements             its doubling time during exponential-phase growth and the
in their growth performance in the second day of the FTG                  “apparent” lag duration (without adjusting for FT mortality),
cycle, despite their progenitors having evolved at 37 C for               as described in “Material and Methods.” Considering first the
Figure 6. Growth dynamics of the freeze-thaw-growth–evolved lines and their progenitors following freeze-thaw treatment (A) and stationary
phase at 37 C (B). Evolved group A and the ancestor are shown by dashed gray and dashed black curves, respectively. Evolved group B and
progenitors are shown as solid gray and solid black curves, respectively. Each trajectory shows the mean calculated over all of the evolved lines
or progenitors in a group, except for the single group A ancestor. In each case, the underlying trajectories were replicated ninefold for each
evolved line or progenitor, including the group A ancestor.
378 S. C. Sleight and R. E. Lenski


growth trajectories after the FT treatment (Fig. 6A), group A         ological lag for that group A–evolved line and its ancestor. The
lines evolved much faster exponential growth rates, with their        ancestor (black symbols) had an apparent lag of 324 min, while
mean doubling time almost 13 min shorter than that of the             the apparent lag for the evolved line (gray symbols) was only
ancestor (one-tailed P p 0.0075 using a t-test for comparing          155 min, the difference being 169 min. The physiological lags,
a single specimen, the ancestor, with the three evolved group         adjusted for cell mortality, were 282 min for the ancestor and
A lines). The group A lines also dramatically shortened the           135 min for the evolved line. Thus, the physiological lag was
mean duration of the apparent lag phase by 153 min relative           reduced by 147 min during the evolution of this FTG-adapted
to their ancestor (one-tailed P p 0.0066 , same test as above).       line. The other 22 min of the difference in the duration of the
By contrast, the group B lines, on average, did not evolve faster     apparent lag reflects improved survival during the FT treatment.
exponential growth than their progenitors, with the trend                Figure 7B shows the same analysis for the group B–evolved
slightly in the opposite direction (P 1 0.5 ). However, the B lines   line and its own immediate progenitor, which evolved previ-
also evolved a much faster transition into exponential growth,        ously at 37 C for 20,000 generations. The apparent lag for this
with the average duration of the apparent lag phase reduced           evolved line was 76 min, while that of its progenitor was 192
by about 105 min (one-tailed paired t-test, df p 11, P p              min, with the duration reduced during FTG evolution by 116
0.0001).                                                              min. After adjusting for mortality during freezing and thawing,
   Without the preceding FT cycle (Fig. 6B), group A lines again      the physiological lags estimated for the evolved line and its
showed faster exponential growth rates relative to those of their     progenitor were 56 and 148 min, respectively, indicating that
progenitors, with the average reduction in doubling time es-          evolution had reduced the physiological lag by about 92 min
timated to be about 9 min from these data (one-tailed P p             in this group B line.
0.0058 using a t-test for comparing a single specimen with a             Figure 8 shows the calculation of lag durations for the same
group). However, the A lines did not evolve any shorter lag           evolved lines and their progenitors, except in this case without
phase under this treatment, with the observed trend in the            an FT treatment before growth. There were no adjustments for
opposite direction (P 1 0.5). Relative to their immediate pro-        death, which does not occur at any measurable rate under these
genitors, the group B lines did not improve, on average, in           conditions (Vasi et al. 1994). For both evolved lines and their
either their doubling time (one-tailed paired t-test, df p 11,        progenitors, lag phase durations were shorter than those seen
P p 0.3007) or the duration of the lag phase before growth,           after an FT treatment. Moreover, the differences between the
which trended very slightly in the opposite direction (P 1 0.5).      FTG lines and their progenitors were much smaller, and in the
                                                                      group A case, the order was reversed. Without an FT treatment,
                                                                      the group A–evolved line had a lag duration of 84 min, whereas
Demographic and Physiological Contributions to
                                                                      that of the ancestor was only 52 min (Fig. 8A). Notice, too,
Shorter Lag Phases
                                                                      that this group A line evolved faster exponential-phase growth,
The data in the previous subsection clearly show that the FTG-        consistent with the shorter doubling times reported earlier for
evolved bacteria evolved much shorter apparent lag phases and         its group. The group B line showed no improvement in ex-
that these changes were specific to the FT treatment. However,         ponential growth rate, as expected given its progenitor’s prior
these reductions in apparent lag phase do not distinguish be-         evolution in the same medium and again consistent with earlier
tween reduced cell death, such that population growth re-             results (Fig. 8B). This group B progenitor experienced a lag of
commenced from a higher level after the FT treatment, and             34 min without an FT treatment, while its FTG-evolved deriv-
faster physiological recovery of surviving cells. To distinguish      ative had a lag of 6 min. The resulting difference of 28 min is
between these two effects, one must adjust the apparent lag           much less than the 92-min difference in lag duration observed
phase by taking into account mortality during the FT treatment.       for the same B line and its progenitor after the FT treatment
Recall Figure 2, which shows schematically how the actual du-         (Fig. 7B).
ration of the physiological lag phase is corrected for this FT           These experiments demonstrate that greater survival during
mortality. Whereas the apparent lag is calculated by extrapo-         the FT treatment and faster physiological recovery of growth
lating exponential growth back to the initial OD, which includes      capacity both contributed to the improved fitness of lines that
both living and dead cells, the actual lag is calculated by ex-       evolved under the FTG regime. We obtained additional evi-
trapolating back to the density of surviving cells only.              dence for the evolution of faster physiological recovery in two
   To address this issue, we performed more intensive experi-         subsidiary experiments (data not shown). First, we obtained
ments, including growth trajectories and FT survival assays, for      some population growth trajectories by plating and counting
single representatives of each evolved group and their progen-        cells rather than by combining measurements of ODs and cell
itors. For group A, we used the middle of the three evolved           survival. These experiments showed the faster recovery of
lines and the common ancestor; for group B, we used the               growth in the same two evolved lines relative to their progen-
evolved line designated as A 1 and its progenitor (Fig. 4).           itors. Second, we performed fluorescence microscopy at mul-
Figure 7A shows the estimation of the duration of the physi-          tiple times after an FT cycle in order to visualize actively di-
Figure 7. Lag phases following the freeze-that treatment for two freeze-thaw-growth–evolved lines and their progenitors. A, group A–evolved
line and the ancestor; B, group B–evolved line and its immediate progenitor. The evolved lines are shown as gray symbols and their progenitors
as black symbols. The apparent duration of the lag phase is where the log-linear regression crosses the initial optical density (OD). The actual
physiological duration occurs when the regression crosses the density adjusted for the proportion of surviving cells in the initial population,
shown by the dashed horizontal lines. Growth trajectories and survival calculations are means of 27 replicate assays for each evolved line and
progenitor.
Figure 8. Lag phases following stationary phase at 37 C for two freeze-thaw-growth–evolved lines and their progenitors. A, group A–evolved
line and the ancestor; B, group B–evolved line and its immediate progenitor. The evolved lines are shown as gray symbols and their progenitors
as black symbols. The duration of the lag phase extends to where the log-linear regression crosses the initial optical density (OD); there is no
appreciable mortality under this regime. Growth trajectories are means of 27 replicate assays for each evolved line and progenitor.
Evolutionary Adaptation in Escherichia coli       381


viding cells. These observations revealed that cell division began    duration of physiological lags following starvation with and
much earlier in the FTG-evolved lines than in their progenitors,      without the intervening FT treatment (Figs. 6–8). Both groups
confirming the evolution of faster physiological recovery of           of FTG-evolved lines showed much faster recovery of their
growth capacity following this stressful treatment.                   surviving cells, with growth commencing 1 h or more sooner
                                                                      than it did in their progenitors. This accelerated recovery pro-
Discussion                                                            vides a substantial head start during the subsequent exponential
                                                                      growth. We also performed fluorescence microscopy on pop-
We performed an experiment to investigate the evolutionary            ulations while they were recovering from the FT treatment;
adaptation of 15 E. coli populations to 150 2-d cycles of freezing,   these observations confirmed that many more viable cells were
thawing, and growth. No glycerol or other cryoprotective com-         in the process of doubling for the FTG-evolved lines than for
pound was added before freezing, unlike the standard method           their progenitors during the early recovery period.
used to store bacteria. The entire experiment encompassed                In addition to the differences in adaptation between the two
more than 1,000 generations. Twelve of these FTG lines were           groups of evolved lines, substantial variation also exists among
founded by progenitors that had previously evolved for 20,000         lines in the same group, especially in the B group. The differ-
generations in the same medium and at the same growth tem-            ences in adaptation between groups A and B reflect differences
perature of 37 C, except without the FT treatment between             in their selective histories, but this explanation cannot explain
reaching stationary phase and dilution in fresh medium (Fig.          the striking diversity among the B lines (Fig. 4), which shared
1). The 37 C-evolved progenitors had higher growth rates than         the same original ancestor and the same two-stage history (Fig.
did the ancestor of the other three FTG lines, but these 37 C-        1). Evidently, the 12 lines in the B group, by chance, accu-
evolved progenitors also suffered greater mortality during the        mulated different sets of mutations that cause the differences
FT treatment.                                                         in their performance. We do not know the identity of all those
   Almost all of the evolved lines showed large fitness gains in       mutations. However, we can ask whether the variation among
the FTG regime (Figs. 3, 4). We identified three distinct fitness       them reflects, at least in part, heterogeneity that was already
components that contributed to the improvement in overall             present in their progenitors that diverged for 20,000 generations
performance. First, both groups of the evolved lines exhibited        at constant 37 C. In fact, there is a significant positive corre-
substantial improvement in FT survival, although the magni-           lation between the FTG fitness levels of the evolved B lines and
tude of improvement was greater for the group B lines, whose          their progenitors (r p 0.6769, df p 10, one-tailed P p
progenitors had evolved in the same medium at constant 37 C           0.0079), indicating that some of the differential success among
(Fig. 5A). During evolution in that benign environment, the           the diverse B lines reflects variation in the extent of preadap-
progenitors became more sensitive to FT mortality (Sleight et         tation among their progenitors. However, it is also clear that
al. 2006); hence, there was greater opportunity for better sur-       most or all the B lines underwent substantial evolutionary ad-
vival, and indeed this occurred. Second, the group A lines,           aptation during the FTG experiment (Figs. 3, 4). With only
whose progenitors had not experienced the same medium,                one derived line from each progenitor, we cannot explicitly test
evolved faster exponential-phase growth (Figs. 6–8). By con-          whether the different B progenitors predisposed different final
trast, the group B lines showed no measurable gains in their          states (cf. Travisano et al. 1995). However, we might still ex-
exponential growth (Figs. 6–8). Evidently, the B progenitors          amine this issue in the future by finding the mutations that
had largely exhausted the potential for faster exponential            contribute to differences among the progenitors, finding other
growth rate during their 20,000-generation history in the same        mutations responsible for adaptation during the FTG evolution
culture medium.                                                       experiment, and then systematically recombining these muta-
   Third, and perhaps most interesting, both groups showed            tions from different lineages to ask whether the beneficial effects
striking improvement in the speed of their physiological re-          of the later mutations are conditional on or, alternatively, in-
covery from FT stress. To demonstrate and quantify this third         dependent of the earlier mutations.
component of adaptation, we had to disentangle two con-                  Many more experiments remain to be done, of course, so
founding effects. One such factor is mortality during the FT          we will close by discussing briefly our ongoing research and
cycle, which contributes to delayed recovery at the population        future directions. In this study, we have demonstrated evolu-
level but does not bear directly on the speed of recovery by          tionary adaptation to the FTG regime, and we have partitioned
surviving cells. We addressed this issue by independently mea-        the improvement into three distinct fitness components—sur-
suring FT mortality and using the data to calculate the phys-         vival, recovery, and growth—but we have not yet identified the
iological lag (Figs. 2, 7, 8). The second complication arises         physiological, biochemical, and genetic bases of the improve-
because physiological lags occur following starvation, even           ments in organismal performance. One can imagine approach-
without the FT treatment, on dilution into fresh medium. Thus,        ing this general problem by beginning at a physiological scale
one must distinguish between recovery from starvation and             and working down toward the genetic level, or vice versa. The
from freezing and thawing, which we did by measuring the              approach that we are undertaking begins at the genetic level,
382 S. C. Sleight and R. E. Lenski


which reflects our own expertise as well as the power of mo-              Without giving away the results of future articles, we have
lecular genetic analyses in bacteria. Once we have found some         found two genes in which many FTG-evolved lines have sub-
of the mutations responsible for the improved performance of          stituted parallel mutations. Such parallelism is a hallmark of
the FTG-evolved lines, we can explore the resulting biochemical       adaptive evolution (Wichman et al. 1999; Cooper et al. 2003;
and physiological mechanisms. By having gene identities in            Woods et al. 2006). These genes and their products are in two
hand, we can then target future studies to particular pathways        different physiological pathways, one affecting membrane flu-
based on the wealth of information that links the genetics,           idity and the other encoding a stress response. We are currently
biochemistry, and physiology of E. coli (Bock et al. 2006).
                                               ¨                      attempting to construct isogenic strains that differ only by mu-
   There are several different genetic approaches that one could      tations in these genes. We will then use these strains to analyze
pursue to find mutations substituted in experimental popula-           the effects of the mutations on the relevant pathways as well
tions. These approaches include DNA fingerprinting methods             as on the demographic and physiological components of sur-
to find genes with new insertions or deletions (Papadopoulos           vival and recovery that produce the evolutionary adaptation to
et al. 1999; Schneider et al. 2000; Riehle et al. 2001), sequencing   the FTG regime.
candidate genes based on specific phenotypic changes or other
prior information (Notley-McRobb and Ferenci 2000; Cooper
et al. 2001; Crozat et al. 2005; Maharjan et al. 2006; Woods et       Acknowledgments
al. 2006), analyzing changes in gene-expression profiles to sug-
gest additional candidates (Cooper et al. 2003; Riehle et al.         This research was supported by a grant from the NASA As-
2003; Pelosi et al. 2006), and even whole-genome sequencing           trobiology Institute to the Center for Genomic and Evolution-
(Shendure et al. 2005; Herring et al. 2006; Velicer et al. 2006).     ary Studies on Microbial Life at Low Temperature at Michigan
   Finding mutations, although certainly not trivial, is becom-       State University. We thank Al Bennett, John Breznak, Tom
ing much easier and less costly. But finding mutations is also         Schmidt, Mike Thomashow, Jim Tiedje, and Tom Whittam for
only a first step in the genetic analysis. An extremely important      helpful comments and discussion; two reviewers for many con-
subsequent step is to manipulate the affected gene, for example,      structive suggestions; and Jim Hicks for organizing this special
by constructing isogenic strains that differ by a single mutation     issue on experimental evolution.
(Cooper et al. 2001, 2003; Crozat et al. 2005; Pelosi et al. 2006).
Such work is possible using powerful molecular genetic ap-
proaches available in this system, but it is also painstaking and     Literature Cited
challenging work. Once such strains have been constructed,
they can be competed to test whether a particular mutation            Bakermans C., A.I. Tsapin, V. Souza-Eqipsy, D.A. Gilichinsky,
did, in fact, contribute to the observed evolutionary adaptation        and K.H. Nealson. 2003. Reproduction and metabolism at
or, alternatively, merely hitchhiked and was inconsequential to           10 C of bacteria isolated from Siberian permafrost. Envi-
any gains in performance. Of course, the same strains can also          ron Microbiol 4:321–326.
be used to examine changes in biochemical and physiological           Bennett A.F. and R.E. Lenski. 1997. Phenotypic and evolution-
traits, and the connections between genotype, phenotype, per-           ary adaptation of a model bacterial system to stressful
formance, and fitness can thus be elucidated.                            thermal environments. Pp. 135–154 in R. Bijlsma and V.
   There are many candidate biochemical and physiological               Loeschcke, eds. Environmental Stress, Adaptation and Evo-
pathways by which the FTG-evolved lines might have improved             lution. Birkhauser, Basel.
                                                                                     ¨
their FT survival as well as their subsequent recovery and tran-      ———. 1999. Experimental evolution and its role in evolu-
sition to growth. Some possibilities are altered induction of           tionary physiology. Am Zool 39:346–362.
stress responses, including molecular chaperones; better repair       Bennett A.F., R.E. Lenski, and J.E. Mittler. 1992. Evolutionary
of damage to DNA or other cell components; and regulatory               adaptation to temperature. I. Fitness responses of Escherichia
or structural changes affecting membrane fluidity, osmosis,              coli to changes in its thermal environment. Evolution 46:16–
DNA supercoiling, and ribosomes or other components of the              30.
translational machinery. We are proceeding using a two-               Bock A., R. Curtiss III, J.B. Kaper, F.C. Neidhardt, T. Nystrom,
                                                                       ¨                                                           ¨
pronged approach. First, we have chosen a set of six candidate          K.E. Rudd, and C.L. Squires, eds. 2006. Escherichia coli and
genes of interest because of their known involvement in some            Salmonella: Cellular and Molecular Biology. ASM, Washing-
of the relevant pathways, and these genes are being sequenced           ton, DC. Published online at http://www.ecosal.org.
in the FTG-evolved lines and their progenitors. Second, we are        Calcott P.H. 1985. Cryopreservation of microorganisms. CRC
taking a genomic-fingerprinting approach to look for insertions          Crit Rev Biotech 4:279–297.
and deletions caused by the movement of insertion-sequence            Calcott P.H. and A.M. Gargett. 1981. Mutagenicity of freezing
elements that are native to E. coli genomes (Papadopoulos et            and thawing. FEMS Microbiol Lett 10:151–155.
al. 1999; Schneider et al. 2000, 2002; Cooper et al. 2001).           Chippindale A. 2006. Experimental evolution. Pp. 482–501 in
Evolutionary Adaptation in Escherichia coli     383


  C.W. Fox and J.B. Wolf, eds. Evolutionary Genetics: Concepts        and Environmental Stress. Oxford University Press, New
  and Case Studies. Oxford University Press, Oxford.                  York.
Cloutier J., D. Prevost, P. Nadeau, and H. Antoun. 1992. Heat       Lenski R.E. 2004. Phenotypic and genomic evolution during a
  and cold shock protein synthesis in arctic and temperate            20,000-generation experiment with the bacterium Escherichia
  strains of rhizobia. Appl Environ Microbiol 58:2846–2853.           coli. Plant Breed Rev 24:225–265.
Cooper T.F., D.E. Rozen, and R.E. Lenski. 2003. Parallel changes    Lenski R.E. and A.F. Bennett. 1993. Evolutionary response of
  in gene expression after 20,000 generations of evolution in         Escherichia coli to thermal stress. Am Nat 142(suppl.):S47–
  Escherichia coli. Proc Natl Acad Sci USA 100:1072–1077.             S64.
Cooper V.S. and R.E. Lenski. 2000. The population genetics of       Lenski R.E., M.R. Rose, S.C. Simpson, and S.C. Tadler. 1991.
  ecological specialization in evolving E. coli populations. Na-      Long-term experimental evolution in Escherichia coli. I. Ad-
  ture 407:736–739.                                                   aptation and divergence during 2,000 generations. Am Nat
Cooper V.S., D. Schneider, M. Blot, and R.E. Lenski. 2001.            138:1315–1341.
  Mechanisms causing rapid and parallel losses of ribose ca-        Lenski R.E., V. Souza, L.P. Duong, Q.G. Phan, T.N.M. Nguyen,
  tabolism in evolving populations of E. coli B. J Bacteriol 183:     and K.P. Bertrand. 1994. Epistatic effects of promoter and
  2834–2841.                                                          repressor functions of the Tn10 tetracycline-resistance op-
Cox C.S. and R.J. Heckly. 1973. Effect of oxygen upon freeze-         eron on the fitness of Escherichia coli. Mol Ecol 3:127–135.
  dried and freeze-thawed bacteria: viability and free radical      Lenski R.E. and M. Travisano. 1994. Dynamics of adaptation
  production. Can J Microbiol 19:189–194.                             and diversification: a 10,000-generation experiment with
Crozat E., N. Philippe, R.E. Lenski, J. Geiselmann, and D.            bacterial populations. Proc Natl Acad Sci USA 91:6808–6814.
  Schneider. 2005. Long-term experimental evolution in Esch-        Lenski R.E., C.L. Winkworth, and M.A. Riley. 2003. Rates of
  erichia coli. XII. DNA topology as a key target of selection.       DNA sequence evolution in experimental populations of
  Genetics 169:523–532.                                               Escherichia coli during 20,000 generations. J Mol Evol 56:
Cullum A.J., A.F. Bennett, and R.E. Lenski. 2001. Evolutionary        498–508.
  adaptation to temperature. IX. Preadaptation to novel stress-     Leroi A.M., R.E. Lenski, and A.F. Bennett. 1994. Evolutionary
  ful environments by E. coli adapted to high temperature.            adaptation to temperature. III. Adaptation of Escherichia coli
  Evolution 55:2194–2202.                                             to a temporally varying environment. Evolution 48:1222–
Drouin P., D. Prevost, and H. Antoun. 2000. Physiological ad-         1229.
  aptation to low temperatures of strains of Rhizobium leg-         Leu J.Y. and A.W. Murray. 2006. Experimental evolution of
  uminosarum bv. viciae associated with Lathyrus spp. FEMS            mating discrimination in budding yeast. Curr Biol 16:280–
  Microb Ecol 32:111–120.                                             286.
Elena S.F. and R.E. Lenski. 2003. Evolution experiments with        Maharjan R., S. Seeto, L. Notley-McRobb, and T. Ferenci. 2006.
  microorganisms: the dynamics and genetic bases of adap-             Clonal adaptive radiation in a constant environment. Science
  tation. Nat Rev Genet 4:457–469.                                    313:514–517.
Eriksson M., J.O. Ka, and W.W. Mohn. 2001. Effects of low           Mazur P. 1984. Freezing of living cells: mechanisms and im-
  temperature and freeze-thaw cycles on hydrocarbon biode-            plications. Am J Physiol 16:C125–C142.
  gradation in arctic tundra soil. Appl Environ Microbiol 67:       Mongold J.A., A.F. Bennett, and R.E. Lenski. 1996. Evolutionary
  5107–5112.                                                          adaptation to temperature. IV. Adaptation of Escherichia coli
Gao D. and J.K. Critser. 2000. Mechanisms of cryoinjury in            at a niche boundary. Evolution 50:35–43.
  living cells. ILAR J 41:187–196.                                  ———. 1999. Evolutionary adaptation to temperature. VII.
Grecz N., T.L. Hammer, C.J. Robnett, and M.D. Long. 1980.             Extension of the upper thermal limit of Escherichia coli. Evo-
  Freeze-thaw injury: evidence for double strand breaks in            lution 53:386–394.
  Escherichia coli DNA. Biochem Biophys Res Commun 93:              Monnet C., C. Beal, and G. Corrieu. 2003. Improvement of
  1110–1113.                                                          the resistance of Lactobacillus delbrueckii ssp. bulgaricus to
Hebraud M. and P. Potier. 1999. Cold shock response and low           freezing by natural selection. J Dairy Sci 86:3048–3053.
  temperature adaptation in psychrotrophic bacteria. J Mol          Mountfort D.O., H.F. Kaspar, R.A. Asher, and D. Sutherland.
  Microbiol Biotechnol 1:211–219.                                     2003. Influences of pond geochemistry, temperature, and
Herring C.D., A. Raghunathan, C. Honisch, T. Patel, M.K. Ap-          freeze-thaw on terminal anaerobic processes occurring in
  plebee, A.R. Joyce, T.J. Albert, et al. 2006. Comparative ge-       sediments of six ponds of the McMurdo Ice Shelf, near Bra-
  nome sequencing of Escherichia coli allows observation of           tina Island, Antarctica. Appl Environ Microbiol 69:583–592.
  bacterial evolution on a laboratory timescale. Nat Genet 38:      Muryoi N., M. Sato, S. Kaneko, H. Kawahara, H. Obata, M.W.
  1406–1412.                                                          Yaish, M. Griffith, and B.R. Glick. 2004. Cloning and ex-
Hoffmann A.A. and P.A. Parsons. 1993. Evolutionary Genetics           pression of afpA, a gene encoding an antifreeze protein from
384 S. C. Sleight and R. E. Lenski


  the arctic plant growth-promoting rhizobacterium Pseudo-              coli. IX. Characterization of insertion sequence-mediated
  monas putida GR12–2. J Bacteriol 17:5661–5671.                        mutations and rearrangements. Genetics 156:477–488.
Notley-McRobb L. and T. Ferenci. 2000. Experimental analysis         Schneider D., E. Duperchy, J. Depeyrot, E. Coursange, R.E.
  of molecular events during mutational periodic selections in          Lenski, and M. Blot. 2002. Genomic comparisons among
  bacterial evolution. Genetics 156:1493–1501.                          Escherichia coli strains B, K-12, and O157:H7 using IS ele-
Panoff J.M., B. Thammavongs, and M. Gueguen. 2000. Cryo-                ments as molecular markers. BMC Microbiol 2:18.
  protectants lead to phenotypic adaptation to freeze-thaw           Schoustra S.E., A.J. Debets, M. Slakhorst, and R.F. Hoekstra.
  stress in Lactobacillus delbrueckii spp. bulgaricus CIP 101027T.      2006. Reducing the cost of resistance: experimental evolution
  Cryobiology 40:264–269.                                               in the filamentous fungus Aspergillus nidulans. J Evol Biol
Papadopoulos D., D. Schneider, J. Meier-Eiss, W. Arber, R.E.            19:1115–1127.
  Lenski, and M. Blot. 1999. Genomic evolution during a              Shendure J., G.J. Porreca, N.B. Reppas, X. Lin, J.P. McCutcheon,
  10,000-generation experiment with bacteria. Proc Natl Acad            A.M. Rosenbaum, M.D. Wang, K. Zhang, R.D. Mitra, and
  Sci USA 96:3807–3812.                                                 G.M. Church. 2005. Accurate multiplex polony sequencing
Parsons P.A. 1987. Evolutionary rates under environmental               of an evolved bacterial genome. Science 309:1728–1732.
  stress. Pp. 311–347 in M.K. Hecht, B. Wallace, and G.T.            Siddiqui K.S. and R. Cavicchioli. 2006. Cold-adapted enzymes.
  Prance, eds. Evolutionary Biology. Vol. 21. Plenum, New               Annu Rev Biochem 75:403–433.
  York.                                                              Sleight S.C., N.S. Wigginton, and R.E. Lenski. 2006. Increased
Pelosi L., L. Kuhn, D. Guetta, J. Garin, J. Geiselmann, R.E.
                ¨                                                       susceptibility to repeated freeze-thaw cycles in Escherichia coli
  Lenski, and D. Schneider. 2006. Parallel changes in global            following long-term evolution in a benign environment.
  protein profiles during long-term experimental evolution in            BMC Evol Biol 6:104.
  Escherichia coli. Genetics 173:1851–1869.                          Sokal R.R. and F.J. Rohlf. 1981. Biometry. W.H. Freeman, New
Ponder M.A., S.J. Gilmour, P.W. Bergholz, C.A. Mindock, R.              York.
  Hollingsworth, M.F. Thomashow, and J.M. Tiedje. 2005.              Souzu H., M. Sato, and T. Kojima. 1989. Changes in chemical
  Characterization of potential stress responses in ancient Si-
                                                                        structure and function in Escherichia coli cell membranes
  berian permafrost psychroactive bacteria. FEMS Microbiol
                                                                        caused by freezing and thawing. II. Membrane lipid state and
  Ecol 1:103–115.
                                                                        response of cells to dehydration. Biochim Biophys Acta 978:
Queitsch C., T.A. Sangster, and S. Lindquist. 2002. Hsp90 as a
                                                                        112–118.
  capacitor of phenotypic variation. Nature 417:618–624.
                                                                     Thammavongs B., D. Corroler, J.M. Panoff, Y. Auffray, and P.
Riehle M.M., A.F. Bennett, R.E. Lenski, and A.D. Long. 2003.
                                                                        Boutibonnes. 1996. Physiological response of Enterococcus
  Evolutionary changes in heat-inducible gene expression in
                                                                        faecalis JH2-2 to cold shock: growth at low temperatures and
  lines of Escherichia coli adapted to high temperature. Physiol
                                                                        freezing/thawing challenge. Lett Appl Microbiol 23:398–402.
  Genom 14:47–58.
                                                                     Travisano M. 1997. Long-term experimental evolution in Esch-
Riehle M.M., A.F. Bennett, and A.D. Long. 2001. Genetic ar-
                                                                        erichia coli. VI. Environmental constraints on adaptation and
  chitecture of thermal adaptation in Escherichia coli. Proc Natl
                                                                        divergence. Genetics 146:471–479.
  Acad Sci USA 98:525–530.
———. 2005. Changes in gene expression following high-tem-            Travisano M., J.A. Mongold, A.F. Bennett, and R.E. Lenski.
  perature adaptation in experimentally evolved populations             1995. Experimental tests of the roles of adaptation, chance,
  of E. coli. Physiol Biochem Zool 78:299–315.                          and history in evolution. Science 267:87–90.
Rivkina E.M., E.I. Friedmann, C.P. McKay, and D.A. Gili-             Vasi F., M. Travisano, and R.E. Lenski. 1994. Long-term ex-
  chinksy. 2000. Metabolic activity of permafrost bacteria be-          perimental evolution in Escherichia coli. II. Changes in life-
  low the freezing point. Appl Environ Microbiol 66:3230–               history traits during adaptation to a seasonal environment.
  3233.                                                                 Am Nat 144:432–456.
Rose M.R. 1984. Laboratory evolution of postponed senescence         Velicer G.J., G. Raddatz, H. Keller, S. Deiss, C. Lanz, I. Din-
  in Drosophila melanogaster. Evolution 38:1004–1010.                   kelacker, and S.C. Schuster. 2006. Comprehensive mutation
Rozen D.E. and R.E. Lenski. 2000. Long-term experimental                identification in an evolved bacterial cooperator and its
  evolution in Escherichia coli. VIII. Dynamics of a balanced           cheating ancestor. Proc Natl Acad Sci USA 103:8107–8112.
  polymorphism. Am Nat 155:24–35.                                    Walker V.K., G.R. Palmer, and G. Voordouw. 2006. Freeze-thaw
Russell N.J. 1990. Cold adaptation of microorganisms. Philos            tolerance and clues to the winter survival of a soil com-
  Trans R Soc B 326:598–608.                                            munity. Appl Environ Microbiol 72:1784–1792.
Rutherford S.L. and S. Lindquist. 1998. Hsp90 as a capacitor         Wichman H.A., M.R. Badgett, L.A. Scott, C.M. Boulianne, and
  for morphological evolution. Nature 396:336–342.                      J.J. Bull. 1999. Different trajectories of parallel evolution dur-
Schneider D., E. Duperchy, E. Coursange, R.E. Lenski, and M.            ing viral adaptation. Science 285:422–424.
  Blot. 2000. Long-term experimental evolution in Escherichia        Wichman H.A., L.A. Scott, C.D. Yarber, and J.J. Bull. 2000.
Evolutionary Adaptation in Escherichia coli   385


 Experimental evolution recapitulates natural evolution. Phi-       term experiment with Escherichia coli. Proc Natl Acad Sci
 los Trans R Soc B 355:1677–1684.                                   USA 103:9107–9112.
Woods R., D. Schneider, C.L. Winkworth, M.A. Riley, and R.E.      Zeyl C. 2006. Experimental evolution with yeast. FEMS Yeast
 Lenski. 2006. Tests of parallel molecular evolution in a long-     Res 6:685–691.

Mais conteúdo relacionado

Mais procurados

UC Davis EVE161 Lecture 18 by @phylogenomics
 UC Davis EVE161 Lecture 18 by @phylogenomics UC Davis EVE161 Lecture 18 by @phylogenomics
UC Davis EVE161 Lecture 18 by @phylogenomicsJonathan Eisen
 
Seminário 6 horner-devineetal 2003_bacteria (1)
Seminário 6 horner-devineetal 2003_bacteria (1)Seminário 6 horner-devineetal 2003_bacteria (1)
Seminário 6 horner-devineetal 2003_bacteria (1)Carlos Alberto Monteiro
 
Discovering the 100 Trillion Bacteria Living Within Each of Us
Discovering the 100 Trillion Bacteria Living Within Each of UsDiscovering the 100 Trillion Bacteria Living Within Each of Us
Discovering the 100 Trillion Bacteria Living Within Each of UsLarry Smarr
 
Microbial Phylogenomics (EVE161) Class 5
Microbial Phylogenomics (EVE161) Class 5Microbial Phylogenomics (EVE161) Class 5
Microbial Phylogenomics (EVE161) Class 5Jonathan Eisen
 
Statins Talk 2009
Statins Talk 2009Statins Talk 2009
Statins Talk 2009rhondagarza
 
UC Davis EVE161 Lecture 17 by @phylogenomics
 UC Davis EVE161 Lecture 17 by @phylogenomics UC Davis EVE161 Lecture 17 by @phylogenomics
UC Davis EVE161 Lecture 17 by @phylogenomicsJonathan Eisen
 
Microbial Phylogenomics (EVE161) Class 10-11: Genome Sequencing
Microbial Phylogenomics (EVE161) Class 10-11: Genome SequencingMicrobial Phylogenomics (EVE161) Class 10-11: Genome Sequencing
Microbial Phylogenomics (EVE161) Class 10-11: Genome SequencingJonathan Eisen
 
Microbial Phylogenomics (EVE161) Class 15: Shotgun Metagenomics
Microbial Phylogenomics (EVE161) Class 15: Shotgun Metagenomics Microbial Phylogenomics (EVE161) Class 15: Shotgun Metagenomics
Microbial Phylogenomics (EVE161) Class 15: Shotgun Metagenomics Jonathan Eisen
 
UC Davis EVE161 Lecture 9 by @phylogenomics
UC Davis EVE161 Lecture 9 by @phylogenomicsUC Davis EVE161 Lecture 9 by @phylogenomics
UC Davis EVE161 Lecture 9 by @phylogenomicsJonathan Eisen
 
BIS2C: Lecture 13: The Human Microbiome
BIS2C: Lecture 13: The Human MicrobiomeBIS2C: Lecture 13: The Human Microbiome
BIS2C: Lecture 13: The Human MicrobiomeJonathan Eisen
 
Microbial Phylogenomics (EVE161) Class 13 - Comparative Genomics
Microbial Phylogenomics (EVE161) Class 13 - Comparative GenomicsMicrobial Phylogenomics (EVE161) Class 13 - Comparative Genomics
Microbial Phylogenomics (EVE161) Class 13 - Comparative GenomicsJonathan Eisen
 
UC Davis EVE161 Lecture 14 by @phylogenomics
UC Davis EVE161 Lecture 14 by @phylogenomicsUC Davis EVE161 Lecture 14 by @phylogenomics
UC Davis EVE161 Lecture 14 by @phylogenomicsJonathan Eisen
 
Microbial Phylogenomics (EVE161) Class 14: Metagenomics
Microbial Phylogenomics (EVE161) Class 14: MetagenomicsMicrobial Phylogenomics (EVE161) Class 14: Metagenomics
Microbial Phylogenomics (EVE161) Class 14: MetagenomicsJonathan Eisen
 
Is microbial ecology driven by roaming genes?
Is microbial ecology driven by roaming genes?Is microbial ecology driven by roaming genes?
Is microbial ecology driven by roaming genes?beiko
 

Mais procurados (20)

UC Davis EVE161 Lecture 18 by @phylogenomics
 UC Davis EVE161 Lecture 18 by @phylogenomics UC Davis EVE161 Lecture 18 by @phylogenomics
UC Davis EVE161 Lecture 18 by @phylogenomics
 
Seminário 6 horner-devineetal 2003_bacteria (1)
Seminário 6 horner-devineetal 2003_bacteria (1)Seminário 6 horner-devineetal 2003_bacteria (1)
Seminário 6 horner-devineetal 2003_bacteria (1)
 
Discovering the 100 Trillion Bacteria Living Within Each of Us
Discovering the 100 Trillion Bacteria Living Within Each of UsDiscovering the 100 Trillion Bacteria Living Within Each of Us
Discovering the 100 Trillion Bacteria Living Within Each of Us
 
Biot.2006.1.1
Biot.2006.1.1Biot.2006.1.1
Biot.2006.1.1
 
Microbial Phylogenomics (EVE161) Class 5
Microbial Phylogenomics (EVE161) Class 5Microbial Phylogenomics (EVE161) Class 5
Microbial Phylogenomics (EVE161) Class 5
 
38-Pant LSD1
38-Pant LSD138-Pant LSD1
38-Pant LSD1
 
Statins Talk 2009
Statins Talk 2009Statins Talk 2009
Statins Talk 2009
 
Jensen et al., 2010
Jensen et al., 2010Jensen et al., 2010
Jensen et al., 2010
 
UC Davis EVE161 Lecture 17 by @phylogenomics
 UC Davis EVE161 Lecture 17 by @phylogenomics UC Davis EVE161 Lecture 17 by @phylogenomics
UC Davis EVE161 Lecture 17 by @phylogenomics
 
Microbial Phylogenomics (EVE161) Class 10-11: Genome Sequencing
Microbial Phylogenomics (EVE161) Class 10-11: Genome SequencingMicrobial Phylogenomics (EVE161) Class 10-11: Genome Sequencing
Microbial Phylogenomics (EVE161) Class 10-11: Genome Sequencing
 
Microbial Phylogenomics (EVE161) Class 15: Shotgun Metagenomics
Microbial Phylogenomics (EVE161) Class 15: Shotgun Metagenomics Microbial Phylogenomics (EVE161) Class 15: Shotgun Metagenomics
Microbial Phylogenomics (EVE161) Class 15: Shotgun Metagenomics
 
Re-revised CV
Re-revised CVRe-revised CV
Re-revised CV
 
UC Davis EVE161 Lecture 9 by @phylogenomics
UC Davis EVE161 Lecture 9 by @phylogenomicsUC Davis EVE161 Lecture 9 by @phylogenomics
UC Davis EVE161 Lecture 9 by @phylogenomics
 
Chen 2008
Chen 2008Chen 2008
Chen 2008
 
BIS2C: Lecture 13: The Human Microbiome
BIS2C: Lecture 13: The Human MicrobiomeBIS2C: Lecture 13: The Human Microbiome
BIS2C: Lecture 13: The Human Microbiome
 
Microbial Phylogenomics (EVE161) Class 13 - Comparative Genomics
Microbial Phylogenomics (EVE161) Class 13 - Comparative GenomicsMicrobial Phylogenomics (EVE161) Class 13 - Comparative Genomics
Microbial Phylogenomics (EVE161) Class 13 - Comparative Genomics
 
UC Davis EVE161 Lecture 14 by @phylogenomics
UC Davis EVE161 Lecture 14 by @phylogenomicsUC Davis EVE161 Lecture 14 by @phylogenomics
UC Davis EVE161 Lecture 14 by @phylogenomics
 
Microbial Phylogenomics (EVE161) Class 14: Metagenomics
Microbial Phylogenomics (EVE161) Class 14: MetagenomicsMicrobial Phylogenomics (EVE161) Class 14: Metagenomics
Microbial Phylogenomics (EVE161) Class 14: Metagenomics
 
Winnetal
WinnetalWinnetal
Winnetal
 
Is microbial ecology driven by roaming genes?
Is microbial ecology driven by roaming genes?Is microbial ecology driven by roaming genes?
Is microbial ecology driven by roaming genes?
 

Destaque (14)

F tecnica campilobacteriosis
F tecnica campilobacteriosisF tecnica campilobacteriosis
F tecnica campilobacteriosis
 
Campylo bacte exp
Campylo bacte expCampylo bacte exp
Campylo bacte exp
 
Campylobacter
CampylobacterCampylobacter
Campylobacter
 
Campilobacteriosis
CampilobacteriosisCampilobacteriosis
Campilobacteriosis
 
(2013-05-24) PROTOCOLO DE VIGILANCIA DE CAMPILOBACTERIOSIS (ppt)
(2013-05-24) PROTOCOLO DE VIGILANCIA DE CAMPILOBACTERIOSIS (ppt)(2013-05-24) PROTOCOLO DE VIGILANCIA DE CAMPILOBACTERIOSIS (ppt)
(2013-05-24) PROTOCOLO DE VIGILANCIA DE CAMPILOBACTERIOSIS (ppt)
 
E.COLI
E.COLIE.COLI
E.COLI
 
Campylobacter yeyuni
Campylobacter yeyuni Campylobacter yeyuni
Campylobacter yeyuni
 
Mcq on normal and abnormal labor for undergraduate
Mcq on normal and abnormal labor for undergraduateMcq on normal and abnormal labor for undergraduate
Mcq on normal and abnormal labor for undergraduate
 
17. campylobacter jejuni
17.  campylobacter jejuni17.  campylobacter jejuni
17. campylobacter jejuni
 
Campylobacter jejuni
Campylobacter jejuniCampylobacter jejuni
Campylobacter jejuni
 
Escherichia coli
Escherichia coliEscherichia coli
Escherichia coli
 
Escherichia coli
Escherichia coliEscherichia coli
Escherichia coli
 
Escherichia coli
Escherichia coliEscherichia coli
Escherichia coli
 
Atlas Microbiologia Clinica Pate I
Atlas Microbiologia Clinica Pate IAtlas Microbiologia Clinica Pate I
Atlas Microbiologia Clinica Pate I
 

Semelhante a Sleight and lenski_pbz_2007

Nrf2: A Guardian of Healthspan and Gatekeeper of Species Longevity
Nrf2:  A Guardian of Healthspan and Gatekeeper of Species LongevityNrf2:  A Guardian of Healthspan and Gatekeeper of Species Longevity
Nrf2: A Guardian of Healthspan and Gatekeeper of Species LongevityLifeVantage
 
Chan Goldmark & Roth 2010
Chan Goldmark & Roth 2010Chan Goldmark & Roth 2010
Chan Goldmark & Roth 2010Kin Chan
 
niche_construction_evolution2005_3449025
niche_construction_evolution2005_3449025niche_construction_evolution2005_3449025
niche_construction_evolution2005_3449025Converse Griffith
 
Shifts in phenology due to global climate change: The need for a yardstick
Shifts in phenology due to global climate change: The need for a yardstickShifts in phenology due to global climate change: The need for a yardstick
Shifts in phenology due to global climate change: The need for a yardstickSimoneBoccuccia
 
O R I G I N A L A RT I C L Edoi10.1111evo.13631Two d.docx
O R I G I N A L A RT I C L Edoi10.1111evo.13631Two d.docxO R I G I N A L A RT I C L Edoi10.1111evo.13631Two d.docx
O R I G I N A L A RT I C L Edoi10.1111evo.13631Two d.docxamit657720
 
O R I G I N A L A RT I C L Edoi10.1111evo.13631Two d.docx
O R I G I N A L A RT I C L Edoi10.1111evo.13631Two d.docxO R I G I N A L A RT I C L Edoi10.1111evo.13631Two d.docx
O R I G I N A L A RT I C L Edoi10.1111evo.13631Two d.docxvannagoforth
 
Seed viability equations and application of nomograohs in storage
Seed viability equations and application of nomograohs in storageSeed viability equations and application of nomograohs in storage
Seed viability equations and application of nomograohs in storagekartoori sai santhosh
 
Seed viability equations and application of nomograohs in storage
Seed viability equations and application of nomograohs in storageSeed viability equations and application of nomograohs in storage
Seed viability equations and application of nomograohs in storagekartoori sai santhosh
 
Paper id 21201481
Paper id 21201481Paper id 21201481
Paper id 21201481IJRAT
 
vol. 191, no. 1 the american naturalist january 2018E-Articl.docx
vol. 191, no. 1 the american naturalist january 2018E-Articl.docxvol. 191, no. 1 the american naturalist january 2018E-Articl.docx
vol. 191, no. 1 the american naturalist january 2018E-Articl.docxjessiehampson
 
PNAS-2013-Barr-10771-6
PNAS-2013-Barr-10771-6PNAS-2013-Barr-10771-6
PNAS-2013-Barr-10771-6Rita Auro
 
Why is it important to study reactions norms to understand phenotypi.pdf
Why is it important to study reactions norms to understand phenotypi.pdfWhy is it important to study reactions norms to understand phenotypi.pdf
Why is it important to study reactions norms to understand phenotypi.pdfarrowmobile
 
2000 weinberg. hallsmarcks of cancer new generation
2000 weinberg. hallsmarcks of cancer new generation2000 weinberg. hallsmarcks of cancer new generation
2000 weinberg. hallsmarcks of cancer new generationNatalia Muñoz Roa
 
2013 Bazzell, et al dietary composition regulates Drosophila mobility and car...
2013 Bazzell, et al dietary composition regulates Drosophila mobility and car...2013 Bazzell, et al dietary composition regulates Drosophila mobility and car...
2013 Bazzell, et al dietary composition regulates Drosophila mobility and car...Brian Bazzell, PharmD
 
Cell, Vol. 100, 57–70, January 7, 2000, Copyright 2000 by Cel.docx
Cell, Vol. 100, 57–70, January 7, 2000, Copyright 2000 by Cel.docxCell, Vol. 100, 57–70, January 7, 2000, Copyright 2000 by Cel.docx
Cell, Vol. 100, 57–70, January 7, 2000, Copyright 2000 by Cel.docxzebadiahsummers
 
Cell, Vol. 100, 57–70, January 7, 2000, Copyright 2000 by Cel.docx
Cell, Vol. 100, 57–70, January 7, 2000, Copyright 2000 by Cel.docxCell, Vol. 100, 57–70, January 7, 2000, Copyright 2000 by Cel.docx
Cell, Vol. 100, 57–70, January 7, 2000, Copyright 2000 by Cel.docxketurahhazelhurst
 
An Introduction To Zoology
An Introduction To ZoologyAn Introduction To Zoology
An Introduction To ZoologyApril Smith
 
Current_Protocols_in_Stem_Cell_Biology.pdf
Current_Protocols_in_Stem_Cell_Biology.pdfCurrent_Protocols_in_Stem_Cell_Biology.pdf
Current_Protocols_in_Stem_Cell_Biology.pdfhaploidentical
 

Semelhante a Sleight and lenski_pbz_2007 (20)

Nrf2: A Guardian of Healthspan and Gatekeeper of Species Longevity
Nrf2:  A Guardian of Healthspan and Gatekeeper of Species LongevityNrf2:  A Guardian of Healthspan and Gatekeeper of Species Longevity
Nrf2: A Guardian of Healthspan and Gatekeeper of Species Longevity
 
Chan Goldmark & Roth 2010
Chan Goldmark & Roth 2010Chan Goldmark & Roth 2010
Chan Goldmark & Roth 2010
 
niche_construction_evolution2005_3449025
niche_construction_evolution2005_3449025niche_construction_evolution2005_3449025
niche_construction_evolution2005_3449025
 
Shifts in phenology due to global climate change: The need for a yardstick
Shifts in phenology due to global climate change: The need for a yardstickShifts in phenology due to global climate change: The need for a yardstick
Shifts in phenology due to global climate change: The need for a yardstick
 
Correlación Eficacia vs Heterosigosidad
Correlación Eficacia vs HeterosigosidadCorrelación Eficacia vs Heterosigosidad
Correlación Eficacia vs Heterosigosidad
 
O R I G I N A L A RT I C L Edoi10.1111evo.13631Two d.docx
O R I G I N A L A RT I C L Edoi10.1111evo.13631Two d.docxO R I G I N A L A RT I C L Edoi10.1111evo.13631Two d.docx
O R I G I N A L A RT I C L Edoi10.1111evo.13631Two d.docx
 
O R I G I N A L A RT I C L Edoi10.1111evo.13631Two d.docx
O R I G I N A L A RT I C L Edoi10.1111evo.13631Two d.docxO R I G I N A L A RT I C L Edoi10.1111evo.13631Two d.docx
O R I G I N A L A RT I C L Edoi10.1111evo.13631Two d.docx
 
Seed viability equations and application of nomograohs in storage
Seed viability equations and application of nomograohs in storageSeed viability equations and application of nomograohs in storage
Seed viability equations and application of nomograohs in storage
 
Seed viability equations and application of nomograohs in storage
Seed viability equations and application of nomograohs in storageSeed viability equations and application of nomograohs in storage
Seed viability equations and application of nomograohs in storage
 
Paper id 21201481
Paper id 21201481Paper id 21201481
Paper id 21201481
 
vol. 191, no. 1 the american naturalist january 2018E-Articl.docx
vol. 191, no. 1 the american naturalist january 2018E-Articl.docxvol. 191, no. 1 the american naturalist january 2018E-Articl.docx
vol. 191, no. 1 the american naturalist january 2018E-Articl.docx
 
PNAS-2013-Barr-10771-6
PNAS-2013-Barr-10771-6PNAS-2013-Barr-10771-6
PNAS-2013-Barr-10771-6
 
Article 9
Article 9Article 9
Article 9
 
Why is it important to study reactions norms to understand phenotypi.pdf
Why is it important to study reactions norms to understand phenotypi.pdfWhy is it important to study reactions norms to understand phenotypi.pdf
Why is it important to study reactions norms to understand phenotypi.pdf
 
2000 weinberg. hallsmarcks of cancer new generation
2000 weinberg. hallsmarcks of cancer new generation2000 weinberg. hallsmarcks of cancer new generation
2000 weinberg. hallsmarcks of cancer new generation
 
2013 Bazzell, et al dietary composition regulates Drosophila mobility and car...
2013 Bazzell, et al dietary composition regulates Drosophila mobility and car...2013 Bazzell, et al dietary composition regulates Drosophila mobility and car...
2013 Bazzell, et al dietary composition regulates Drosophila mobility and car...
 
Cell, Vol. 100, 57–70, January 7, 2000, Copyright 2000 by Cel.docx
Cell, Vol. 100, 57–70, January 7, 2000, Copyright 2000 by Cel.docxCell, Vol. 100, 57–70, January 7, 2000, Copyright 2000 by Cel.docx
Cell, Vol. 100, 57–70, January 7, 2000, Copyright 2000 by Cel.docx
 
Cell, Vol. 100, 57–70, January 7, 2000, Copyright 2000 by Cel.docx
Cell, Vol. 100, 57–70, January 7, 2000, Copyright 2000 by Cel.docxCell, Vol. 100, 57–70, January 7, 2000, Copyright 2000 by Cel.docx
Cell, Vol. 100, 57–70, January 7, 2000, Copyright 2000 by Cel.docx
 
An Introduction To Zoology
An Introduction To ZoologyAn Introduction To Zoology
An Introduction To Zoology
 
Current_Protocols_in_Stem_Cell_Biology.pdf
Current_Protocols_in_Stem_Cell_Biology.pdfCurrent_Protocols_in_Stem_Cell_Biology.pdf
Current_Protocols_in_Stem_Cell_Biology.pdf
 

Sleight and lenski_pbz_2007

  • 1. 370 Evolutionary Adaptation to Freeze-Thaw-Growth Cycles in Escherichia coli Sean C. Sleight* is whether a population can survive the stress and persist on Richard E. Lenski an evolutionary timescale or whether it will become extinct, Department of Microbiology and Molecular Genetics, and many factors influence the outcome: the frequency of stress Michigan State University, East Lansing, Michigan 48824 conditions, the conditions for growth between bouts of stress, and so on. Assuming that a population survives, then there Accepted 2/13/2007; Electronically Published 5/7/2007 exists the potential for evolutionary changes that improve sur- vival and recovery under the same or similar stresses in the future. The direct study of evolutionary changes can be accom- ABSTRACT plished by observing populations of bacteria or other organisms Fifteen populations of Escherichia coli were propagated for 150 with suitably short generations while they are propagated in freeze-thaw-growth (FTG) cycles in order to study the phe- controlled and reproducible laboratory environments (Rose notypic and genetic changes that evolve under these stressful 1984; Lenski et al. 1991; Bennett et al. 1992; Bennett and Lenski conditions. Here we present the phenotypic differences between 1999; Wichman et al. 1999, 2000; Elena and Lenski 2003; Lenski the evolved lines and their progenitors as measured by com- 2004; Riehle et al. 2005; Chippindale 2006; Herring et al. 2006; petition experiments and growth curves. Three FTG lines Leu and Murray 2006; Schoustra et al. 2006; Zeyl 2006). Ad- evolved from an ancestral strain that was previously used to vantages of using bacteria in experimental evolution include start a long-term evolution experiment, while the other 12 FTG their rapid generations and large populations as well the ca- lines are derived from clones that had previously evolved for pabilities of establishing replicate populations from the same 20,000 generations at constant 37 C. Competition experiments ancestral clone and reviving ancestral and derived cells stored indicate that the former FTG group improved their mean fitness at different times in an experiment. Also, bacteria reproduce under the FTG regime by about 90% relative to their progenitor, asexually, and thus, stable genetic markers can be used to dis- while the latter FTG group gained on average about 60% rel- tinguish ancestral from derived genotypes during competition ative to their own progenitors. These increases in fitness result experiments to measure their relative fitness. Moreover, a from both improved survival during freezing and thawing and wealth of genetic, biochemical, and physiological information more rapid recovery to initiate exponential growth after thaw- exists for model species, including Escherichia coli, that can ing. This shorter lag phase is specific to recovery after freezing enrich and inform analyses built around evolution experiments. and thawing. Future work will seek to identify the mutations In a long-term evolution experiment, Lenski and colleagues responsible for evolutionary adaptation to the FTG environ- studied the dynamics of phenotypic and genomic evolution in ment and use them to explore the physiological mechanisms 12 initially identical populations of E. coli while they were prop- that allow increased survival and more rapid recovery. agated in a glucose-supplemented minimal medium at 37 C for more than 20,000 generations (Lenski et al. 1991; Lenski and Travisano 1994; Cooper and Lenski 2000; Rozen and Lenski 2000; Schneider et al. 2000; Cooper et al. 2003; Lenski et al. Introduction 2003; Pelosi et al. 2006; Woods et al. 2006). Bennett and col- leagues performed related experiments in which bacteria de- Most physiological and genetic studies of adaptation to stressful rived from this long-term study were used to establish several environments focus on the proximate mechanisms that pro- sets of new populations that continued to evolve in the same mote survival and growth. By contrast, research on the evo- medium but under different thermal regimes, including con- lutionary adaptation of organisms to stressful environments stant lower and higher temperatures as well as in temporally examines how new stress responses evolve or existing stress fluctuating environments (Bennett et al. 1992; Lenski and Ben- responses are reshaped by selection. One immediate question nett 1993; Leroi et al. 1994; Travisano et al. 1995; Mongold et al. 1996, 1999; Bennett and Lenski 1999; Cullum et al. 2001; * Corresponding author; e-mail: sleight3@msu.edu. Riehle et al. 2001, 2003, 2005). The latter studies have shown Physiological and Biochemical Zoology 80(4):370–385. 2007. 2007 by The adaptation that is often temperature specific, with frequent but University of Chicago. All rights reserved. 1522-2152/2007/8004-6111$15.00 not universal trade-offs in performance at other temperatures.
  • 2. Evolutionary Adaptation in Escherichia coli 371 There is evidence from these studies, as well as others, to suggest ice formation and dehydration resulting from hyperosmotic that rates of evolutionary adaptation to stressful environments shock (Mazur 1984; Gao and Critser 2000). Also, freezing and may often exceed corresponding rates in nonstressful environ- thawing cause oxidative damage (Cox and Heckly 1973) and ments (Parsons 1987; Hoffman and Parsons 1993; Lenski and can thus be mutagenic (Grecz et al. 1980; Calcott and Gargett Bennett 1993; Bennett and Lenski 1997; Rutherford and Lind- 1981). In the face of all these potentially damaging effects, many quist 1998; Queitsch et al. 2002). bacteria nonetheless can protect themselves or otherwise re- In this study, we examine the evolutionary adaptation of E. cover under the right circumstances (Calcott 1985). Several coli populations to a regime of alternating days of freezing variables have been shown to affect whether bacteria can survive without added cryoprotectant at 80 C and thawing at room freezing and thawing, including nutritional status, growth temperature, followed by growth at the benign temperature of phase, and cooling rate (Calcott 1985; Gao and Critser 2000). 37 C. In preliminary work, we found that repeated freeze-thaw For example, bacteria harvested in stationary phase survive (FT) cycles cause mortality such that without intervening op- freezing and thawing much better than those harvested during portunities for growth, populations become extinct. Therefore, exponential growth (Souzu et al. 1989). Furthermore, preex- the opportunity for growth every other day allows populations posure to cold, osmotic, and other stresses can increase sub- to recover and multiply, including the generation of new mu- sequent FT survival, presumably owing to changes in levels of tations that might allow improved survival during or faster particular proteins or other cell components that provide cross recovery following FT cycles. Our aims here are to report the tolerance (Thammavongs et al. 1996; Drouin et al. 2000; Panoff basic experimental design, provide evidence for adaptation to et al. 2000). this regime, and determine whether adaptation occurs by im- Various approaches could be pursued to investigate the mo- proved survival, faster recovery, or both. Also, our study shows lecular genetic basis of FT tolerance. The traditional genetic how evolutionary history can influence evolutionary changes approach screens sets of insertion mutants to identify those because the populations were founded by strains that had dif- that are deficient in FT survival but not in their ability to grow ferent histories before this experiment. We will conclude by under permissive conditions, presumably owing to knockouts outlining our future plans to identify the genetic and physio- of genes whose products are specifically required for FT survival logical bases of the adaptations reported here. or recovery. Analyses of changes in mRNA and protein levels Before turning to this evolution experiment, we now provide might allow the identification of other genes whose expression a brief overview of bacteria in nature that experience freezing levels are altered during freezing, thawing, or subsequent re- and thawing conditions, their physiological responses to freez- covery. An evolutionary approach, such as the one we have ing and thawing, and a preliminary experiment that we per- pursued, differs because it allows the study of improvements formed to identify the conditions for our evolution experiment. in the stress response and not just the basis of the tolerance as Many different bacterial species live in environments that are it presently exists in a particular strain or species. Indeed, there subject to freezing and thawing, including Siberian permafrost may be many different types of evolutionary adaptations that (Rivkina et al. 2000), arctic tundra (Eriksson et al. 2001), and could improve FT survival and recovery, some of which might Antarctic ponds (Mountfort et al. 2003). Some of these bacteria involve genes other than those already known to be important live as parts of mat communities that include diatoms and green for this stress response. By studying the evolution of multiple algae as well as cyanobacteria. Metabolic activity and growth experimental lines, including ones started with different an- have been reported for some permafrost bacteria at tempera- cestral strains, one can observe the uniformity or diversity of tures as low as 10 C (Bakermans et al. 2003). Comparative responses to any given stress. Also, the use of a mesophilic evidence suggests that evolutionary adaptation to these FT en- organism such as E. coli, instead of a psychrophilic species that vironments has involved changes in cold shock or cold active is already cold adapted, may increase the opportunity to see proteins (Cloutier et al. 1992; Hebraud and Potier 1999; Sid- new evolutionary adaptations to FT conditions on an experi- diqui and Cavicchioli 2006), membrane fluidity (Russell 1990; mental timescale. In a study by another group, Lactobacillus Hebraud and Potier 1999; Ponder et al. 2005), and enzymes delbrueckii were found to evolve greater FT tolerance after serial that inhibit or promote ice nucleation (Muryoi et al. 2004; propagation in milk with intermittent freezing and thawing Walker et al. 2006). In general, however, little is known about (Monnet et al. 2003). the timescale over which such changes have occurred, the num- We performed a pilot experiment to isolate cryotolerant mu- ber of mutations needed to allow survival starting from a FT- tants of E. coli that could better survive repeated freezing and sensitive progenitor, whether survival during freezing or re- thawing. The ancestor of the long-term experimental popula- covery on thawing is the more important target of selection, tions was subjected to daily FT cycles without added nutrients, and other such issues that can be explored by experimental but no viable cells remained after 40 d. Therefore, for this study evolution. we introduced a growth phase after the FT cycle to allow pop- Freezing and thawing are multifaceted stresses that involve ulations to recover and, potentially, to evolve. Elsewhere, we not only low temperature but also potentially lethal intracellular have also reported that 12 populations of E. coli that evolved
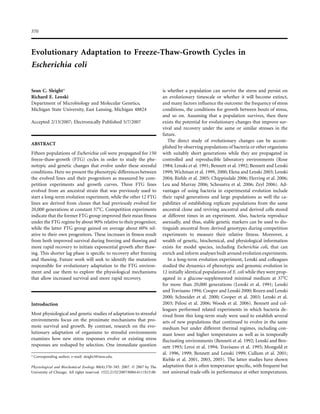
  • 3. 372 S. C. Sleight and R. E. Lenski in a minimal salts medium with glucose at 37 C for 20,000 FTG Evolution Experiment generations all became more sensitive to repeated FT cycles Figure 1 gives an overview of our FTG evolution experiment. than their ancestor, although the extent of this change varied The 15 FTG populations include three replicates, designated among the derived lines (Sleight et al. 2006). These findings group A, founded by the Ara variant of the original ancestor, demonstrate genetic variation in FT tolerance, and they also and 12 populations founded by clones sampled from each of indicate that some of the mutations responsible for improved the long-term populations at generation 20,000, designated fitness in that warm environment are detrimental under FT group B. These 15 populations evolved for 150 2-d FTG cycles, conditions. Also, because these lineages are preadapted to the which equals some 1,000 generations based on the 100-fold growth conditions at 37 C, they are interesting progenitors to dilution and regrowth in alternating days; in fact, somewhat start an evolution experiment under the freeze-thaw-growth more generations occurred because additional cell growth also (FTG) regime. We can compare the adaptation to the FTG offset death during the FT cycle in alternating days. To start regime of the 37 C-evolved lines and their progenitors with the evolution experiment, 1 mL of stationary phase DM25 cul- our a priori expectations that the 37 C-evolved lines have more ture was transferred into a freezer tube and put in a 80 C scope for improvement with respect to FT cycles but less op- freezer for 22.5 h. The tubes were then thawed at room tem- portunity to improve further during the growth phase. perature (∼22 C) for 1.5 h, after which time the contents were diluted 1 : 100 into fresh DM25 and incubated at 37 C without shaking for 24 h. The use of unshaken tubes, rather than shaken Material and Methods flasks, during the growth phase represents a small departure from the methods used in the long-term evolution experiment. Culture Media and Experimental Preconditioning This change allowed us to handle more cultures simultaneously. Any effect on oxygen levels is small, owing to the low sugar The bacterial clones used in our experiments, including those concentration used in our experiments and the resulting low evolved in our experiment as well as their progenitors, are kept population density (about 3–5 # 107 cells/mL in stationary in long-term storage at 80 C with glycerol added as a cryo- phase, roughly two orders of magnitude below the density in protectant. However, in the FTG evolution experiment and in most research with E. coli). In a previous study, there was no our assays of FT survival and relative fitness under the FTG discernible difference in relative fitness between shaken flasks regime, we used medium without added glycerol in order to and unshaken tubes under conditions similar to those used in investigate the evolution of changes in survival and recovery. our study (Travisano 1997). To ensure that cells were in comparable physiological states at Thus, the populations in our evolution experiment experi- the start of assays of FT survival and competitive fitness, cells enced cycles of a day of freezing and thawing that alternated were removed from the freezer, inoculated into Luria-Bertani medium independently for each replicate assay, and incubated at 37 C for 24 h; they were then diluted 10,000-fold into Davis minimal medium supplemented with glucose at 25 mg/L (DM25) and incubated at 37 C again for 24 h, at which point these cells were used to start all assays. Long-Term Evolution Experiment and Bacterial Strains The long-term evolution experiment at constant 37 C is de- scribed in detail elsewhere (Lenski et al. 1991; Lenski 2004). In brief, 12 replicate populations evolved for 20,000 generations (3,000 d) starting from two variants of the same ancestral strain of E. coli B. One variant (REL606) cannot grow on arabinose, Figure 1. Evolutionary histories of freeze-thaw-growth (FTG) popu- while the other (REL607) is a spontaneous Ara mutant; six lations. Three lines in FTG-evolved group A were founded by the populations were founded from each type. The Ara marker is ancestor of another evolution experiment. Twelve lines in FTG-evolved neutral in the long-term experimental environment (Lenski et group B were founded by clones sampled from populations that pre- al. 1991), which consists of daily 1 : 100 transfers into flasks viously evolved for 20,000 generations at 37 C. All 15 of the FTG lines evolved for 1,000 generations under the FTG regime, with alternating that contain DM25 and incubation with shaking at 37 C. The days of a FT cycle and growth at 37 C. The culture medium used for dilution and subsequent regrowth allow about 6.6 (plog2100) growth days was the same one used during the evolution of the pro- generations/d. genitors of FTG group B.
  • 4. Evolutionary Adaptation in Escherichia coli 373 with a day in which they grew in the same medium and at the Quantifying FTG Fitness and Its Components same temperature as in the long-term evolution experiment. For each replicate competition assay, we first calculated each Populations and clones were sampled and stored every 100 competitor’s realized (net) growth rate r over the 2-d FTG cycle generations (30 d) in freezer vials with glycerol for future study. as follows: During the long-term evolution experiment at 37 C, unique mutations were substituted at certain loci in each population (Woods et al. 2006); we confirmed by sequencing the presence of at least one such mutation in each group B line, which r p ln ( N2 # 100 N0 , ) demonstrates they were all derived from their intended pro- genitors (S. C. Sleight and R. E. Lenski, unpublished data). where N2 is that competitor’s final cell density, N0 is its initial cell density, and the factor of 100 takes into account the 100- fold dilution between the 2 d of the FTG cycle. The overall FTG fitness of one competitor relative to another is simply the ratio of their respective realized growth rates over the complete FTG Competition Experiments cycle. We also calculated each competitor’s FT survival s and sub- We performed competitions to measure the extent of evolu- sequent growth rate g over the two separate days of the FTG tionary adaptation of the FTG-evolved lines relative to their cycle as follows: progenitors. Competitions were performed in the exact same environment as used in the FTG evolution experiment. For N1 sp , group A, the FTG-evolved lines competed directly against the N0 ancestor with the opposite Ara marker state. For group B, the FTG-evolved lines and their 37 C-evolved progenitors each competed separately against the original ancestor bearing the g p ln ( N2 # 100 N1 ), opposite marker state. The densities of two competitors were estimated by serially where N1 is the viable cell density measured after the first day diluting cultures on tetrazolium-arabinose (TA) indicator of the cycle before the 100-fold dilution. Note that survival is plates, except for one FTG-evolved line and its progenitor that a proportion, whereas growth is a rate. In any case, the relative form poor colonies on TA medium and whose densities were survival and growth of two competitors are expressed as the estimated from minimal glucose plates. Plates were incubated ratio of the relevant parameters, so that they are dimensionless for 24 h at 37 C, and the resulting number of colony-forming quantities, as is the overall FTG fitness. units was used to estimate the corresponding density. The Ara All these quantities—relative fitness, relative survival, and and Ara cells form white and red colonies, respectively, when relative growth rate—were first calculated separately for each grown on TA plates. As a control for any effect of the Ara replicate assay. We then averaged the values from the replicate marker, the Ara and Ara ancestral variants also competed in assays to obtain the estimate for each line within a group. each batch of competition experiments; the Ara marker is neu- Finally, for each group, the overall means were calculated by tral in the FTG regime, as was shown under the growth con- averaging the estimates obtained for each line in the group, ditions of the long-term experiment. except in the case of the single ancestor of group A, where the Before starting a competition, each competitor was separately mean was based on the replicate assays. Details of the statistical conditioned as described previously. Equal volumes of each analyses are given in “Statistical Methods.” competitor were then mixed, and 1 mL was transferred into a tube and placed in a 80 C freezer. After 22.5 h, the tube was Growth Curves thawed at room temperature for 1.5 h. Then 0.1 mL was diluted into 9.9 mL of DM25 and incubated at 37 C for 24 h. Mea- We obtained separate growth curves, based on optical density surements of the densities of the competitors were taken at the (OD), for the evolved clones and their progenitors in order to start (before freezing), after thawing, and again after the growth estimate the durations of their lag phase before commencing phase that completes the full FTG cycle. From these data, we growth as well as their doubling times during the growth phase. estimated the relative fitness of the two competitors over the These growth parameters were first calculated for each line by course of the complete FTG cycle by using the initial and final averaging nine replicate growth trajectories for that line. Group samples, as described next. In addition, we partitioned the over- means were then calculated by averaging the estimates for each all FTG fitness into two components that reflect FT survival line in the group, except for the single ancestor of group A and subsequent growth by using the middle sample, also as whose parameters were estimated directly from the nine rep- described next. licates. OD measurements were made at the 420-nm wavelength
  • 5. 374 S. C. Sleight and R. E. Lenski on 0.2-mL cultures in 96-well microtiter plates incubated at 37 C. The data were collected following either an FT cycle or stationary phase at 37 C, with a comparison between the two curves permitting an estimate of the effect of the FT cycle on the time required to achieve exponential growth following di- lution into fresh DM25 medium, as described next. Calculations of Lag Phase Duration and Doubling Time Calculations of the duration of lag phase used the general method given by Lenski et al. (1994) with modifications as described here. OD values from growth curve experiments were standardized by dividing by the initial OD (measured imme- diately after the FT cycle before dilution and divided by 100 to take the dilution factor into account) and log2 transformed Figure 2. Schematic illustration showing how the apparent duration in order to express changes as doublings. The transformed data of lag phase is corrected for freeze-thaw (FT) survival to calculate the were then plotted and inspected to identify the window of actual duration of the physiological lag before growth. The apparent exponential growth, and linear regression was performed on duration is calculated by extrapolating the regression line based on those exponential-phase data. The doubling time was calculated exponential growth back to the initial optical density. In this hypo- as the inverse of the slope of the regression. The “apparent” thetical example, 50% of the cells survived the FT treatment; therefore, the initial density of viable cells is half that implied by the initial optical lag phase was then estimated by extrapolating the exponential density (log2 0.5 p 1). The actual duration of the physiological lag growth back in time until the regression intersected the initial is then obtained by extending the extrapolated growth trajectory until OD measurement (Fig. 2). Note, however, that this apparent it intersects the initial density of viable cells. lag phase does not take into account any contribution of dead cells to OD, so it overestimates the actual duration of the lag conservative. We used one-tailed tests for those hypotheses with phase. We corrected for this mortality by independently mea- clear a priori expectations about the direction of the outcome; suring the FT survival of the clone and then transforming the otherwise, two-tailed tests were used conservatively, including proportion surviving to a log2 scale; that proportion is generally those cases with potentially opposing effects. For example, we below 1, and hence the value is negative on a log scale, with expect overall fitness and its components to increase for all more negative values corresponding to higher mortality. As FTG-evolved lines when measured in the FTG environment. shown schematically in Figure 2, the log2-transformed survival We also expect the lines in group B, which previously evolved value was plotted as a horizontal line on the graphs showing in the same medium at 37 C and suffered correlated losses in the exponential-phase growth data, where the intersection of FT survival, to show less improvement in growth rate but this line with the extrapolated regression then provides an es- greater gains in FT survival than the lines in group A. timate of the actual duration of the physiological lag (i.e., the duration corrected for FT mortality). Results Evolutionary Adaptation to the FTG Regime Statistical Methods Figure 3 shows that the lines evolved under the FTG regime We performed t-tests to compare performance measures be- improved in their overall fitness when measured under that tween the FTG-evolved lines and their progenitors. Paired tests same regime. The three lines in group A increased their fitness, were always used when comparing B group–evolved lines with on average, by 89% relative to the ancestral strain. The 12 lines their progenitors, owing to their unique relationships. Paired in group B improved relative to their 37 C-evolved progenitors tests were also used to compare the A group–evolved lines with by 60%, on average. Notice that the progenitors of group B the common ancestor when the relevant assays for each evolved were themselves much more fit than the common ancestor line were paired with particular assays for the ancestor. Oth- under the FTG regime; this result indicates that their improve- erwise, we used a t-test for comparing a single specimen, the ments in growth during 20,000 generations at 37 C more than ancestor, with a sample, the three evolved group A lines (Sokal offset their losses in FT survival. The fitness gains in groups A and Rohlf 1981, pp. 229–231). This test assumes equal standard and B relative to their own progenitors were both significant deviations for the distributions from which the single specimen (one-tailed paired t-tests: group A, df p 2, P p 0.0034; group and the sample are drawn; in fact, the ancestor, being a ho- B, df p 11, P ! 0.0001). Also, the proportional gains in group mogenous type, should have a lower standard deviation than A, relative to their ancestor, were significantly greater than those the independently derived lines, which makes our inferences observed in group B, relative to their progenitors, during the
  • 6. Evolutionary Adaptation in Escherichia coli 375 values measured previously on the same generational samples (Cooper and Lenski 2000) in that benign environment (r p 0.1673, df p 10, two-tailed P p 0.6033). Although the me- dium per se is the same, the ancestral and FTG environments are so dissimilar overall that performance in one does not pre- dict performance in the other. However, we recently showed that while all the B progenitors have greater sensitivity to FT mortality than the common ancestor, the extent of their in- creased sensitivity was significantly correlated with their fitness gains in the benign environment (Sleight et al. 2006). Thus, prior adaptation by the B progenitors reduced the scope for adaptation to the growth period of the FTG regime while in- creasing potential adaptation to the FT treatment. The overall adaptation to the FTG regime can be partitioned into improvements in FT survival and subsequent growth per- Figure 3. Relative fitness of freeze-thaw-growth (FTG)-evolved groups formance. Figure 5A shows the changes in FT survival. Both A and B and their progenitors over the 2-d FTG cycle. For group A, each of the three evolved lines competed against the ancestor with the group A and group B lines survived freezing and thawing better opposite Ara marker state. For group B, each of the 12 evolved lines than their progenitors (one-tailed paired t-tests: group A, and their progenitors competed separately against the original ancestor df p 2, P p 0.0014; group B, df p 11, P p 0.0023). The im- with the opposite marker state. The mean value for each evolved group provement in survival was significantly greater in group B than (gray) is adjacent to the corresponding mean for its progenitors (white). in group A (one-tailed t-test with unequal variances, df p 13, Means for each group were calculated from the average values for each member in the group, except for the single ancestor of group A, where P p 0.0432), as expected given the higher initial mortality in the mean is based on six independent measurements. Error bars are B progenitors. The resulting final survival values did not differ 95% confidence intervals based on the number of independently significantly between groups A and B (two-tailed t-test with evolved lines, except for the ancestor, for which the interval is based unequal variances, df p 13 , P p 0.3691). Figure 5B shows the on the six replicate assays. corresponding changes in growth performance after an FT cycle and dilution into fresh medium. Both groups underwent sig- FTG evolution (two-tailed t-test with unequal variances, df p 13, P p 0.0417), although B had a final mean fitness that was significantly higher than that of A (two-tailed t-test with unequal variances, df p 13, P p 0.0003). Figure 4 illustrates the extent of variation among the 15 evolved lines and their progenitors in overall fitness under the FTG regime. The three group A lines improved to a similar extent, and their fitness gains were all highly significant (P ! 0.0001, based on one-tailed t-tests comparing six replicate assays for an evolved line and two assays for the ancestor that were paired with each evolved line). The group B lines showed much more variability, reflecting differences in their progenitors’ fit- ness as well as their subsequent gains. Eleven of the B lines improved significantly (all P ! 0.05 , based on one-tailed t-tests comparing six replicate assays for each evolved line with six replicate assays for its own progenitor), while the gain in line A 5 was not significant. The A 5 progenitor had the highest FT survival of all group B progenitors; therefore, it had less Figure 4. Relative fitness of the 15 freeze-thaw-growth (FTG)-evolved lines and their progenitors. Fitness values were measured in compe- scope to improve in this respect. tition with the common ancestor over the 2-d FTG cycle. Each evolved The fitness values for the B progenitors, which previously line (gray) is paired with its progenitor (white). The three group A evolved at constant 37 C for 20,000 generations, vary by about lines are shown with different ancestral replicates (designated A, B, twofold under the FTG regime (Fig. 4), whereas they vary much and C). The 12 group B lines were derived from long-term lines, less, although significantly, in the benign environment where designated A 1 to A 6, that previously evolved for 20,000 gener- ations at 37 C. Error bars show 95% confidence intervals based on six they evolved (Lenski et al. 1991; Lenski and Travisano 1994; replicate fitness assays for each line or progenitor, except for the group Cooper and Lenski 2000). There is no significant correlation A ancestor, where two of the replicate assays were paired with each of between the FTG fitness values measured here and the fitness the three evolved lines in that group.
  • 7. 376 S. C. Sleight and R. E. Lenski 20,000 generations, may be surprising at first glance. However, when we performed 1-d competitions in the same medium without an FT cycle, the evolved group B lines did not show any improvement in growth performance (S. C. Sleight and R. E. Lenski, unpublished data). As we will show next, their im- provement does not come from faster rates of exponential growth, but instead they evolved faster recovery of their growth capacity following the FT treatment. Changes in Growth Dynamics Including the Duration of Lag Phase Figure 6 shows the growth dynamics, based on OD, for both FTG-evolved groups and their progenitors under two slightly different conditions. In Figure 6A, the growth data correspond precisely to day 2 of the FTG regime, with cells having been frozen and thawed before their dilution into fresh medium at 37 C. In Figure 6B, the populations were started from stationary-phase cultures grown at 37 C without the interven- ing FT cycle. Several interesting features are apparent from the growth dynamics following the FT cycle (Fig. 6A). First, notice that both evolved groups (gray curves) increase much sooner than their respective progenitors (black curves). Second, the group B–evolved lines (solid gray curve) perform better, on average, than the group A lines (dashed gray curve), although the dif- ference is much less than between their progenitors (solid black, dashed black curves, respectively). Third, the improvement in group A (dashed gray curve) relative to their ancestor (dashed Figure 5. Decomposition of overall fitness gains under the freeze-thaw- black curve) appears to involve both earlier and faster growth. growth (FTG) regime into changes in freeze-thaw (FT) survival (A) and growth performance (B). All values were measured with, and are Now compare these dynamics with those observed without shown relative to, a marked variant of the common ancestor. FT sur- the intervening FT treatment (Fig. 6B). First, notice that all vival reflects changes in viable cell density during the first day of FTG four growth trajectories now rise earlier than before. These competitions. Growth performance reflects the net rate of increase on differences imply that some portion of the lags after the FT the second day after dilution into fresh medium. The mean for each treatment reflect demographic recovery, physiological recovery, evolved group (gray) is adjacent to the corresponding mean for its progenitors (white). Means for each group were calculated from average or both from that stress. Second, the trajectories for the group values for each member in the group, except for the single ancestor B lines and their progenitors (solid gray, solid black curves, of group A where the mean is based on six independent measurements. respectively) are almost perfectly superimposed. This similarity, Error bars are 95% confidence intervals based on the number of in- in contrast to the difference seen after the FT treatment, implies dependently evolved lines, except for the ancestor, for which the in- that the group B lines have adapted by accelerating their re- terval is based on the six replicate assays. covery from the stress. Third, the trajectories for group A and the ancestor (dashed gray, dashed black curves, respectively) are nificant improvement (one-tailed paired t-tests: group A, much closer than they were following the FT treatment. The df p 2, P p 0.0042; group B, df p 11, P ! 0.0001). The pro- remaining difference between them appears to reflect faster portional gain in growth performance was greater for group A growth by the evolved A lines rather than a shorter lag phase. than for group B (one-tailed t-test with unequal variances, After quantifying these differences, we will turn in the next df p 13, P p 0.0056), as expected given the higher initial level subsection to more intensive experiments to disentangle the for the group B progenitors. However, the final growth per- roles of demographic and physiological recovery from the FT formance was still higher in B than in A (two-tailed t-test with treatment. unequal variances, df p 13, P p 0.0001). For each FTG-evolved line and its progenitor, we calculated The fact that group B lines showed such large improvements its doubling time during exponential-phase growth and the in their growth performance in the second day of the FTG “apparent” lag duration (without adjusting for FT mortality), cycle, despite their progenitors having evolved at 37 C for as described in “Material and Methods.” Considering first the
  • 8. Figure 6. Growth dynamics of the freeze-thaw-growth–evolved lines and their progenitors following freeze-thaw treatment (A) and stationary phase at 37 C (B). Evolved group A and the ancestor are shown by dashed gray and dashed black curves, respectively. Evolved group B and progenitors are shown as solid gray and solid black curves, respectively. Each trajectory shows the mean calculated over all of the evolved lines or progenitors in a group, except for the single group A ancestor. In each case, the underlying trajectories were replicated ninefold for each evolved line or progenitor, including the group A ancestor.
  • 9. 378 S. C. Sleight and R. E. Lenski growth trajectories after the FT treatment (Fig. 6A), group A ological lag for that group A–evolved line and its ancestor. The lines evolved much faster exponential growth rates, with their ancestor (black symbols) had an apparent lag of 324 min, while mean doubling time almost 13 min shorter than that of the the apparent lag for the evolved line (gray symbols) was only ancestor (one-tailed P p 0.0075 using a t-test for comparing 155 min, the difference being 169 min. The physiological lags, a single specimen, the ancestor, with the three evolved group adjusted for cell mortality, were 282 min for the ancestor and A lines). The group A lines also dramatically shortened the 135 min for the evolved line. Thus, the physiological lag was mean duration of the apparent lag phase by 153 min relative reduced by 147 min during the evolution of this FTG-adapted to their ancestor (one-tailed P p 0.0066 , same test as above). line. The other 22 min of the difference in the duration of the By contrast, the group B lines, on average, did not evolve faster apparent lag reflects improved survival during the FT treatment. exponential growth than their progenitors, with the trend Figure 7B shows the same analysis for the group B–evolved slightly in the opposite direction (P 1 0.5 ). However, the B lines line and its own immediate progenitor, which evolved previ- also evolved a much faster transition into exponential growth, ously at 37 C for 20,000 generations. The apparent lag for this with the average duration of the apparent lag phase reduced evolved line was 76 min, while that of its progenitor was 192 by about 105 min (one-tailed paired t-test, df p 11, P p min, with the duration reduced during FTG evolution by 116 0.0001). min. After adjusting for mortality during freezing and thawing, Without the preceding FT cycle (Fig. 6B), group A lines again the physiological lags estimated for the evolved line and its showed faster exponential growth rates relative to those of their progenitor were 56 and 148 min, respectively, indicating that progenitors, with the average reduction in doubling time es- evolution had reduced the physiological lag by about 92 min timated to be about 9 min from these data (one-tailed P p in this group B line. 0.0058 using a t-test for comparing a single specimen with a Figure 8 shows the calculation of lag durations for the same group). However, the A lines did not evolve any shorter lag evolved lines and their progenitors, except in this case without phase under this treatment, with the observed trend in the an FT treatment before growth. There were no adjustments for opposite direction (P 1 0.5). Relative to their immediate pro- death, which does not occur at any measurable rate under these genitors, the group B lines did not improve, on average, in conditions (Vasi et al. 1994). For both evolved lines and their either their doubling time (one-tailed paired t-test, df p 11, progenitors, lag phase durations were shorter than those seen P p 0.3007) or the duration of the lag phase before growth, after an FT treatment. Moreover, the differences between the which trended very slightly in the opposite direction (P 1 0.5). FTG lines and their progenitors were much smaller, and in the group A case, the order was reversed. Without an FT treatment, the group A–evolved line had a lag duration of 84 min, whereas Demographic and Physiological Contributions to that of the ancestor was only 52 min (Fig. 8A). Notice, too, Shorter Lag Phases that this group A line evolved faster exponential-phase growth, The data in the previous subsection clearly show that the FTG- consistent with the shorter doubling times reported earlier for evolved bacteria evolved much shorter apparent lag phases and its group. The group B line showed no improvement in ex- that these changes were specific to the FT treatment. However, ponential growth rate, as expected given its progenitor’s prior these reductions in apparent lag phase do not distinguish be- evolution in the same medium and again consistent with earlier tween reduced cell death, such that population growth re- results (Fig. 8B). This group B progenitor experienced a lag of commenced from a higher level after the FT treatment, and 34 min without an FT treatment, while its FTG-evolved deriv- faster physiological recovery of surviving cells. To distinguish ative had a lag of 6 min. The resulting difference of 28 min is between these two effects, one must adjust the apparent lag much less than the 92-min difference in lag duration observed phase by taking into account mortality during the FT treatment. for the same B line and its progenitor after the FT treatment Recall Figure 2, which shows schematically how the actual du- (Fig. 7B). ration of the physiological lag phase is corrected for this FT These experiments demonstrate that greater survival during mortality. Whereas the apparent lag is calculated by extrapo- the FT treatment and faster physiological recovery of growth lating exponential growth back to the initial OD, which includes capacity both contributed to the improved fitness of lines that both living and dead cells, the actual lag is calculated by ex- evolved under the FTG regime. We obtained additional evi- trapolating back to the density of surviving cells only. dence for the evolution of faster physiological recovery in two To address this issue, we performed more intensive experi- subsidiary experiments (data not shown). First, we obtained ments, including growth trajectories and FT survival assays, for some population growth trajectories by plating and counting single representatives of each evolved group and their progen- cells rather than by combining measurements of ODs and cell itors. For group A, we used the middle of the three evolved survival. These experiments showed the faster recovery of lines and the common ancestor; for group B, we used the growth in the same two evolved lines relative to their progen- evolved line designated as A 1 and its progenitor (Fig. 4). itors. Second, we performed fluorescence microscopy at mul- Figure 7A shows the estimation of the duration of the physi- tiple times after an FT cycle in order to visualize actively di-
  • 10. Figure 7. Lag phases following the freeze-that treatment for two freeze-thaw-growth–evolved lines and their progenitors. A, group A–evolved line and the ancestor; B, group B–evolved line and its immediate progenitor. The evolved lines are shown as gray symbols and their progenitors as black symbols. The apparent duration of the lag phase is where the log-linear regression crosses the initial optical density (OD). The actual physiological duration occurs when the regression crosses the density adjusted for the proportion of surviving cells in the initial population, shown by the dashed horizontal lines. Growth trajectories and survival calculations are means of 27 replicate assays for each evolved line and progenitor.
  • 11. Figure 8. Lag phases following stationary phase at 37 C for two freeze-thaw-growth–evolved lines and their progenitors. A, group A–evolved line and the ancestor; B, group B–evolved line and its immediate progenitor. The evolved lines are shown as gray symbols and their progenitors as black symbols. The duration of the lag phase extends to where the log-linear regression crosses the initial optical density (OD); there is no appreciable mortality under this regime. Growth trajectories are means of 27 replicate assays for each evolved line and progenitor.
  • 12. Evolutionary Adaptation in Escherichia coli 381 viding cells. These observations revealed that cell division began duration of physiological lags following starvation with and much earlier in the FTG-evolved lines than in their progenitors, without the intervening FT treatment (Figs. 6–8). Both groups confirming the evolution of faster physiological recovery of of FTG-evolved lines showed much faster recovery of their growth capacity following this stressful treatment. surviving cells, with growth commencing 1 h or more sooner than it did in their progenitors. This accelerated recovery pro- Discussion vides a substantial head start during the subsequent exponential growth. We also performed fluorescence microscopy on pop- We performed an experiment to investigate the evolutionary ulations while they were recovering from the FT treatment; adaptation of 15 E. coli populations to 150 2-d cycles of freezing, these observations confirmed that many more viable cells were thawing, and growth. No glycerol or other cryoprotective com- in the process of doubling for the FTG-evolved lines than for pound was added before freezing, unlike the standard method their progenitors during the early recovery period. used to store bacteria. The entire experiment encompassed In addition to the differences in adaptation between the two more than 1,000 generations. Twelve of these FTG lines were groups of evolved lines, substantial variation also exists among founded by progenitors that had previously evolved for 20,000 lines in the same group, especially in the B group. The differ- generations in the same medium and at the same growth tem- ences in adaptation between groups A and B reflect differences perature of 37 C, except without the FT treatment between in their selective histories, but this explanation cannot explain reaching stationary phase and dilution in fresh medium (Fig. the striking diversity among the B lines (Fig. 4), which shared 1). The 37 C-evolved progenitors had higher growth rates than the same original ancestor and the same two-stage history (Fig. did the ancestor of the other three FTG lines, but these 37 C- 1). Evidently, the 12 lines in the B group, by chance, accu- evolved progenitors also suffered greater mortality during the mulated different sets of mutations that cause the differences FT treatment. in their performance. We do not know the identity of all those Almost all of the evolved lines showed large fitness gains in mutations. However, we can ask whether the variation among the FTG regime (Figs. 3, 4). We identified three distinct fitness them reflects, at least in part, heterogeneity that was already components that contributed to the improvement in overall present in their progenitors that diverged for 20,000 generations performance. First, both groups of the evolved lines exhibited at constant 37 C. In fact, there is a significant positive corre- substantial improvement in FT survival, although the magni- lation between the FTG fitness levels of the evolved B lines and tude of improvement was greater for the group B lines, whose their progenitors (r p 0.6769, df p 10, one-tailed P p progenitors had evolved in the same medium at constant 37 C 0.0079), indicating that some of the differential success among (Fig. 5A). During evolution in that benign environment, the the diverse B lines reflects variation in the extent of preadap- progenitors became more sensitive to FT mortality (Sleight et tation among their progenitors. However, it is also clear that al. 2006); hence, there was greater opportunity for better sur- most or all the B lines underwent substantial evolutionary ad- vival, and indeed this occurred. Second, the group A lines, aptation during the FTG experiment (Figs. 3, 4). With only whose progenitors had not experienced the same medium, one derived line from each progenitor, we cannot explicitly test evolved faster exponential-phase growth (Figs. 6–8). By con- whether the different B progenitors predisposed different final trast, the group B lines showed no measurable gains in their states (cf. Travisano et al. 1995). However, we might still ex- exponential growth (Figs. 6–8). Evidently, the B progenitors amine this issue in the future by finding the mutations that had largely exhausted the potential for faster exponential contribute to differences among the progenitors, finding other growth rate during their 20,000-generation history in the same mutations responsible for adaptation during the FTG evolution culture medium. experiment, and then systematically recombining these muta- Third, and perhaps most interesting, both groups showed tions from different lineages to ask whether the beneficial effects striking improvement in the speed of their physiological re- of the later mutations are conditional on or, alternatively, in- covery from FT stress. To demonstrate and quantify this third dependent of the earlier mutations. component of adaptation, we had to disentangle two con- Many more experiments remain to be done, of course, so founding effects. One such factor is mortality during the FT we will close by discussing briefly our ongoing research and cycle, which contributes to delayed recovery at the population future directions. In this study, we have demonstrated evolu- level but does not bear directly on the speed of recovery by tionary adaptation to the FTG regime, and we have partitioned surviving cells. We addressed this issue by independently mea- the improvement into three distinct fitness components—sur- suring FT mortality and using the data to calculate the phys- vival, recovery, and growth—but we have not yet identified the iological lag (Figs. 2, 7, 8). The second complication arises physiological, biochemical, and genetic bases of the improve- because physiological lags occur following starvation, even ments in organismal performance. One can imagine approach- without the FT treatment, on dilution into fresh medium. Thus, ing this general problem by beginning at a physiological scale one must distinguish between recovery from starvation and and working down toward the genetic level, or vice versa. The from freezing and thawing, which we did by measuring the approach that we are undertaking begins at the genetic level,
  • 13. 382 S. C. Sleight and R. E. Lenski which reflects our own expertise as well as the power of mo- Without giving away the results of future articles, we have lecular genetic analyses in bacteria. Once we have found some found two genes in which many FTG-evolved lines have sub- of the mutations responsible for the improved performance of stituted parallel mutations. Such parallelism is a hallmark of the FTG-evolved lines, we can explore the resulting biochemical adaptive evolution (Wichman et al. 1999; Cooper et al. 2003; and physiological mechanisms. By having gene identities in Woods et al. 2006). These genes and their products are in two hand, we can then target future studies to particular pathways different physiological pathways, one affecting membrane flu- based on the wealth of information that links the genetics, idity and the other encoding a stress response. We are currently biochemistry, and physiology of E. coli (Bock et al. 2006). ¨ attempting to construct isogenic strains that differ only by mu- There are several different genetic approaches that one could tations in these genes. We will then use these strains to analyze pursue to find mutations substituted in experimental popula- the effects of the mutations on the relevant pathways as well tions. These approaches include DNA fingerprinting methods as on the demographic and physiological components of sur- to find genes with new insertions or deletions (Papadopoulos vival and recovery that produce the evolutionary adaptation to et al. 1999; Schneider et al. 2000; Riehle et al. 2001), sequencing the FTG regime. candidate genes based on specific phenotypic changes or other prior information (Notley-McRobb and Ferenci 2000; Cooper et al. 2001; Crozat et al. 2005; Maharjan et al. 2006; Woods et Acknowledgments al. 2006), analyzing changes in gene-expression profiles to sug- gest additional candidates (Cooper et al. 2003; Riehle et al. This research was supported by a grant from the NASA As- 2003; Pelosi et al. 2006), and even whole-genome sequencing trobiology Institute to the Center for Genomic and Evolution- (Shendure et al. 2005; Herring et al. 2006; Velicer et al. 2006). ary Studies on Microbial Life at Low Temperature at Michigan Finding mutations, although certainly not trivial, is becom- State University. We thank Al Bennett, John Breznak, Tom ing much easier and less costly. But finding mutations is also Schmidt, Mike Thomashow, Jim Tiedje, and Tom Whittam for only a first step in the genetic analysis. An extremely important helpful comments and discussion; two reviewers for many con- subsequent step is to manipulate the affected gene, for example, structive suggestions; and Jim Hicks for organizing this special by constructing isogenic strains that differ by a single mutation issue on experimental evolution. (Cooper et al. 2001, 2003; Crozat et al. 2005; Pelosi et al. 2006). Such work is possible using powerful molecular genetic ap- proaches available in this system, but it is also painstaking and Literature Cited challenging work. Once such strains have been constructed, they can be competed to test whether a particular mutation Bakermans C., A.I. Tsapin, V. Souza-Eqipsy, D.A. Gilichinsky, did, in fact, contribute to the observed evolutionary adaptation and K.H. Nealson. 2003. Reproduction and metabolism at or, alternatively, merely hitchhiked and was inconsequential to 10 C of bacteria isolated from Siberian permafrost. Envi- any gains in performance. Of course, the same strains can also ron Microbiol 4:321–326. be used to examine changes in biochemical and physiological Bennett A.F. and R.E. Lenski. 1997. Phenotypic and evolution- traits, and the connections between genotype, phenotype, per- ary adaptation of a model bacterial system to stressful formance, and fitness can thus be elucidated. thermal environments. Pp. 135–154 in R. Bijlsma and V. There are many candidate biochemical and physiological Loeschcke, eds. Environmental Stress, Adaptation and Evo- pathways by which the FTG-evolved lines might have improved lution. Birkhauser, Basel. ¨ their FT survival as well as their subsequent recovery and tran- ———. 1999. Experimental evolution and its role in evolu- sition to growth. Some possibilities are altered induction of tionary physiology. Am Zool 39:346–362. stress responses, including molecular chaperones; better repair Bennett A.F., R.E. Lenski, and J.E. Mittler. 1992. Evolutionary of damage to DNA or other cell components; and regulatory adaptation to temperature. I. Fitness responses of Escherichia or structural changes affecting membrane fluidity, osmosis, coli to changes in its thermal environment. Evolution 46:16– DNA supercoiling, and ribosomes or other components of the 30. translational machinery. We are proceeding using a two- Bock A., R. Curtiss III, J.B. Kaper, F.C. Neidhardt, T. Nystrom, ¨ ¨ pronged approach. First, we have chosen a set of six candidate K.E. Rudd, and C.L. Squires, eds. 2006. Escherichia coli and genes of interest because of their known involvement in some Salmonella: Cellular and Molecular Biology. ASM, Washing- of the relevant pathways, and these genes are being sequenced ton, DC. Published online at http://www.ecosal.org. in the FTG-evolved lines and their progenitors. Second, we are Calcott P.H. 1985. Cryopreservation of microorganisms. CRC taking a genomic-fingerprinting approach to look for insertions Crit Rev Biotech 4:279–297. and deletions caused by the movement of insertion-sequence Calcott P.H. and A.M. Gargett. 1981. Mutagenicity of freezing elements that are native to E. coli genomes (Papadopoulos et and thawing. FEMS Microbiol Lett 10:151–155. al. 1999; Schneider et al. 2000, 2002; Cooper et al. 2001). Chippindale A. 2006. Experimental evolution. Pp. 482–501 in
  • 14. Evolutionary Adaptation in Escherichia coli 383 C.W. Fox and J.B. Wolf, eds. Evolutionary Genetics: Concepts and Environmental Stress. Oxford University Press, New and Case Studies. Oxford University Press, Oxford. York. Cloutier J., D. Prevost, P. Nadeau, and H. Antoun. 1992. Heat Lenski R.E. 2004. Phenotypic and genomic evolution during a and cold shock protein synthesis in arctic and temperate 20,000-generation experiment with the bacterium Escherichia strains of rhizobia. Appl Environ Microbiol 58:2846–2853. coli. Plant Breed Rev 24:225–265. Cooper T.F., D.E. Rozen, and R.E. Lenski. 2003. Parallel changes Lenski R.E. and A.F. Bennett. 1993. Evolutionary response of in gene expression after 20,000 generations of evolution in Escherichia coli to thermal stress. Am Nat 142(suppl.):S47– Escherichia coli. Proc Natl Acad Sci USA 100:1072–1077. S64. Cooper V.S. and R.E. Lenski. 2000. The population genetics of Lenski R.E., M.R. Rose, S.C. Simpson, and S.C. Tadler. 1991. ecological specialization in evolving E. coli populations. Na- Long-term experimental evolution in Escherichia coli. I. Ad- ture 407:736–739. aptation and divergence during 2,000 generations. Am Nat Cooper V.S., D. Schneider, M. Blot, and R.E. Lenski. 2001. 138:1315–1341. Mechanisms causing rapid and parallel losses of ribose ca- Lenski R.E., V. Souza, L.P. Duong, Q.G. Phan, T.N.M. Nguyen, tabolism in evolving populations of E. coli B. J Bacteriol 183: and K.P. Bertrand. 1994. Epistatic effects of promoter and 2834–2841. repressor functions of the Tn10 tetracycline-resistance op- Cox C.S. and R.J. Heckly. 1973. Effect of oxygen upon freeze- eron on the fitness of Escherichia coli. Mol Ecol 3:127–135. dried and freeze-thawed bacteria: viability and free radical Lenski R.E. and M. Travisano. 1994. Dynamics of adaptation production. Can J Microbiol 19:189–194. and diversification: a 10,000-generation experiment with Crozat E., N. Philippe, R.E. Lenski, J. Geiselmann, and D. bacterial populations. Proc Natl Acad Sci USA 91:6808–6814. Schneider. 2005. Long-term experimental evolution in Esch- Lenski R.E., C.L. Winkworth, and M.A. Riley. 2003. Rates of erichia coli. XII. DNA topology as a key target of selection. DNA sequence evolution in experimental populations of Genetics 169:523–532. Escherichia coli during 20,000 generations. J Mol Evol 56: Cullum A.J., A.F. Bennett, and R.E. Lenski. 2001. Evolutionary 498–508. adaptation to temperature. IX. Preadaptation to novel stress- Leroi A.M., R.E. Lenski, and A.F. Bennett. 1994. Evolutionary ful environments by E. coli adapted to high temperature. adaptation to temperature. III. Adaptation of Escherichia coli Evolution 55:2194–2202. to a temporally varying environment. Evolution 48:1222– Drouin P., D. Prevost, and H. Antoun. 2000. Physiological ad- 1229. aptation to low temperatures of strains of Rhizobium leg- Leu J.Y. and A.W. Murray. 2006. Experimental evolution of uminosarum bv. viciae associated with Lathyrus spp. FEMS mating discrimination in budding yeast. Curr Biol 16:280– Microb Ecol 32:111–120. 286. Elena S.F. and R.E. Lenski. 2003. Evolution experiments with Maharjan R., S. Seeto, L. Notley-McRobb, and T. Ferenci. 2006. microorganisms: the dynamics and genetic bases of adap- Clonal adaptive radiation in a constant environment. Science tation. Nat Rev Genet 4:457–469. 313:514–517. Eriksson M., J.O. Ka, and W.W. Mohn. 2001. Effects of low Mazur P. 1984. Freezing of living cells: mechanisms and im- temperature and freeze-thaw cycles on hydrocarbon biode- plications. Am J Physiol 16:C125–C142. gradation in arctic tundra soil. Appl Environ Microbiol 67: Mongold J.A., A.F. Bennett, and R.E. Lenski. 1996. Evolutionary 5107–5112. adaptation to temperature. IV. Adaptation of Escherichia coli Gao D. and J.K. Critser. 2000. Mechanisms of cryoinjury in at a niche boundary. Evolution 50:35–43. living cells. ILAR J 41:187–196. ———. 1999. Evolutionary adaptation to temperature. VII. Grecz N., T.L. Hammer, C.J. Robnett, and M.D. Long. 1980. Extension of the upper thermal limit of Escherichia coli. Evo- Freeze-thaw injury: evidence for double strand breaks in lution 53:386–394. Escherichia coli DNA. Biochem Biophys Res Commun 93: Monnet C., C. Beal, and G. Corrieu. 2003. Improvement of 1110–1113. the resistance of Lactobacillus delbrueckii ssp. bulgaricus to Hebraud M. and P. Potier. 1999. Cold shock response and low freezing by natural selection. J Dairy Sci 86:3048–3053. temperature adaptation in psychrotrophic bacteria. J Mol Mountfort D.O., H.F. Kaspar, R.A. Asher, and D. Sutherland. Microbiol Biotechnol 1:211–219. 2003. Influences of pond geochemistry, temperature, and Herring C.D., A. Raghunathan, C. Honisch, T. Patel, M.K. Ap- freeze-thaw on terminal anaerobic processes occurring in plebee, A.R. Joyce, T.J. Albert, et al. 2006. Comparative ge- sediments of six ponds of the McMurdo Ice Shelf, near Bra- nome sequencing of Escherichia coli allows observation of tina Island, Antarctica. Appl Environ Microbiol 69:583–592. bacterial evolution on a laboratory timescale. Nat Genet 38: Muryoi N., M. Sato, S. Kaneko, H. Kawahara, H. Obata, M.W. 1406–1412. Yaish, M. Griffith, and B.R. Glick. 2004. Cloning and ex- Hoffmann A.A. and P.A. Parsons. 1993. Evolutionary Genetics pression of afpA, a gene encoding an antifreeze protein from
  • 15. 384 S. C. Sleight and R. E. Lenski the arctic plant growth-promoting rhizobacterium Pseudo- coli. IX. Characterization of insertion sequence-mediated monas putida GR12–2. J Bacteriol 17:5661–5671. mutations and rearrangements. Genetics 156:477–488. Notley-McRobb L. and T. Ferenci. 2000. Experimental analysis Schneider D., E. Duperchy, J. Depeyrot, E. Coursange, R.E. of molecular events during mutational periodic selections in Lenski, and M. Blot. 2002. Genomic comparisons among bacterial evolution. Genetics 156:1493–1501. Escherichia coli strains B, K-12, and O157:H7 using IS ele- Panoff J.M., B. Thammavongs, and M. Gueguen. 2000. Cryo- ments as molecular markers. BMC Microbiol 2:18. protectants lead to phenotypic adaptation to freeze-thaw Schoustra S.E., A.J. Debets, M. Slakhorst, and R.F. Hoekstra. stress in Lactobacillus delbrueckii spp. bulgaricus CIP 101027T. 2006. Reducing the cost of resistance: experimental evolution Cryobiology 40:264–269. in the filamentous fungus Aspergillus nidulans. J Evol Biol Papadopoulos D., D. Schneider, J. Meier-Eiss, W. Arber, R.E. 19:1115–1127. Lenski, and M. Blot. 1999. Genomic evolution during a Shendure J., G.J. Porreca, N.B. Reppas, X. Lin, J.P. McCutcheon, 10,000-generation experiment with bacteria. Proc Natl Acad A.M. Rosenbaum, M.D. Wang, K. Zhang, R.D. Mitra, and Sci USA 96:3807–3812. G.M. Church. 2005. Accurate multiplex polony sequencing Parsons P.A. 1987. Evolutionary rates under environmental of an evolved bacterial genome. Science 309:1728–1732. stress. Pp. 311–347 in M.K. Hecht, B. Wallace, and G.T. Siddiqui K.S. and R. Cavicchioli. 2006. Cold-adapted enzymes. Prance, eds. Evolutionary Biology. Vol. 21. Plenum, New Annu Rev Biochem 75:403–433. York. Sleight S.C., N.S. Wigginton, and R.E. Lenski. 2006. Increased Pelosi L., L. Kuhn, D. Guetta, J. Garin, J. Geiselmann, R.E. ¨ susceptibility to repeated freeze-thaw cycles in Escherichia coli Lenski, and D. Schneider. 2006. Parallel changes in global following long-term evolution in a benign environment. protein profiles during long-term experimental evolution in BMC Evol Biol 6:104. Escherichia coli. Genetics 173:1851–1869. Sokal R.R. and F.J. Rohlf. 1981. Biometry. W.H. Freeman, New Ponder M.A., S.J. Gilmour, P.W. Bergholz, C.A. Mindock, R. York. Hollingsworth, M.F. Thomashow, and J.M. Tiedje. 2005. Souzu H., M. Sato, and T. Kojima. 1989. Changes in chemical Characterization of potential stress responses in ancient Si- structure and function in Escherichia coli cell membranes berian permafrost psychroactive bacteria. FEMS Microbiol caused by freezing and thawing. II. Membrane lipid state and Ecol 1:103–115. response of cells to dehydration. Biochim Biophys Acta 978: Queitsch C., T.A. Sangster, and S. Lindquist. 2002. Hsp90 as a 112–118. capacitor of phenotypic variation. Nature 417:618–624. Thammavongs B., D. Corroler, J.M. Panoff, Y. Auffray, and P. Riehle M.M., A.F. Bennett, R.E. Lenski, and A.D. Long. 2003. Boutibonnes. 1996. Physiological response of Enterococcus Evolutionary changes in heat-inducible gene expression in faecalis JH2-2 to cold shock: growth at low temperatures and lines of Escherichia coli adapted to high temperature. Physiol freezing/thawing challenge. Lett Appl Microbiol 23:398–402. Genom 14:47–58. Travisano M. 1997. Long-term experimental evolution in Esch- Riehle M.M., A.F. Bennett, and A.D. Long. 2001. Genetic ar- erichia coli. VI. Environmental constraints on adaptation and chitecture of thermal adaptation in Escherichia coli. Proc Natl divergence. Genetics 146:471–479. Acad Sci USA 98:525–530. ———. 2005. Changes in gene expression following high-tem- Travisano M., J.A. Mongold, A.F. Bennett, and R.E. Lenski. perature adaptation in experimentally evolved populations 1995. Experimental tests of the roles of adaptation, chance, of E. coli. Physiol Biochem Zool 78:299–315. and history in evolution. Science 267:87–90. Rivkina E.M., E.I. Friedmann, C.P. McKay, and D.A. Gili- Vasi F., M. Travisano, and R.E. Lenski. 1994. Long-term ex- chinksy. 2000. Metabolic activity of permafrost bacteria be- perimental evolution in Escherichia coli. II. Changes in life- low the freezing point. Appl Environ Microbiol 66:3230– history traits during adaptation to a seasonal environment. 3233. Am Nat 144:432–456. Rose M.R. 1984. Laboratory evolution of postponed senescence Velicer G.J., G. Raddatz, H. Keller, S. Deiss, C. Lanz, I. Din- in Drosophila melanogaster. Evolution 38:1004–1010. kelacker, and S.C. Schuster. 2006. Comprehensive mutation Rozen D.E. and R.E. Lenski. 2000. Long-term experimental identification in an evolved bacterial cooperator and its evolution in Escherichia coli. VIII. Dynamics of a balanced cheating ancestor. Proc Natl Acad Sci USA 103:8107–8112. polymorphism. Am Nat 155:24–35. Walker V.K., G.R. Palmer, and G. Voordouw. 2006. Freeze-thaw Russell N.J. 1990. Cold adaptation of microorganisms. Philos tolerance and clues to the winter survival of a soil com- Trans R Soc B 326:598–608. munity. Appl Environ Microbiol 72:1784–1792. Rutherford S.L. and S. Lindquist. 1998. Hsp90 as a capacitor Wichman H.A., M.R. Badgett, L.A. Scott, C.M. Boulianne, and for morphological evolution. Nature 396:336–342. J.J. Bull. 1999. Different trajectories of parallel evolution dur- Schneider D., E. Duperchy, E. Coursange, R.E. Lenski, and M. ing viral adaptation. Science 285:422–424. Blot. 2000. Long-term experimental evolution in Escherichia Wichman H.A., L.A. Scott, C.D. Yarber, and J.J. Bull. 2000.
  • 16. Evolutionary Adaptation in Escherichia coli 385 Experimental evolution recapitulates natural evolution. Phi- term experiment with Escherichia coli. Proc Natl Acad Sci los Trans R Soc B 355:1677–1684. USA 103:9107–9112. Woods R., D. Schneider, C.L. Winkworth, M.A. Riley, and R.E. Zeyl C. 2006. Experimental evolution with yeast. FEMS Yeast Lenski. 2006. Tests of parallel molecular evolution in a long- Res 6:685–691.