20090708 commodities in the if study undp comparative overview
•
0 gostou•360 visualizações


Recomendados
Recomendados
Mais conteúdo relacionado
Mais de Lichia Saner-Yiu
Mais de Lichia Saner-Yiu (20)
Último
Último (20)
20090708 commodities in the if study undp comparative overview
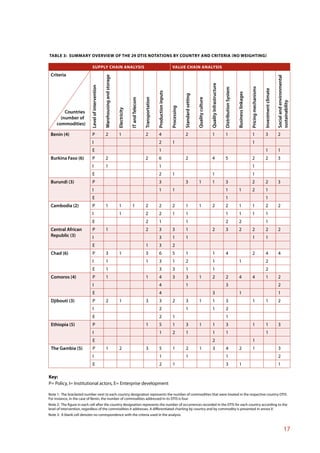
- 1. TABLE 3: SUMMARY OVERVIEW OF THE 29 DTIS NOTATIONS BY COUNTRY AND CRITERIA (NO WEIGHTING) SUPPLY CHAIN ANALYSIS VALUE CHAIN ANALYSIS Criteria Warehousing and storage Social and environmental Quality Infrastructure Level of intervention Pricing mechanisms Distribution System Investment climate Production inputs Business linkages Standard setting Transportation Quality culture IT and Telecom sustainability Processing Electricity Countries (number of commodities) Benin (4) P 2 1 2 4 2 1 1 1 3 2 I 2 1 1 E 1 1 1 Burkina Faso (6) P 2 2 6 2 4 5 2 2 3 I 1 1 1 E 2 1 1 1 Burundi (3) P 3 3 1 1 3 2 2 3 I 1 1 1 1 2 1 E 1 1 Cambodia (2) P 1 1 1 2 2 2 1 1 2 2 1 1 2 2 I 1 2 2 1 1 1 1 1 1 E 2 1 1 2 2 1 Central African P 1 2 3 3 1 2 3 2 2 2 2 Republic (3) I 3 1 1 1 1 E 1 3 2 Chad (6) P 3 1 3 6 5 1 1 4 2 4 4 I 1 1 3 1 2 1 1 2 E 1 3 3 1 1 2 Comoros (4) P 1 1 4 3 3 1 2 2 4 4 1 2 I 4 1 3 2 E 4 3 1 1 Djibouti (3) P 2 1 3 3 2 3 1 1 3 1 1 2 I 2 1 1 2 E 2 1 1 Ethiopia (5) P 1 5 1 3 1 1 3 1 1 3 I 1 2 1 1 1 1 E 2 1 The Gambia (5) P 1 2 3 5 1 2 1 3 4 2 1 3 I 1 1 1 2 E 2 1 3 1 1 Key: P= Policy, I= Institutional actors, E= Enterprise development Note 1: The bracketed number next to each country designation represents the number of commodities that were treated in the respective country DTIS. For instance, in the case of Benin, the number of commodities addressed in its DTIS is four. Note 2: The figure in each cell after the country designation represents the number of occurrences recorded in the DTIS for each country according to the level of intervention, regardless of the commodities it addresses. A differentiated charting by country and by commodity is presented in annex V. Note 3: A blank cell denotes no correspondence with the criteria used in the analysis. 17
- 2. SUPPLY CHAIN ANALYSIS VALUE CHAIN ANALYSIS Criteria Warehousing and storage Social and environmental Quality Infrastructure Level of intervention Pricing mechanisms Distribution System Investment climate Production inputs Business linkages Standard setting Transportation Quality culture IT and Telecom sustainability Processing Countries Electricity (number of commodities) Guinea (9) P 5 8 1 1 7 2 2 3 I 1 E 2 1 Lao PDR (2) P 1 2 2 1 1 2 1 2 2 I 1 1 1 E 1 1 1 Liberia (7) P 3 1 5 7 3 2 1 6 2 4 3 7 I 1 1 1 1 1 2 E 1 4 1 2 1 1 3 Madagascar(6) P 2 6 1 1 4 4 3 5 I 1 1 1 2 E 1 1 1 Malawi (6) P 1 6 1 4 2 1 6 2 3 2 4 I 1 4 1 2 1 2 E 3 2 1 Maldives (1) P 1 1 1 1 1 1 1 1 1 1 1 1 I 1 1 1 1 1 1 E 1 1 Mali (6) P 1 2 6 3 3 5 2 2 1 3 I 1 E 1 Mauritania (3) P 2 1 2 3 2 2 2 3 2 2 3 1 I 1 2 2 1 1 E 1 1 2 1 1 1 1 Mozambique (7) P 3 7 4 2 1 5 3 4 4 7 I 1 1 1 1 1 E 1 3 3 1 2 2 Nepal (1) P 1 1 1 1 1 1 1 I 1 1 1 E 1 Key: P= Policy, I= Institutional actors, E= Enterprise development Note 1: The bracketed number next to each country designation represents the number of commodities that were treated in the respective country DTIS. For instance, in the case of Benin, the number of commodities addressed in its DTIS is four. Note 2: The figure in each cell after the country designation represents the number of occurrences recorded in the DTIS for each country according to the level of intervention, regardless of the commodities it addresses. A differentiated charting by country and by commodity is presented in annex V. Note 3: A blank cell denotes no correspondence with the criteria used in the analysis. 18
- 3. SUPPLY CHAIN ANALYSIS VALUE CHAIN ANALYSIS Criteria Warehousing and storage Social and environmental Quality Infrastructure Level of intervention Pricing mechanisms Distribution System Investment climate Production inputs Business linkages Standard setting Transportation Quality culture IT and Telecom sustainability Processing Electricity Countries (number of commodities) Rwanda (2) P 1 1 1 2 1 1 1 2 1 2 1 2 I 1 1 1 E 1 1 São Tome e P 3 2 2 1 3 Príncipe (3) I 1 1 E 1 1 Senegal (4) P 2 1 3 4 3 3 2 2 3 2 2 3 I 2 1 1 1 1 1 1 1 E 2 1 1 2 3 Sierra Leone (10) P 1 2 8 7 2 2 2 7 2 1 1 2 I 1 3 1 1 1 E 3 3 1 2 Tanzania (7) P 1 2 7 3 2 3 2 7 4 3 2 6 I 4 2 2 2 3 2 E 2 5 4 1 3 1 Uganda (5) P 3 4 3 4 2 1 4 3 2 5 I 3 2 1 E 4 1 1 1 Vanuatu (7) P 7 4 3 2 4 2 1 5 I 1 1 1 1 1 E 6 1 1 2 Yemen (2) P 1 1 2 1 1 1 2 I 1 1 1 1 E 1 Zambia (6) P 1 5 2 1 1 6 1 1 1 5 I 2 1 2 1 2 E 2 1 Key: P= Policy, I= Institutional actors, E= Enterprise development Note 1: The bracketed number next to each country designation represents the number of commodities that were treated in the respective country DTIS. For instance, in the case of Benin, the number of commodities addressed in its DTIS is four. Note 2: The figure in each cell after the country designation represents the number of occurrences recorded in the DTIS for each country according to the level of intervention, regardless of the commodities it addresses. A differentiated charting by country and by commodity is presented in annex V. Note 3: A blank cell denotes no correspondence with the criteria used in the analysis. 19
- 4. Note: This publication has been made available by CSEND.org with the agrement of the author. The Centre for Socio-Eco-Nomic Development (CSEND) aims at promoting equitable, sustainable and integrated development through dialogue and institutional learning. Diplomacy Dialogue is a branch of the Centre for Socio-Eco-Nomic Development (CSEND), a non-profit R&D organization based in Geneva, Switzerland since 1993.