

Recomendados
Mais conteúdo relacionado
Destaque
Mais de Igor Bevzenko
Último
Último (20)
Get Research Resource
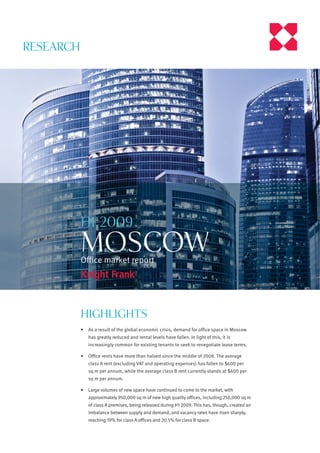
- 1. RESEARCH H1 2009 MOSCOW Office market report Highlights • As a result of the global economic crisis, demand for office space in Moscow has greatly reduced and rental levels have fallen. In light of this, it is increasingly common for existing tenants to seek to renegotiate lease terms. • Office rents have more than halved since the middle of 2008. The average class A rent (excluding VAT and operating expenses) has fallen to $600 per sq m per annum, while the average class B rent currently stands at $400 per sq m per annum. • Large volumes of new space have continued to come to the market, with approximately 950,000 sq m of new high quality offices, including 250,000 sq m of class A premises, being released during H1 2009. This has, though, created an imbalance between supply and demand, and vacancy rates have risen sharply, reaching 19% for class A offices and 20.5% for class B space.
- 2. H1 2009 MOSCOW Office market report Moscow City (Moscow International Business Center) 19 18 19 Complete 18 17 1st Krasnogvarde ysky proezd Partially 16a 16b 1 Complete 20 21 13 14 15 12 2009 11 Expocenter 8a 8b 7 6 2010 2 Under design 10 9 4 3 Kras Suspended nopr esnens kaya naberezhnaya Mosc ow River 0 Moscow City – developments Site Development Total size (sq m) Office component (sq m) Status Completion - Expocenter 85,000 - partially complete 2009 0 Tower 2000 61,067 50,000 complete 2002 1 Parking 170,101 - under construction 2010 2 Public Square and Moscow City Museum 19,000 - under construction 2010 3 City Palace Tower 169,000 80,000 under construction 2010 4 Imperia Tower 287,724 98,247 under construction 2010 6 Central Core Parking & Metro Terminal (Underground) 278,000 - under construction 2010 6 Central Core Public Complex 22,000 - under construction 2010 7-8b Mall of Russia 179,930 - under construction 2009 8a Multifunctional Recreation Complex 50,190 - under design n/a 9 Capital City Complex 288,680 72,315 partially complete 2009 10 Naberezhnaya Tower 254,000 150,000 complete 2007 11 Transport Terminal 228,000 122,450 suspended 12 Eurasia Tower 203,104 82,817 under construction 2010 13 Federation Complex 423,000 181,800 partially complete 2010 14 Mercury Office Tower 158,528 86,000 under construction 2010 15 Moscow Government Administrative Complex 636,330 n/a suspended 16a Multifunctional Office-Administrative Complex 249,600 122,500 suspended 16b Parking 180,000 - under design 2011 17-18 Russia Tower 565,000 140,000 suspended 19 Northern Tower 136,580 78,000 complete 2008 20 Multifunctional Business-Expo Complex 180,000 70,936 suspended 21 Yuri Dolgoruky n/a n/a under design 2011 Source: Knight Frank 2
- 3. www.KnightFrank.com www.KnightFrank.ru Moscow Fourth Transpo rt Key projects 2009 Ring completed under construction Class A 14 Class B+ Knight Frank is project consultant ay Highw 10 oye rovsk Dmit Greenwood ra (130,500 sq m) Prospekt Mi MirLand (75,000 sq m) Dvintsev 16 (58,000 sq m) Le ni ng ra Ring ds ky Third Transport ya S tr Av ka en vs 8 Str ue ko sa ya Monarch 8.1 Ru nue ka (192,800 sq m) Tv ds er Mira Ave sk bo ay r 12 Diamond Hall 8.2 St slo aS tr (61,500 sq m) ya na Novo rud Nordstar Tower nop White Square as (148,000 sq m) Garden Ring Domnikov Kr (74,000 sq m) 4 (132,000 sq m) 7 9.1 13 7.1 5 WTC, phase III 7.2 (70,000 sq m) Novy Arbat Str 1 ue Capital City, phase II en (52,700 sq m) ky Av 3 Entuziastov Highway ovs tuz Ku Legion III, stage II (46,000 sq m) Barkli Plaza (24,600 sq m) 9.2 17 Nizh 7.3 egorod skaya S Vo tr lg og ra 2 ds 7.4 en ue ky Av 9 Av en ue y Vivaldi Plaza sk (100,500 sq m) 9.3 Mytn ol om ue os aya S 6.1 en m 6 Av Ko ky tr ns ni 6.2 Le Nagatino i-Land 11 (216,900 sq m) 15 1. Central Business Districts 6. TTR South 8. TTR North 10. FTR North 2. GR South 6.1 Leninsky 8.1 Tverskoy-Novoslobodsky 11. FTR South 3. GR West 6.2 Tulsky 8.2 Prospekt Mira 12. FTR West 7. TTR West 9. TTR East 13. FTR East 4. GR North 7.1 Presnensky 9.1 Basmanny 14. MKAD North 5. GR East 15. MKAD South 7.2 City 9.2 Tagansky Borders of business districts 16. MKAD West 7.3 Kievsky 9.3 Volgogradsky Borders of subdistricts 17. MKAD East 7.4 Khamovniki GR = Garden Ring TTR = Third Transport Ring FTR = Fourth Transport Ring 3
- 4. Table 1 Moscow submarket data Transport Direction Sub Max prime Average Average Transport ring Stock Vacancy Transport ring district rent ($ per class A rent class B+ rent average rent (class A and rate ring vacancy sq m pa) ($ per sq m pa) ($ per sq m pa) ($ per sq m pa) B+) (sq m) rate 1 Boulevard Ring Centre CBD 1,100 850 700 800 590,400 19.3% 19.3% 2 Garden Ring South GRS 1,050 800 500 650 764,000 14.4% 12.1% 3 West GRW 850 750 700 533,300 5.8% 4 North GRN 850 700 650 609,000 10.3% 5 East GRE 850 700 550 217,400 24.7% 6.1 Third Transport Ring South LEN 800 700 600 600 132,200 12.9% 22.7% 6.2 South TUL 700 650 450 523,100 20.9% 7.1 West PRES 750 700 450 186,400 29.1% 7.2 West CITY 1,100 850 800 424,600 15.4% 7.3 West KIEV 820 650 550 196,200 40.2% 7.4 West KHAM 750 750 650 179,200 21.7% 8.1 North TV-NOV 1,000 750 550 609,700 26.9% 8.2 North PRM 650 600 550 289,600 6.3% 9.1 East BASM 650 - 400 401,300 21.0% 9.2 East TAG 900 750 550 248,000 13.7% 9.3 East VOLG 500 - 400 176.100 56.3% 10 Fourth Transport Ring North FTRN 500 500 400 450 464,300 27.7% 20.8% 11 South FTRS 550 500 425 685,700 20.8% 12 West FTRW 550 500 450 408,700 11.7% 13 East FTRE 550 - 425 363,400 29.6% 14 MKAD North MKADN 500 500 300 350 377,100 27.7% 26.5% 15 South MKADS 400 - 350 545,200 26.1% 16 West MKADW 500 400 350 703,800 17.1% 17 East MKADE 325 - 250 171,900 63.2% Total 550 9,800,600 20.3% Source: Knight Frank Table 2 Key occupier transactions, H1 2009 Company Acquired space (sq m) Address Property Class Quarter Lease GazpromTsentrRemont* 8,550 27, Obrucheva St. Gas Field B+ Q2 Holding MRSK 8,087 26, Ulansky ln. Office building B+ Q2 ABBYY 7,380 2-B, Otradnaya St. Otradny BC B+ Q2 KES Holding 5,296 7 km from MKAD, Novorijskoye Hw. Riga Land B+ Q2 Alcatel-Lucent 4,560 27, Elektrozavodskaya St. Le Fort B+ Q2 Russian Telephone Company 3,300 3/1, Begovaya St. NordStar Tower A Q2 First Insurance Company* 2,900 62/13, Sharikopodshipnikovskaya St. Novoostapovskiy B+ Q1 Diageo 1,850 7/1, Gasheka St. Ducat Place II A Q1 Purchase (owner occupation) Sberbank 55,000 12A, Yuzhnoportoviy 2nd Passage South Port B+ Q1 Inter RAO UES 30,000 27, Bolshaya Pirogovskaya St. Lootch B+ Q2 *Knight Frank acted as a consultant on the deal Source: Knight Frank 4
- 5. H1 2009 MOSCOW Office market report Figure 1 Figure 2 Average Class A rents Take-up vs Construction completions US$ per sq m per annum sq m (000s) 1,400 1,200 Take-up Construction completions 1,200 1,000 800 1,000 600 800 400 600 200 400 0 H1 H2 H1 H2 H1 H2 H1 H2 H1 H2 H1 H1 H2 H1 H2 H1 H2 H1 H2 H1 2004 2005 2006 2007 2008 2009 2005 2006 2007 2008 2009 Vivaldi Plaza Source: Knight Frank Source: Knight Frank Figure 3 Figure 4 Figure 5 Class A vacancy rate Class A rents by submarket Distribution of total office stock % US$ per sq m per annum sq m (000s) 20 1,000 3,000 800 15 2,000 600 10 400 1,000 5 200 0 0 0 H1 H2 H1 H2 H1 H2 H1 H2 H1 H2 H1 BR GR Moscow TTR* FTR MKAD BR GR Moscow- TTR* FTR MKAD 2004 2005 2006 2007 2008 2009 -City City Source: Knight Frank Source: Knight Frank Source: Knight Frank * Excluding Moscow-City * Excluding Moscow-City Figure 6 Figure 7 Vacancy rates by submarket** Prime office yields % % 30 15 25 20 12 15 10 9 5 0 6 BR GR Moscow- TTR* FTR MKAD H1 H2 H1 H2 H1 H2 H1 H2 H1 City 2005 2006 2007 2008 2009 Nagatino i-Land Source: Knight Frank Source: Knight Frank * Excluding Moscow-City ** Based on Class A and Class B properties 5
- 6. RESEARCH Americas Moscow London USA Kyrill Starodoubtsev Chris Bell Bermuda Director – Office Head Managing Director, Europe Brazil +7 (495) 981 0000 +44 (0)20 7629 8171 Caribbean kyrill.starodoubtsev@ru.knightfrank.com chris.bell@knightfrank.com Chile Maria Kotova Joe Simpson Australasia Executive Director Partner, International Research Australia +7 (495) 981 0000 +44 (0)20 7629 8171 New Zealand maria.kotova@ru.knightfrank.com joe.simpson@knightfrank.com Europe Natalia Sazonova Matthew Colbourne UK Head of Research Senior Analyst Belgium +7 (495) 981 0000 +44 (0)20 7629 8171 Czech Republic natalia.sazonova@ru.knightfrank.com matthew.colbourne@knightfrank.com France Germany Hungary Ireland Italy Monaco Poland Portugal Romania Russia Spain The Netherlands Ukraine Africa Botswana Kenya Malawi Nigeria South Africa Tanzania Uganda Knight Frank Research provides strategic advice, consultancy services and forecasting Zambia to a wide range of clients worldwide including developers, investors, funding Zimbabwe organisations, corporate institutions and the public sector. All our clients recognise Asia the need for expert independent advice customised to their specific needs. Cambodia China Knight Frank Research Reports are also available at KnightFrank.com Hong Kong India Indonesia © Knight Frank LLP 2009 Macau This report is published for general information only. Although high standards have been used in the Malaysia preparation of the information, analysis, views and projections presented in this report, no legal responsibility can be accepted by Knight Frank Research or Knight Frank LLP for any loss or damage resultant from the Singapore contents of this document. As a general report, this material does not necessarily represent the view of Thailand Knight Frank LLP in relation to particular properties or projects. Reproduction of this report in whole or in part Vietnam is allowed with proper reference to Knight Frank Research. The Gulf Knight Frank LLP is a limited liability partnership registered in England with registered number OC305934. Bahrain Our registered office is 55 Baker Street, London, W1U 8AN, where you may look at a list of members’ names.