SlideShare uma empresa Scribd logo
1 de 13
Baixar para ler offline
Q2 2011 | OFFICE


NORTH AMERICA


HIGHLIGHTS


                                               Demand for Office Space Still Subdued,
                                               But Q2 Better than Q1
                                               ROSS J. MOORE Chief Economist | USA
MARKET INDICATORS
Relative to prior period                       The U.S. office market staged a modest rebound in the second quarter with stronger demand for
                                               space and a slight drop in vacancy. The much anticipated recovery in the U.S. office market, however,
                            Q2       Q3
                           2011     2011*      remains relatively restrained. Rents continued to languish as both downtown and suburban markets
                                               registered small decreases. With only modest economic growth in the first half of the year and em-
           VACANCY                             ployment showing disappointing gains, the outlook for the office space market is far from certain.

  NET ABSORPTION
                                               By comparison, Canadian markets enjoyed another reasonably good quarter on the back of a more
    CONSTRUCTION                               robust economy and a healthier labor market. Both U.S. and Canadian economies are expected to
                                               strengthen in the second half of 2011, but projections made at the outset now appear overly optimis-
      RENTAL RATE                              tic. Given the sudden stall in job creation and continued high energy costs, the office market now
                                               faces a fairly stiff headwind that will likely put a damper on corporate expansion and add to inflation
                                  *Projected
                                               concerns.

                                               Second-quarter data shows the U.S. office market recovery will continue to be uneven in nature and
                                               fairly volatile. New York, Washington, San Francisco and Seattle are the clear leaders in terms of
U.S. OFFICE MARKET                             demand; yet Boston, Dallas, Denver, Houston, Philadelphia, Raleigh, San Diego, San Jose, and West
SUMMARY STATISTICS, Q2 2011                    Los Angeles are all seeing modest gains in occupancy. Also somewhat positive is the seventeen-
                                               month-long gain in private-sector employment. Furthermore, office-using employment was reason-
Vacancy Rate: 15.28%
 Change from Q1 2011: –0.12                                                                                                                                     continued on page 6
                                                U.S. OFFICE MARKET Q2 2009 – Q2 2011
Absorption:
9.9 Million Square Feet                                                35                                                              15.8                 After peaking in early
                                                                                                                                       15.6                 2010, the nation’s
New Construction:                                                      25
                                                                                                                                                            office vacancy rate
                                                 Million Square Feet


                                                                                                                                       15.4
3.9 Million Square Feet                                                 15                                                                                  has gradually
                                                                                                                                       15.2
                                                                                                                                              Vacancy (%)


                                                                        5                                                                                   declined as the
Under Construction:                                                                                                                    15.0
                                                                                                                                                            development pipeline
39.4 Million Square Feet                                                -5                                                             14.8
                                                                                                                                                            has emptied, and
                                                                                                                                       14.6                 demand has slowly
                                                                       -15
Asking Rents Per Square Foot                                                                                                           14.4                 ramped up.
 (Change from Q1 2011):                                                -25                                                             14.2
Downtown Class A: $38.98 (-1.4%)                                       -35                                                             14.0
Suburban Class A: $26.03 (-0.7%)                                              Q2    Q3   Q4       Q1    Q2    Q3     Q4    Q1    Q2
                                                                             2009                      2010                     2011
                                                                                     Absorption        Completions        Vacancy


WWW.COLLIERS.COM
HIGHLIGHTS | Q2 2011 | OFFICE | NORTH AMERICA


 UNITED STATES | DOWNTOWN OFFICE | ALL INVENTORY

                                          EXISTING      NEW SUPPLY   NEW SUPPLY    UNDER      VACANCY        VACANCY     ABSORPTION   ABSORPTION
                                       INVENTORY (SF)     Q2 2011     YTD 2011  CONSTRUCTION  RATE (%)       RATE (%)      Q2 2011     YTD 2011
 MARKET                                 JUNE 30, 2011      (SF)         (SF)        (SF)     MAR. 31, 2011 JUNE 30, 2011    (SF)         (SF)

 NORTHEAST

 Baltimore, MD                            41,959,000            0        28,000           0       14.19       14.19         21,000       171,000

 Boston, MA                               60,233,000        50,000            0    1,810,000      16.58       16.34        181,000       146,000

 Hartford, CT                              9,628,000            0             0     180,000       22.76       23.98        (64,000)     (55,000)

 New York, NY – Downtown Manhattan       109,357,000            0             0   13,685,000      14.07       12.55       1,664,000    1,829,000

 New York, NY – Midtown Manhattan        228,627,000            0             0    1,876,000      12.31       11.98        768,000       668,000

 New York, NY – Midtown S. Manhattan     167,392,000            0             0           0        9.43         8.83      1,003,000    1,200,000

 Philadelphia, PA                         42,739,000            0             0           0       12.07       12.06          5,000       120,000

 Pittsburgh, PA                           33,146,000            0             0           0       11.82       11.34        116,000       193,000

 Stamford, CT                             18,798,000            0             0           0       18.68       17.45        334,000       578,000

 Washington, DC                          142,039,000            0       573,000    1,262,000      11.08       10.53        697,000     1,356,000

 White Plains, NY                         14,071,000            0             0           0       15.33       15.90        (32,000)       22,000

 NORTHEAST TOTAL/AVERAGE                867,988,000        50,000      601,000    18,813,000      12.44       11.91      4,693,000     6,228,000
 SOUTH

 Atlanta, GA                              48,889,000            0             0           0       17.93       17.89         18,000     (409,000)

 Charleston, SC                            1,995,000            0             0           0       10.15         9.49        13,000         9,000

 Charlotte, NC                            22,164,000            0             0           0       11.25       11.59        (69,000)      329,000

 Columbia, SC                              5,028,000            0             0           0       21.78       23.81        (48,000)      (2,000)

 Dallas/Fort Worth, TX                    46,212,000            0             0           0       22.46       23.12       (304,000)    (261,000)

 Ft. Lauderdale/Broward Co., FL            8,236,000            0             0           0       17.48       17.33         12,000      (47,000)

 Greenville, SC                            3,184,000            0             0           0       18.81       18.35         15,000         7,000

 Houston, TX                              37,642,000       845,000    1,817,000           0       16.37       16.04         20,000         6,000

 Jacksonville, FL                         15,973,000            0             0           0       13.85       13.06         89,000       102,000

 Little Rock, AR                           6,538,000      (39,000)     (39,000)           0       15.76       16.29        (29,000)     (29,000)

 Louisville, KY                           16,253,000            0             0       80,000      10.49       10.33         26,000         6,000

 Memphis, TN                               7,869,000            0             0           0       19.03       19.28        (20,000)     (32,000)

 Miami-Dade, FL                           17,485,000            0             0     615,000       20.43       19.56        153,000       225,000

 Nashville, TN                             7,857,000            0             0       90,000      22.23       22.30         32,000        83,000

 Orlando, FL                              12,605,000            0       105,000           0       13.49       14.30       (102,000)      (7,000)

 Raleigh/Durham/Chapel Hill, NC           11,472,000            0             0     324,000        6.30         6.62       (37,000)     (54,000)

 Savannah, GA                                747,000            0             0       70,000      16.34       15.26          9,000         7,000

 Tampa, FL                                 8,595,000            0             0           0       15.62       15.35         23,000        96,000

 West Palm Beach/Palm Beach Co., FL       10,148,000            0             0           0       19.58       19.30         29,000        41,000

 SOUTH TOTAL/AVERAGE                    288,891,000       806,000     1,884,000    1,179,000      16.88       16.93      (170,000)       70,000


P. 2   | COLLIERS INTERNATIONAL
HIGHLIGHTS | Q2 2011 | OFFICE | NORTH AMERICA


UNITED STATES | DOWNTOWN OFFICE | ALL INVENTORY

                                     EXISTING      NEW SUPPLY   NEW SUPPLY    UNDER      VACANCY        VACANCY     ABSORPTION   ABSORPTION
                                  INVENTORY (SF)     Q2 2011     YTD 2011  CONSTRUCTION  RATE (%)       RATE (%)      Q2 2011     YTD 2011
MARKET                             JUNE 30, 2011      (SF)         (SF)        (SF)     MAR. 31, 2011 JUNE 30, 2011    (SF)         (SF)

MIDWEST

Chicago, IL                         158,464,000            0             0           0       14.83       14.53        473,000       560,000
Cincinnati, OH                       19,342,000            0       805,000           0       18.93       18.96         (6,000)      116,000
Cleveland, OH                        34,223,000            0             0     475,000       19.64       19.38        (68,000)    (335,000)
Columbus, OH                         19,091,000            0             0           0       11.58       11.49         16,000        74,000
Detroit, MI                          31,147,000            0             0           0       18.46       17.82        257,000       293,000
Grand Rapids, MI                      5,404,000            0             0           0       24.63       23.87         17,000        24,000
Indianapolis, IN                     70,827,000            0        23,000           0       11.43       10.69        528,000       417,000
Kansas City, MO-KS                   34,342,000            0             0           0       13.23       13.65       (141,000)       66,000
Minneapolis, MN                      30,731,000            0             0           0       16.61       15.24        440,000       353,000
Omaha, NE                             6,747,000            0             0           0        7.44         8.98       (49,000)     (59,000)
St. Louis, MO                        27,203,000        61,000       61,000     363,000       17.97       18.46       (127,000)    (320,000)
St Paul, MN                          10,166,000            0             0           0       14.87       14.85          1,000      (55,000)
MIDWEST TOTAL/AVERAGE              447,688,000        61,000      890,000      838,000       15.15       14.84      1,341,000     1,135,000
WEST

Bakersfield, CA                       2,986,000            0             0           0        9.97       10.03         (2,000)       28,000
Boise, ID                             3,473,000            0             0           0       11.70       11.62          3,000        11,000
Denver, CO                           30,979,000            0             0     270,000       13.89       14.14        (77,000)     (33,000)
Fresno, CA                            3,263,000            0             0           0       12.14       11.29         28,000         5,000
Honolulu, HI                          8,074,000            0             0           0       12.08       12.35        (22,000)      (5,000)
Las Vegas, NV                         3,860,000            0             0     300,000       12.79       13.77        (37,000)     (33,000)
Los Angeles, CA                      33,368,000            0             0           0       17.44       18.59       (384,000)    (446,000)
Oakland, CA                          16,892,000            0             0     659,000       12.39       12.39              0      (40,000)
Phoenix, AZ                          19,500,000            0             0           0       21.82       21.20        121,000      (61,000)
Pleasanton/Walnut Creek, CA          12,273,000            0             0           0       17.06       19.80       (337,000)    (379,000)
Portland, OR                         33,649,000            0             0     195,000        8.82         8.94       (41,000)       37,000
Reno, NV                              1,326,000            0             0           0       28.05       22.91         68,000        44,000
Sacramento, CA                       18,239,000            0             0     155,000       10.40       10.59        (35,000)     (82,000)
San Diego County, CA                 10,252,000            0             0           0       20.53       20.55         (2,000)    (119,000)
San Francisco, CA                    85,635,000            0             0     288,000       14.22       13.51        560,000     1,047,000
San Jose/Silicon Valley, CA           7,593,000            0             0           0       25.34       24.12         44,000      (90,000)
Seattle/Puget Sound, WA              58,346,000       600,000    1,446,000     497,000       16.46       15.01        743,000       463,000
Stockton/San Joaquin County, CA       8,345,000            0             0           0       19.49       18.95         45,000      (39,000)
WEST TOTAL/AVERAGE                 358,052,000       600,000     1,446,000    2,365,000      15.02       14.78        676,000      309,000
U.S. TOTAL/AVERAGE                1,962,619,000     1,518,000    4,821,000   23,194,000      14.18       13.84      6,539,000     7,741,000


                                                                                                           COLLIERS INTERNATIONAL |     P. 3
HIGHLIGHTS | Q2 2011 | OFFICE | NORTH AMERICA


 UNITED STATES | DOWNTOWN OFFICE | CLASS A

                                                                                                              AVERAGE ANNUAL QUARTERLY   ANNUAL
                                          EXISTING       VACANCY        VACANCY     ABSORPTION   ABSORPTION     QUOTED RENT   CHANGE IN CHANGE IN
                                       INVENTORY (SF)    RATE (%)       RATE (%)      Q2 2011     YTD 2011       (USD PDF)      RENT      RENT
 MARKET                                 JUNE 30, 2011   MAR. 31, 2011 JUNE 30, 2011    (SF)         (SF)        JUNE 30, 2011    (%)       (%)

 NORTHEAST

 Baltimore, MD                            15,753,000       18.50        19.00        (79,000)       86,000        24.10         -4.5      -0.5

 Boston, MA                               41,218,000       16.05        15.81        139,000        13,000        45.60         -0.5       0.3

 Hartford, CT                               6,383,000      22.44        22.13         12,000        16,000        23.00          0.1      -1.0

 New York, NY – Downtown Manhattan        75,928,000       15.21        14.42      1,647,000     2,054,000        37.70         -2.1      -2.3

 New York, NY – Midtown Manhattan        193,066,000       13.08        12.86        427,000        97,000        64.40          1.7       2.6

 New York, NY – Midtown S. Manhattan      33,457,000        9.55         8.94        204,000       807,000        47.90          1.2       9.3

 Philadelphia, PA                         32,897,000       11.82        11.71         35,000       142,000        26.10         -0.1       0.0

 Pittsburgh, PA                           17,542,000        9.25         8.41        147,000       178,000        21.70           –          –

 Stamford, CT                             12,899,000       18.83        17.01        105,000        87,000        37.60         -2.6       1.5

 Washington, DC                           82,854,000       13.81        12.55        898,000     1,675,000        55.20          4.3       7.7

 White Plains, NY                           9,045,000      16.32        16.74         26,000     (361,000)        30.20          0.7         –

 NORTHEAST TOTAL/AVERAGE                 521,043,000       13.78        13.27      3,562,000     4,793,000        49.66
 SOUTH

 Atlanta, GA                              28,893,000       20.07        20.20        (37,000)      254,000        22.50         -1.2       2.7

 Charleston, SC                             1,102,000       7.59         6.83          8,000        28,000        29.00          0.9      19.8

 Charlotte, NC                            16,112,000       12.87        13.27        (61,000)      341,000        24.20          0.7      -8.9

 Columbia, SC                               2,005,000      15.38        17.30        (10,000)       (8,000)       19.50          0.1      -0.9

 Dallas/Fort Worth, TX                    28,005,000       19.39        20.11      (202,000)     (214,000)        25.30          0.0       0.0

 Ft. Lauderdale/Broward Co., FL             4,464,000      25.35        25.26          4,000       (39,000)       31.80         -1.1      -3.1

 Greenville, SC                             1,916,000       7.59        11.46        (17,000)       (5,000)       20.30         -1.3      -1.0

 Houston, TX                              26,964,000       12.97        12.53         32,000        (1,000)       34.20         -0.1      -4.8

 Jacksonville, FL                           6,685,000      14.96        15.59        (73,000)      (61,000)       19.80          4.8      -0.9

 Little Rock, AR                            2,636,000      11.40        12.22        (22,000)      (19,000)       15.50         -6.9      -6.4

 Louisville, KY                             3,956,000       8.83         9.05         (2,000)       50,000        21.00          2.8      -5.3

 Memphis, TN                                1,938,000      26.09        27.31        (24,000)      (25,000)       16.70         -4.0      -2.2

 Miami-Dade, FL                             9,058,000      23.42        22.26        105,000       171,000        41.20         -0.7      -2.0

 Nashville, TN                              3,845,000      22.87        23.71         13,000        37,000        21.90         -3.3      -1.7

 Orlando, FL                                5,674,000      17.18        19.04      (106,000)        (3,000)       24.10          5.1      -0.9

 Raleigh/Durham/Chapel Hill, NC             4,597,000       8.39         9.17        (36,000)      (56,000)       21.70         -9.8      -4.6

 Savannah, GA                                570,000       13.14        11.99          6,000        (1,000)       18.90           –          –

 Tampa, FL                                  4,809,000      16.59        16.82        (11,000)      (79,000)       22.70          0.7      -0.5

 West Palm Beach/Palm Beach Co., FL         3,379,000      23.10        22.71         13,000         9,000        37.20          0.9      -0.9

 SOUTH TOTAL/AVERAGE                     156,609,000       17.03        17.29      (421,000)       380,000        26.48


P. 4   | COLLIERS INTERNATIONAL
HIGHLIGHTS | Q2 2011 | OFFICE | NORTH AMERICA


UNITED STATES | DOWNTOWN OFFICE | CLASS A

                                                                                                         AVERAGE ANNUAL QUARTERLY   ANNUAL
                                     EXISTING       VACANCY        VACANCY     ABSORPTION   ABSORPTION     QUOTED RENT   CHANGE IN CHANGE IN
                                  INVENTORY (SF)    RATE (%)       RATE (%)      Q2 2011     YTD 2011       (USD PDF)      RENT      RENT
MARKET                             JUNE 30, 2011   MAR. 31, 2011 JUNE 30, 2011    (SF)         (SF)        JUNE 30, 2011    (%)       (%)

MIDWEST

Chicago, IL                          60,487,000       15.84        15.70         84,000       115,000        33.00                1.5      3.1
Cincinnati, OH                         8,867,000      22.34        19.23        275,000       238,000        23.20                8.7      6.2
Cleveland, OH                          9,728,000      13.73        13.71        (25,000)      (90,000)       20.70               -2.0      0.2
Columbus, OH                           7,840,000      13.01        13.43        (32,000)      (28,000)       19.00               -1.1     -7.2
Detroit, MI                          11,468,000       17.31        14.83        285,000       286,000        22.60               -1.9     -0.2
Grand Rapids, MI                       1,525,000      18.81        18.02              0         5,000        19.90              -10.0    -16.6
Indianapolis, IN                       9,395,000      14.04        12.66        130,000        71,000        19.10               -0.4       –
Kansas City, MO-KS                   10,473,000       17.72        17.90        (19,000)      183,000        19.50               -0.1     -6.7
Minneapolis, MN                      13,826,000       13.91        13.34         44,000        54,000        14.60               -3.4     -5.0
Omaha, NE                              3,418,000       3.88         4.32          5,000       (25,000)       18.80                 –        –
St. Louis, MO                        10,481,000       14.84        14.73         20,000       (38,000)       18.00               -2.9     -6.9
St. Paul, MN                           3,073,000       9.54         9.90        (11,000)       16,000        14.20               -0.7      1.4
MIDWEST TOTAL/AVERAGE               150,580,000       15.45        14.92        756,000       787,000        24.73
WEST

Bakersfield, CA                         670,000        6.28         5.75          4,000         4,000        17.40                0.0      0.0
Boise, ID                              2,038,000       4.69         5.75        (22,000)      (13,000)       18.00                0.0      0.0
Denver, CO                           19,243,000       12.64        12.64         31,000       123,000        27.50                1.7      3.7
Fresno, CA                             1,039,000      11.83        11.28          6,000       (18,000)       24.60                0.0      0.0
Honolulu, HI                           4,709,000      12.62        13.27        (31,000)      (48,000)       35.40                1.0     -1.3
Las Vegas, NV                           808,000        8.95        11.26        (14,000)      (14,000)       32.30               -7.2     -7.5
Los Angeles, CA                      17,734,000       14.15        15.92      (313,000)     (218,000)        38.50                0.0     -0.9
Oakland, CA                          10,198,000        9.93        10.49        (57,000)      (55,000)       30.70               -1.5     -0.8
Phoenix, AZ                            9,536,000      22.49        22.30         18,000       (67,000)       23.90               -0.7     -6.6
Pleasanton/Walnut Creek, CA            7,950,000      18.57        19.36        (63,000)      (76,000)       26.20               -5.2     -0.5
Portland, OR                         13,094,000        6.96         6.81         20,000       150,000        24.80               -2.4      2.4
Reno, NV                                548,000       20.38        21.10         (4,000)       (8,000)       22.60               -3.6     -4.1
Sacramento, CA                         8,912,000      10.10         9.75         32,000        24,000        32.40                0.7     -1.9
San Diego County, CA                   7,254,000      18.30        18.89        (43,000)    (127,000)        28.70                0.0     -4.0
San Francisco, CA                    52,333,000       14.48        14.01        296,000       659,000        36.90                2.6    10.8
San Jose/Silicon Valley, CA            3,365,000      31.24        30.91        (27,000)      (49,000)       31.90               -1.5     -9.8
Seattle/Puget Sound, WA              32,337,000       21.19        18.83        635,000       299,000        29.70                1.8      7.4
Stockton/San Joaquin County, CA        2,774,000      27.96        27.64          9,000        (2,000)       21.60                0.0      4.9
WEST TOTAL/AVERAGE                  194,542,000       15.41        15.14        477,000       564,000        31.45
U.S. TOTAL/AVERAGE                1,022,774,000       14.83        14.48      4,375,000     6,524,000        39.00   weighted    -1.45     1.16
                                                                                                             27.10   equal       -3.64    -4.42


                                                                                                             COLLIERS INTERNATIONAL |            P. 5
HIGHLIGHTS | Q2 2011 | OFFICE | NORTH AMERICA


Demand for Office Space Still Subdued,                                                     EMPLOYMENT, PROFESSIONAL & BUSINESS SERVICES
But Q2 Better than Q1                                                                                                  90
Continued from page 1                                                                                                  80


                                                                                    Month to Month Change, thousands
ably strong during the AprilJune period, with professional and business                                               70
employment in particular up 2.9 percent year-over-year (June). Widespread
increases in rents are unlikely to occur in 2011 and may not materialize until                                         60
well into 2012.                                                                                                        50

                                                                                                                       40
Downtown markets push U.S. office vacancy rate lower. The U.S. national
office vacancy rate fell slightly during the second quarter, shifting 12 basis                                         30
points lower (100 basis points equals one percent) on a sharp drop in down-
                                                                                                                       20
town vacancies. The U.S. office vacancy rate finished the quarter at 15.28
percent—back on track to finish the year below 15.00 percent. During the                                                10
second quarter, downtown vacancies fell by 34 basis points to register 13.84                                            0
percent, while the suburban office vacancy rate held steady at 16.00 per-
cent. Over the past 12 months, the U.S. national office vacancy rate has                                               -10
                                                                                                                              Jan Feb Mar Apr May Jun Jul Aug Sep Oct Nov Dec Jan Feb Mar Apr May Jun
fallen 36 basis points. This quarter, the flight to quality was particularly evi-
dent in Class A vacancies, which shrunk 28 basis points. Canadian office
                                                                                                                             2010                                                 2011
vacancy rates fell in most markets with central business district (CBD)                    Source: U.S. Bureau of Labor Statistics
va¬cancies falling 65 basis points to 6.13 percent, and suburban vacancies
decreasing 32 basis points to 8.46 percent.
                                                                                           ABSORPTION (SF) | SELECT DOWNTOWN MARKETS | Q2 2011
Office absorption positive for fifth consecutive quarter. The U.S. office                                                                      0       500,000      1,000,000     1,500,000 2,000,000
market registered a fifth consecutive quarter of rising occupancy. Second-
quarter absorption came in at 9.9 million square feet (MSF)—a significant                                Downtown Manhattan
improvement from the first quarter when occupied space increased by 4.2
                                                                                                    Midtown S. Manhattan
MSF, and slightly more than twice the absorption recorded a year ago when
occupied space expanded by 4.9 MSF. Continuing a trend seen over the past
                                                                                                                       Midtown Manhattan
few quarters, Class A buildings continued to attract “move-up” tenants:
Class A absorption totaled 8.5 MSF, or nearly 86 percent of overall absorp-                                                          Seattle
tion. Canadian markets also recorded an increase in occupied space during
the second quarter, with absorption totaling 3.6 MSF. This was a healthy                                                     Washington, DC
increase from the 2.6 MSF recorded in the first quarter.
                                                                                                                              San Francisco
Rents take a further down-leg after showing signs of stabilizing. After a
small increase in the first quarter, both CBD and suburban rents drifted                                                             Boston
lower in the most recent three-month period. Second-quarter data shows
Class A CBD rents decreased by 1.5 percent to average $38.98 per square                                                         Philadelphia
foot. Class A suburban also moved lower, dropping 0.7 percent to average
$26.06 per square foot. Of the 57 downtown markets tracked, 30 saw rents
decrease, 20 saw rents increase and seven held steady. In the 58 suburban                  ABSORPTION (SF) | SELECT SUBURBAN MARKETS | Q2 2011
markets tracked, rents dropped in 28, rose in 24, and held steady in the re-
maining six. Canadian downtown office rents moved higher during Q1 with                                                                         0   100,000 200,000 300,000 400,000 500,000 600,000 700,000
Class A CBD rents increasing 0.4 percent while suburban Class A rents
                                                                                                      San Jose/Silicon Valley
decreased 1.3 percent.
                                                                                                                                       Dallas
Office construction returns to record-low levels. After a modest increase
in the first quarter, second-quarter office completions totaled just 3.9 MSF—                                                         Atlanta
returning to levels recorded during the fourth quarter of 2010. It should also
be noted that just four markets accounted for almost 60 percent of Q2 new                                                          San Diego
supply: downtown Houston (845,000 SF), downtown Seattle (600,000 SF),
suburban Baltimore (425,000 SF), and suburban Miami (422,000 SF).                          San Francisco Peninsula
Construction underway increased by almost 14 MSF relative to the first
quarter, with 39.4 MSF in various stages of development at the end of the                                                             Denver
second quarter. Most of this increase was due to construction associated
with the World Trade Center site in Lower Manhattan. The Canadian office                                                             Houston
market had a modest level of new construction during the second quarter,
                                                                                                                             Raleigh/Durham
adding 1.1 MSF square feet with another 7.0 MSF underway.


P. 6   | COLLIERS INTERNATIONAL
HIGHLIGHTS | Q2 2011 | OFFICE | NORTH AMERICA


 UNITED STATES | SUBURBAN OFFICE | ALL INVENTORY

                                         EXISTING      NEW SUPPLY   NEW SUPPLY    UNDER      VACANCY        VACANCY     ABSORPTION   ABSORPTION
                                      INVENTORY (SF)     Q2 2011     YTD 2011  CONSTRUCTION  RATE (%)       RATE (%)      Q2 2011     YTD 2011
 MARKET                                JUNE 30, 2011      (SF)         (SF)        (SF)     MAR. 31, 2011 JUNE 30, 2011    (SF)         (SF)

 NORTHEAST

 Baltimore, MD                           64,083,000     425,000       612,000     1,203,000      15.06       14.93        461,000       474,000

 Boston, MA                             106,368,000           0             0       59,000       19.43       19.46       (113,000)     (44,000)

 Fairfield County, CT                    57,808,000           0        18,000            0       13.80       13.61        726,000       959,000

 Hartford, CT                            12,394,000           0             0            0       14.45       15.40       (139,000)     (58,000)

 Long Island, NY                         71,299,000       31,000       31,000      149,000       10.69       11.05       (258,000)     (27,000)

 New Jersey – Central                   104,219,000       25,000       51,000      468,000       15.48       15.81       (349,000)    (600,000)

 New Jersey – Northern                  138,766,000           0             0      383,000       14.27       14.88       (851,000)    (920,000)

 Philadelphia, PA                       109,166,000           0             0      285,000       15.74       15.73          9,000       514,000

 Pittsburgh, PA                          92,366,000           0             0      181,000        8.27         8.07       184,000       473,000

 Washington, DC                         311,930,000     125,000       195,000     3,562,000      13.96       14.15       (545,000)    (852,000)

 Westchester County, NY                  41,078,000           0             0            0       10.70       10.82        (81,000)     (38,000)

 NORTHEAST TOTAL/AVERAGE              1,109,476,000     606,000      907,000     6,290,000       14.10       14.27      (958,000)     (120,000)
 SOUTH

 Atlanta, GA                            168,014,000           0        19,000      617,000       18.11       17.89        376,000       765,000

 Charleston, SC                           9,502,000           0             0            0       17.19       16.82         35,000       198,000

 Charlotte, NC                           72,792,000     369,000       374,000      534,000       13.68       13.55        308,000       557,000

 Columbia, SC                             4,655,000           0             0            0       20.86       19.64         36,000        40,000

 Dallas/Fort Worth, TX                  259,944,000     129,000       179,000      723,000       16.69       16.49        619,000       973,000

 Ft. Lauderdale/Broward Co., FL          43,861,000           0             0            0       14.57       14.18        172,000       210,000

 Greenville, SC                           4,560,000           0             0       14,000       21.97       22.47        (35,000)       75,000

 Houston, TX                            159,274,000       22,000       22,000      781,000       15.76       15.85         62,000       453,000

 Jacksonville, FL                        44,109,000           0             0       15,000       14.50       14.23        222,000       523,000

 Little Rock, AR                          7,399,000       36,000       36,000      186,000       10.88       10.70          8,000        27,000

 Louisville, KY                          35,898,000        3,000       57,000      197,000       15.89       16.73       (161,000)      385,000

 Memphis, TN                             28,088,000       12,000       82,000            0       13.40       13.39         14,000        60,000

 Miami-Dade, FL                          63,501,000     422,000       512,000      258,000       15.00       15.35        (35,000)      101,000

 Nashville, TN                           25,734,000           0             0      389,000        9.83         9.71       123,000       191,000

 Orlando, FL                             55,396,000       82,000       82,000      412,000       16.03       15.70        255,000       402,000

 Raleigh/Durham/Chapel Hill, NC          66,214,000     102,000       102,000       70,000       13.66       13.73          6,000       176,000

 Savannah, GA                             1,505,000           0             0            0       21.31       24.19        (59,000)     (89,000)

 Tampa, FL                               71,313,000           0             0      107,000       16.28       16.35        (52,000)    (224,000)

 West Palm Beach/Palm Beach Co., FL      29,059,000           0        73,000       32,000       21.01       20.23        227,000       359,000

 SOUTH TOTAL/AVERAGE                  1,150,817,000    1,178,000    1,540,000    4,333,000       15.95       15.86      2,122,000     5,181,000


P. 7   | COLLIERS INTERNATIONAL
HIGHLIGHTS | Q2 2011 | OFFICE | NORTH AMERICA


UNITED STATES | SUBURBAN OFFICE | ALL INVENTORY

                                     EXISTING      NEW SUPPLY   NEW SUPPLY    UNDER      VACANCY        VACANCY     ABSORPTION   ABSORPTION
                                  INVENTORY (SF)     Q2 2011     YTD 2011  CONSTRUCTION  RATE (%)       RATE (%)      Q2 2011     YTD 2011
MARKET                             JUNE 30, 2011      (SF)         (SF)        (SF)     MAR. 31, 2011 JUNE 30, 2011    (SF)         (SF)

MIDWEST

Chicago, IL                         153,141,000           0             0      416,000       17.91       19.02     (1,707,000)   (1,639,000)
Cincinnati, OH                       34,463,000           0        16,000      195,000       20.92       21.06        (51,000)       85,000
Cleveland, OH                        92,374,000       57,000       71,000     1,361,000      10.33       10.44              0     (141,000)
Columbus, OH                         43,748,000           0        65,000      210,000       14.13       13.67        199,000       126,000
Detroit, MI                         100,009,000       24,000       51,000       24,000       21.74       21.27        481,000       364,000
Grand Rapids, MI                     11,538,000           0             0            0       22.74       22.73          1,000        14,000
Indianapolis, IN                     47,592,000           0        12,000            0       11.61       11.39        102,000        83,000
Kansas City, MO-KS                   55,744,000       30,000       96,000       43,000       13.75       13.61        102,000       205,000
Minneapolis, MN                      38,176,000           0             0            0       17.78       17.13        272,000       372,000
Omahan, NE                           20,299,000       36,000      351,000            0       12.91       12.93        164,000       211,000
St. Louis, MO                        55,087,000           0             0            0       12.55       13.06       (250,000)   (1,214,000)
St. Paul, MN                         12,244,000           0             0            0       14.64       17.38       (340,000)    (410,000)
MIDWEST TOTAL/AVERAGE              664,415,000      146,000      662,000     2,248,000       15.96       16.17     (1,027,000) (1,945,000)
WEST

Bakersfield, CA                       5,969,000           0             0         9,000      10.08         9.90        10,000        (4,000)
Boise, ID                            10,867,000           0             0       16,000       21.93       21.83         10,000        30,000
Denver, CO                          101,418,000           0       286,000       30,000       15.61       15.41        230,000       451,000
Fairfield, CA                         4,269,000           0             0            0       27.22       25.78         61,000      (42,000)
Fresno, CA                           17,885,000       56,000       86,000       60,000       13.42       13.43         47,000        75,000
Honolulu, HI                          7,510,000           0             0            0       12.27       11.83         43,000      (21,000)
Las Vegas, NV                        34,798,000           0       175,000       12,000       26.85       26.56         75,000      (87,000)
Los Angeles – Inland Empire, CA      21,667,000           0             0            0       25.67       25.00        147,000      (25,000)
Los Angeles, CA                     171,405,000           0       191,000     1,001,000      18.04       18.25       (356,000)    (872,000)
Oakland, CA                          15,877,000           0             0            0       19.41       19.81        (63,000)    (382,000)
Orange County, CA                    79,234,000           0             0            0       21.26       20.60        520,000       809,000
Phoenix, AZ                         109,114,000     165,000       348,000      553,000       22.50       22.56         67,000        16,000
Pleasanton/Walnut Creek, CA          32,932,000           0             0            0       16.12       17.06       (310,000)    (890,000)
Portland, OR                         43,993,000           0        63,000      505,000       13.35       13.12        754,000     1,770,000
Reno, NV                              5,546,000           0             0            0       18.64       18.50        (50,000)     (47,000)
Sacramento, CA                       72,863,000           0        80,000      125,000       19.48       19.36         84,000     (192,000)
San Diego County, CA                 68,075,000           0             0       87,000       15.64       15.07        359,000       683,000
San Francisco Peninsula, CA          35,175,000           0             0            0       15.24       14.26        347,000       932,000
San Jose/Silicon Valley, CA          53,989,000           0             0      578,000       18.90       17.97        636,000     1,052,000
Seattle/Puget Sound, WA              74,073,000     223,000       223,000      331,000       14.25       13.38        615,000        13,000
WEST TOTAL/AVERAGE                 966,658,000      444,000     1,453,000    3,308,000       18.29       18.04      3,224,000     3,270,000
U.S. TOTAL/AVERAGE                3,891,366,000    2,374,000    4,561,000   16,180,000       16.00       16.00      3,361,000     6,386,000


                                                                                                           COLLIERS INTERNATIONAL |      P. 8
HIGHLIGHTS | Q2 2011 | OFFICE | NORTH AMERICA


 UNITED STATES | SUBURBAN OFFICE | CLASS A

                                                                                                             AVERAGE ANNUAL QUARTERLY   ANNUAL
                                         EXISTING       VACANCY        VACANCY     ABSORPTION   ABSORPTION     QUOTED RENT   CHANGE IN CHANGE IN
                                      INVENTORY (SF)    RATE (%)       RATE (%)      Q2 2011     YTD 2011       (USD PDF)      RENT      RENT
 MARKET                                JUNE 30, 2011   MAR. 31, 2011 JUNE 30, 2011    (SF)         (SF)        JUNE 30, 2011    (%)       (%)

 NORTHEAST

 Baltimore, MD                          26,510,000        16.33        15.89         368,000       602,000       25.40          1.3       -3.4

 Boston, MA                             44,568,000        18.20        17.58         191,000       164,000       25.90         -1.0       -1.9

 Fairfield County, CT                   30,147,000        15.17        14.59         534,000       440,000       34.60         -1.2      11.8

 Hartford, CT                            7,486,000        14.23        16.05       (146,000)     (192,000)       20.60          0.5       0.6

 Long Island, NY                        24,252,000        12.22        12.68       (113,000)         5,000       29.90          0.8

 New Jersey – Central                   62,479,000        16.75        17.19       (278,000)     (281,000)       23.10          1.3       -3.6

 New Jersey – Northern                  83,883,000        14.36        14.36           1,000     (218,000)       24.00         -3.0       -1.7

 Philadelphia, PA                       67,344,000        15.47        15.36          71,000       557,000       24.00         -0.1       -0.9

 Pittsburgh, PA                         16,833,000        44.84        43.71         190,000       218,000       21.70           –          –

 Washington, DC                        161,411,000        15.88        15.50         460,000       462,000       31.30         -0.3       1.7

 Westchester County, NY                 18,445,000        13.23        13.45        (37,000)        22,000       27.60          0.6       0.5

 NORTHEAST TOTAL/AVERAGE              543,357,000         16.49        16.33       1,239,000     1,778,000       27.12           –          –
 SOUTH

 Atlanta, GA                            77,627,000        17.83        17.35         368,000       927,000       21.80         -0.4       0.0

 Charleston, SC                          4,475,000        13.96        13.23          33,000       117,000       23.10          0.0         –

 Charlotte, NC                          18,629,000        16.40        16.86         146,000       295,000       20.30          0.6       -0.4

 Columbia, SC                              888,000        16.31        16.54          (2,000)       33,000       16.80         -3.1       -0.8

 Dallas/Fort Worth, TX                  91,918,000        18.15        18.00         200,000       367,000       24.80          0.0       0.0

 Ft. Lauderdale/Broward Co., FL         10,794,000        20.90        20.42          53,000         7,000       28.50         -0.1       1.2

 Greenville, SC                          1,931,000        18.90        21.12        (43,000)      (51,000)       18.10          2.7       1.7

 Houston, TX                            70,015,000        16.56        16.17         261,000       799,000       26.60         -1.0       -2.6

 Jacksonville, FL                        9,241,000        12.25         7.98          20,000       167,000       20.40          3.9       0.1

 Little Rock, AR                         2,689,000        15.42        15.43               0        13,000       18.50         -0.2       -0.2

 Louisville, KY                          6,893,000        17.65        20.74           9,000       361,000       20.00          0.2       0.0

 Memphis, TN                             7,963,000         9.19         9.01          14,000      (11,000)       21.30         -0.3       0.2

 Miami-Dade, FL                         15,532,000        21.35        23.08       (106,000)        88,000       31.70         -0.8       -3.6

 Nashville, TN                          13,989,000         7.73         7.42         116,000       122,000       22.40          0.1       0.3

 Orlando, FL                            17,265,000        20.13        19.47         113,000        97,000       22.30         -1.7       -2.4

 Raleigh/Durham/Chapel Hill, NC         25,631,000        16.04        15.84          10,000       236,000       21.70          0.3       1.4

 Savannah, GA                              490,000        26.39        26.44           2,000      (26,000)       22.30           –          –

 Tampa, FL                              23,615,000        18.01        18.38        (88,000)     (135,000)       23.30          0.8       -2.3

 West Palm Beach/Palm Beach Co., FL      9,178,000        19.49        18.29         110,000       212,000       30.10         -0.4       -1.7

 SOUTH TOTAL/AVERAGE                  408,763,000         17.17        16.96       1,217,000     3,619,000       23.98


P. 9   | COLLIERS INTERNATIONAL
HIGHLIGHTS | Q2 2011 | OFFICE | NORTH AMERICA


UNITED STATES | SUBURBAN OFFICE | CLASS A

                                                                                                         AVERAGE ANNUAL QUARTERLY   ANNUAL
                                     EXISTING       VACANCY        VACANCY     ABSORPTION   ABSORPTION     QUOTED RENT   CHANGE IN CHANGE IN
                                  INVENTORY (SF)    RATE (%)       RATE (%)      Q2 2011     YTD 2011       (USD PDF)      RENT      RENT
MARKET                             JUNE 30, 2011   MAR. 31, 2011 JUNE 30, 2011    (SF)         (SF)        JUNE 30, 2011    (%)       (%)

MIDWEST

Chicago, IL                          75,187,000       18.61        20.22     (1,206,000)     (904,000)       27.00               -1.2    -1.8
Cincinnati, OH                       16,602,000       19.98        19.46          85,000       172,000       21.50                6.4     4.9
Cleveland, OH                        12,922,000       12.65        11.75          79,000         3,000       21.50               -0.2    -2.0
Columbus, OH                         17,837,000       12.34        11.95          69,000      (21,000)       18.30                5.7    -2.0
Detroit, MI                          25,723,000       19.62        18.55         280,000       172,000       21.70               -2.2    -3.2
Grand Rapids, MI                      2,180,000       42.43        29.89           5,000         3,000       19.20                2.8    -8.2
Indianapolis, IN                     12,580,000       15.02        14.57          57,000        39,000       18.50               -0.3      –
Kansas City, MO-KS                   15,038,000       14.85        14.21          97,000       104,000       20.60                0.0    -4.1
Minneapolis, MN                      16,158,000       18.38        16.04         320,000       427,000       14.60               -0.7    -5.6
Omaha, NE                             4,340,000        7.13         7.02          13,000       365,000       25.50                 –       –
St. Louis, MO                        25,880,000       14.10        14.48        (68,000)     (684,000)       22.20                1.6    -5.2
St. Paul, MN                          3,013,000       15.61        18.10        (61,000)     (112,000)       15.00                0.3    -3.2
MIDWEST TOTAL/AVERAGE              227,460,000        16.99        17.00       (330,000)     (438,000)       22.42
WEST

Bakersfield, CA                       2,698,000        6.55         6.24           8,000        13,000       24.00                0.0     0.0
Boise, ID                             4,684,000       24.15        23.74          19,000            0        18.00                0.0     0.0
Denver, CO                           33,163,000       13.41        12.81         187,000       628,000       21.90                1.9     2.6
Fairfield, CA                         1,795,000       28.95        27.86          20,000      (63,000)       25.10               -1.9    -7.5
Fresno, CA                            3,851,000       17.91        17.74           7,000        34,000       25.20                0.0     0.0
Las Vegas, NV                         4,923,000       37.96        37.93        (32,000)      (15,000)       30.70               -2.1    -6.5
Los Angeles – Inland Empire, CA       4,970,000       31.95        30.91          52,000        49,000       23.40               -3.0   -10.1
Los Angeles, CA                     102,537,000       18.43        18.52        (98,000)     (345,000)       34.20               -1.0    -2.1
Oakland, CA                           3,582,000       29.10        24.59         162,000        78,000       26.40                1.9    -7.2
Orange County, CA                    32,936,000       23.58        22.37         399,000       415,000       25.80               -0.9    -5.7
Phoenix, AZ                          30,975,000       26.04        26.19          76,000       312,000       23.70               -0.2    -3.8
Pleasanton/Walnut Creek, CA          15,978,000       14.48        15.92       (230,000)     (124,000)       25.70               12.6     1.9
Portland, OR                         11,086,000       14.37        15.00        (70,000)       120,000       23.60                1.6     1.7
Reno, NV                              3,001,000       17.68        17.51        (50,000)      (64,000)       20.50                3.0     2.4
Sacramento, CA                       16,341,000       25.04        24.49          89,000       298,000       23.20               -1.6    -6.0
San Diego County, CA                 23,892,000       15.87        14.05         408,000       696,000       31.10               -1.5    -4.8
San Francisco Peninsula, CA          22,246,000       13.82        12.07         390,000       972,000       34.80                5.1     9.0
San Jose/Silicon Valley, CA          26,166,000       20.86        19.78         490,000     1,061,000       35.20                3.2    -2.0
Seattle/Puget Sound, WA              26,938,000       16.99        16.37         158,000     (162,000)       26.70               -2.9     0.9
WEST TOTAL/AVERAGE                 371,761,000        19.26        18.78       1,984,000     3,904,000       28.89
U.S. TOTAL/AVERAGE                1,551,341,000       17.41        17.18       4,110,000     8,863,000       26.00   weighted   -0.66   -0.81
                                                                                                             24.00   equal      -1.46   -3.13


                                                                                                            COLLIERS INTERNATIONAL |        P. 10
HIGHLIGHTS | Q2 2011 | OFFICE | NORTH AMERICA


 CANADA | DOWNTOWN OFFICE | ALL INVENTORY

                                  EXISTING          NEW SUPPLY     NEW SUPPLY      UNDER        VACANCY          VACANCY          ABSORPTION    ABSORPTION
                               INVENTORY (SF)         Q2 2011       YTD 2011    CONSTRUCTION    RATE (%)         RATE (%)           Q2 2011      YTD 2011
 MARKET                         JUNE 30, 2011          (SF)           (SF)          (SF)       MAR. 31, 2011   JUNE 30, 2011         (SF)          (SF)

 Calgary, AB                       37,809,000              0                0     1,940,000       10.92            7.79            1,184,000     1,577,000

 Edmonton, AB                      11,257,000        625,000        625,000              0         7.60           11.36              151,000      184,000

 Guelph, ON                           383,000              0                0       55,000        13.78           13.35                2,000       (4,000)

 Halifax, NS                         4,659,000             0                0            0         6.81            7.68              (32,000)              0

 Montreal, QC                      49,429,000              0                0            0         7.37            6.89              239,000      167,000

 Ottawa, ON                        14,992,000              0                0      550,000         5.63            5.39               36,000       35,000

 Regina, SK                          3,549,000             0                0      200,000         1.84            1.49               12,000        2,000

 Saskatoon, SK                       2,099,000             0         20,000        147,000         4.56            5.39               18,000       41,000

 Toronto, ON                       88,614,000              0                0      645,000         5.47            4.60              945,000     1,873,000

 Vancouver, BC                     24,295,000         58,000         58,000         72,000         3.71            3.76              (14,000)     201,000

 Victoria, BC                        4,910,000             0                0            0         8.39            9.04              (32,000)     (32,000)

 Winnipeg, MB                      11,139,000              0                0            0         6.82            7.25              (48,000)     (10,000)

 Waterloo Region, ON                 3,578,000             0                0      176,000        13.32           13.74               (7,000)       7,000

 CANADA TOTAL/AVERAGE          256,712,000           683,000        703,000      3,784,000         6.78            6.13           1,570,000     1,570,000

 CANADA | DOWNTOWN OFFICE | CLASS A

                                                       VACANCY       VACANCY                                   AVERAGE ANNUAL      QUARTERLY      ANNUAL
                                      EXISTING         RATE (%)      RATE (%)    ABSORPTION     ABSORPTION       QUOTED RENT        CHANGE        CHANGE
                                   INVENTORY (SF)       MAR. 31,     JUNE 30,      Q2 2011       YTD 2011         (CAD PSF)         IN RENT       IN RENT
 MARKET                             JUNE 30, 2011        2011          2011         (SF)           (SF)          JUNE 30, 2011        (%)           (%)

 Calgary, AB                         24,787,000        8.78          4.82          981,000       1,233,000        44.00                11.3        11.3

 Edmonton, AB                         8,879,000        7.23          9.87          346,000         346,000        39.20                -0.2         -4.7

 Guelph, ON                             203,000        0.00          0.00                0          14,000        27.40                 0.0

 Halifax, NS                          1,928,000        6.70          6.53            6,000          (3,000)       32.40                 0.1         2.7

 Montreal, QC                        23,076,000        7.29          6.65          147,000         197,000        37.00                 0.0        15.6

 Ottawa, ON                           9,001,000        6.60          5.94           60,000          63,000        48.60                 0.5         0.3

 Regina, SK                           1,031,000        1.52          1.52                0          (5,000)       37.10                 0.0         6.7

 Saskatoon, SK                          492,000        0.21          0.00            1,000            1,000       34.00                 0.0         7.9

 Toronto, ON                         42,102,000        5.99          4.94          606,000       1,177,000        52.40                -5.8         -2.1

 Vancouver, BC                        9,901,000        2.40          2.38                0          40,000        53.80                 0.5         3.4

 Victoria, BC                           821,000       16.59         14.61           10,000          10,000        37.80                   –           –

 Winnipeg, MB                         2,619,000        6.59          6.11           13,000          13,000        30.00                 0.0           –

 Waterloo Region, ON                  1,425,000        8.20          8.26          (1,000)          25,000        25.70                11.1         -3.5

 CANADA TOTAL/AVERAGE              126,264,000          6.67          5.54       2,170,000      3,113,000         45.40   weighted     -0.40        3.26

                                                                                                                  38.40   equal         0.77       -1.81


P. 11   | COLLIERS INTERNATIONAL
HIGHLIGHTS | Q2 2011 | OFFICE | NORTH AMERICA


 CANADA | SUBURBAN OFFICE | ALL INVENTORY

                                          EXISTING       NEW SUPPLY      NEW SUPPLY         UNDER          VACANCY              VACANCY            ABSORPTION    ABSORPTION
                                       INVENTORY (SF)      Q2 2011        YTD 2011       CONSTRUCTION      RATE (%)             RATE (%)             Q2 2011      YTD 2011
 MARKET                                 JUNE 30, 2011       (SF)            (SF)             (SF)         MAR. 31, 2011       JUNE 30, 2011           (SF)          (SF)

 Calgary, AB                              23,478,000      220,000         220,000            576,000              9.73             9.17               329,000       621,000
 Edmonton, AB                               8,940,000            0               0            40,000          15.14               13.31               139,000       182,000
 Guelph, ON                                 1,353,000            0               0            17,000              4.26             3.80                 6,000                0
 Halifax, NS                                6,335,000      18,000          77,000             90,000              9.65            10.41             (12,000)          38,000
 Montreal, QC                             23,621,000             0               0           112,000              9.93             9.41               123,000         93,000
 Ottawa, ON                               20,638,000             0               0                  0             7.99             7.74                72,000     (143,000)
 Regina, SK                                   659,000            0               0                  0             0.26             0.14                 1,000          3,000
 Toronto, ON                              98,006,000      116,000         116,000            918,000              7.20             7.03               327,000     1,157,000
 Vancouver, BC                            27,273,000             0        113,000            705,000          10.93               10.75                49,000         94,000
 Victoria, BC                               3,573,000            0               0           113,000          10.18                8.54                66,000         66,000
 Winnipeg, MB                               3,173,000            0               0            37,000          12.52               12.61               (9,000)       (26,000)
 Waterloo Region, ON                        5,984,000     103,000         155,000            609,000              7.96             7.72                 6,000         64,000
 CANADA TOTAL/AVERAGE                   223,033,000       456,000         679,000         3,217,000               8.78             8.46            1,097,000      2,149,000

 CANADA | SUBURBAN OFFICE | CLASS A

                                                             VACANCY          VACANCY                                         AVERAGE ANNUAL QUARTERLY              ANNUAL
                                           EXISTING          RATE (%)         RATE (%)       ABSORPTION     ABSORPTION          QUOTED RENT   CHANGE                CHANGE
                                        INVENTORY (SF)        MAR. 31,        JUNE 30,         Q2 2011       YTD 2011            (CAD PSF)    IN RENT               IN RENT
 MARKET                                  JUNE 30, 2011         2011             2011            (SF)           (SF)             JUNE 30, 2011   (%)                   (%)

 Calgary, AB                               10,829,000           9.90             7.94          410,000            640,000          38.00                 2.7         18.8
 Guelph, ON                                    821,000          1.08             0.86             2,000           (4,000)          24.30                -5.0             –
 Halifax, NS                                 2,650,000          7.79             8.52          (14,000)             6,000          28.00                -1.2           4.7
 Montreal, QC                              13,226,000           7.43             7.77          113,000            111,000          30.00                 0.0         25.0
 Ottawa, ON                                11,626,000           7.83             7.80             3,000            12,000          30.00                -8.2          -3.3
 Regina, SK                                    659,000          0.26             0.14             1,000             3,000          28.50                 0.0         16.3
 Toronto, ON                               43,204,000           8.08             7.88          122,000            556,000          29.90                -1.6          -4.1
 Vancouver, BC                             13,132,000         13.33            13.07             35,000            63,000          38.30                -0.6           9.3
 Victoria, BC                                  817,000          8.67             8.93           (2,000)           (2,000)          40.00                  –          27.0
 Waterloo Region, ON                         2,413,000        10.51              8.43            50,000            30,000          21.90                -4.8          -2.1
 CANADA TOTAL/AVERAGE                      99,377,000          8.80              8.48          719,000       1,414,000             31.70   weighted     -1.30          3.60
                                                                                                                                   30.90   equal         1.46          5.12


Glossary
Inventory – Includes all existing multi- or single-      New Supply – Includes completed speculative and                 Cap Rate – (Or going-in cap rate) Capitalization
tenant leased and owner-occupied office properties       build-to-suit construction. New supply quoted on a              rates in this survey are based on multi-tenant
greater than or equal to 10,000 square feet (net         net basis after any demolitions or conversions.                 institutional grade buildings fully leased at market
rentable area). In some larger markets this minimum                                                                      rents. Cap rates are calculated by dividing net
size threshold may vary up to 50,000 square feet.        Annual Quoted Rent – Includes all costs associated              operating income (NOI) by purchase price.
Does not include medical or government buildings.        with occupying a full floor in the mid-rise portion of
                                                         a Class A building inclusive of taxes, insurance,               Note: SF = square feet
Vacancy Rate – Percentage of total inventory             maintenance, janitorial and utilities (electricity                    PSF = per square foot
physically vacant as at the survey date including        surcharges added where applicable). All office rents                  CBD = central business district
direct vacant and sublease space.                        in this report are quoted on an annual, gross per
                                                         square foot basis. Rent calculations do not include
Absorption – Net change in physically occupied           sublease space.
space over a given period of time.


                                                                                                                                       COLLIERS INTERNATIONAL |              P. 12
HIGHLIGHTS | Q2 2011 | OFFICE | NORTH AMERICA


UNITED STATES | OFFICE INVESTMENT

                                            CBD         CBD       SUBURBAN     SUBURBAN       512 offices in
                                                                                              61 countries on
                                        SALES PRICE   CAP RATE   SALES PRICE   CAP RATE
MARKET                                   (USD PSF)      (%)       (USD PSF)       (%)
Atlanta, GA                                 75.00        7.50       139.00         8.50
Baltimore, MD
Boston, MA
                                                –
                                           247.00
                                                            –
                                                         5.00
                                                                    141.13
                                                                    236.00
                                                                                   7.50
                                                                                      –
                                                                                              6 continents
Charleston, SC                             250.00        8.00       135.00        11.00
Chicago, IL                                165.00        7.25       106.00         8.50       United States: 125
Cincinnati, OH                             125.00        9.75       140.00         9.50       Canada: 38
Columbus, OH                                80.00           –       141.00            –       Latin America: 18
Dallas/Fort Worth, TX                       88.00        8.20       115.00         7.60       Asia Pacific: 214
Denver, CO                                 300.00        7.50       150.00         8.00       EMEA: 117
Fairfield County, CT                            –           –       250.00         8.00
Fresno, CA                                 105.00        9.00       140.00         8.50   •   $1.5 billion in annual revenue
Ft. Lauderdale-Broward, FL                      –           –       106.00         8.33
Grand Rapids, MI                                –           –        40.75            –   •   979 million square feet under
Hartford, CT                                10.13           –        66.48            –       management
Houston, TX                                280.00        7.60       187.00         8.10
Indianapolis, IN                                –           –       203.00         6.90
                                                                                          •   Over 12,000 professionals
Kansas City, MO                                 –        8.00            –         8.00
Las Vegas, NV                                   –           –        73.58            –
Little Rock, AR                             88.00        9.50       110.00         9.25       COLLIERS INTERNATIONAL
Long Island, NY                                 –           –       186.78         8.34
Los Angeles – Inland Empire, CA                 –           –       175.00         8.00       601 Union Street, Suite 4800
Los Angeles, CA                            290.00        6.00       275.00         7.50       Seattle, WA 98101
Miami-Dade, FL                             149.00           –       128.00         7.50       TEL +1 206 695 4200
Minneapolis, MN                                 –           –       103.30         9.28
New Jersey - Central                            –           –       145.00         7.20
New Jersey - Northern                           –           –       141.00         8.80
New York, NY – Downtown Manhattan          247.00        6.90            –            –       FOR MORE INFORMATION
New York, NY – Midtown Manhattan           618.00        5.00            –            –
New York, NY – Midtown S. Manhattan        618.00        5.00            –            –       Ross J. Moore
Oakland, CA                                     –        8.00            –         9.00       Chief Economist | USA
Orange County, CA                               –           –       250.00         8.00
                                                                                              TEL +1 617 722 0221
Orlando, FL                                148.75        8.00       115.00         6.70
Philadelphia, PA                           160.00        8.60       119.00         8.50       EMAIL ross.moore@colliers.com
Phoenix, AZ                                116.00           –        82.00         9.00
Pittsburgh, PA                             150.00        8.25       100.00         9.00
Pleasanton/Walnut Creek, CA                117.50        8.00        87.50         8.50
Raleigh/Durham/Chapel Hill, NC                  –           –       225.00         7.50       Copyright © 2011 Colliers International.
Sacramento, CA                                  –           –       171.57            –
San Diego, CA                              131.48           –       126.40         8.63       The information contained herein has been obtained
San Francisco                              500.00        5.50            –            –       from sources deemed reliable. While every reasonable
                                                                                              effort has been made to ensure its accuracy, we cannot
San Francisco Peninsula, CA                     –           –       200.00         7.00
                                                                                              guarantee it. No responsibility is assumed for any
Savannah, GA                               150.00        9.50       120.00         9.75
                                                                                              inaccuracies. Readers are encouraged to consult their
Seattle/Puget Sound, WA                    158.62        8.03       119.17         7.05       professional advisors prior to acting on any of the
St. Louis, MO                              100.00        9.25       130.00         8.50       material contained in this report.
Stamford, CT                               350.00        8.00            –            –
Stockton/San Joaquin County, CA            125.00        8.50            –            –
Tampa, FL                                   47.00           –        78.00         8.00
West Palm Beach/Palm Beach County, FL           –           –       122.00         7.22
Westchester County, NY                          –           –       250.00         8.00
White Plains, NY                           350.00        8.00            –            –


CANADA | OFFICE INVESTMENT

                                            CBD         CBD       SUBURBAN     SUBURBAN
                                        SALES PRICE   CAP RATE   SALES PRICE   CAP RATE
MARKET                                   (CAD PSF)      (%)       (CAD PSF)       (%)
Calgary, AB                                395.00        6.25       375.00         6.50
Edmonton, AB                                    –           –       256.11         6.70
Guelph, ON                                 140.00        7.25       150.00         7.50
Halifax, NS                                     –           –       197.00         8.15
Montreal, QC                               275.00        7.00       190.00         7.25
Ottawa, ON                                 270.00        7.25       145.00         7.60
Regina, SK                                 100.00        8.00            –            –
Saskatoon, SK                              240.00        7.00            –            –
Toronto, ON                                299.00        6.54       178.00         5.09
Vancouver, BC                              400.00        5.75       300.00         6.50
Victoria, BC                               285.00        6.50       280.00         6.75
Winnipeg, MB                               155.00        7.75       135.00         7.75                 Accelerating success.
Waterloo Region, ON                        140.00        7.25       150.00         7.50


WWW.COLLIERS.COM

Mais conteúdo relacionado

Destaque (9)

Q2 2011 Houston Industrial Market Report
Q2 2011 Houston Industrial Market ReportQ2 2011 Houston Industrial Market Report
Q2 2011 Houston Industrial Market Report
 
Renegade networks: How we can save the world, make a little cash & get to the...
Renegade networks: How we can save the world, make a little cash & get to the...Renegade networks: How we can save the world, make a little cash & get to the...
Renegade networks: How we can save the world, make a little cash & get to the...
 
The psychophysiology of tobacco use and craving
The psychophysiology of tobacco use and cravingThe psychophysiology of tobacco use and craving
The psychophysiology of tobacco use and craving
 
Gen y whitepaper
Gen y whitepaperGen y whitepaper
Gen y whitepaper
 
Central London Office Report 2Q 2011
Central London Office Report 2Q 2011Central London Office Report 2Q 2011
Central London Office Report 2Q 2011
 
Colliers Advantage
Colliers AdvantageColliers Advantage
Colliers Advantage
 
BCA Expo July 2011
BCA Expo July 2011BCA Expo July 2011
BCA Expo July 2011
 
Oklahoma 4H Roundup 2011
Oklahoma 4H Roundup 2011Oklahoma 4H Roundup 2011
Oklahoma 4H Roundup 2011
 
Surface finishing
Surface finishingSurface finishing
Surface finishing
 

Semelhante a North American Office Highlights 2Q 2011

2012 q2 tampa bay office market report
2012 q2 tampa bay office market report2012 q2 tampa bay office market report
2012 q2 tampa bay office market report
Jeff Tolrud
 
Tampa Bay Office Market Report - Q4 2011
Tampa Bay Office Market Report - Q4 2011Tampa Bay Office Market Report - Q4 2011
Tampa Bay Office Market Report - Q4 2011
Jeff Tolrud
 
North American Office highlights 2Q 2012
North American Office highlights 2Q 2012North American Office highlights 2Q 2012
North American Office highlights 2Q 2012
Coy Davidson
 
US Industrial Highlights Q3 2011
US Industrial Highlights Q3 2011US Industrial Highlights Q3 2011
US Industrial Highlights Q3 2011
colliersohio
 
Tampa Bay Office Market Report - Q3 2011
Tampa Bay Office Market Report - Q3 2011Tampa Bay Office Market Report - Q3 2011
Tampa Bay Office Market Report - Q3 2011
Jeff Tolrud
 
Retail US Highlights Spring 2011
Retail US Highlights Spring 2011Retail US Highlights Spring 2011
Retail US Highlights Spring 2011
Coy Davidson
 
Colliers North American Industrial Highlights 4Q-11
Colliers North American Industrial Highlights 4Q-11Colliers North American Industrial Highlights 4Q-11
Colliers North American Industrial Highlights 4Q-11
Coy Davidson
 
Colliers International: Retail Highlights Fall 2010
Colliers International: Retail Highlights Fall 2010Colliers International: Retail Highlights Fall 2010
Colliers International: Retail Highlights Fall 2010
Coy Davidson
 
Q2 2011 Houston Office Market Report
Q2 2011 Houston Office Market ReportQ2 2011 Houston Office Market Report
Q2 2011 Houston Office Market Report
Coy Davidson
 
C&W - MONTREAL OFFICE MARKETBEAT - Q4 2012
C&W - MONTREAL  OFFICE MARKETBEAT - Q4 2012 C&W - MONTREAL  OFFICE MARKETBEAT - Q4 2012
C&W - MONTREAL OFFICE MARKETBEAT - Q4 2012
Guy Masse
 
Western U.S. view point april 2012
Western U.S. view point april 2012Western U.S. view point april 2012
Western U.S. view point april 2012
GilWhiteCRE
 

Semelhante a North American Office Highlights 2Q 2011 (19)

Officenahighlights3q2011v1
Officenahighlights3q2011v1Officenahighlights3q2011v1
Officenahighlights3q2011v1
 
North American Office Highlights 4Q 2010
North American Office Highlights 4Q 2010North American Office Highlights 4Q 2010
North American Office Highlights 4Q 2010
 
2012 q2 tampa bay office market report
2012 q2 tampa bay office market report2012 q2 tampa bay office market report
2012 q2 tampa bay office market report
 
Office q4 2011
Office q4 2011Office q4 2011
Office q4 2011
 
North American Industrial Highlights 4Q 2010
North American Industrial Highlights 4Q 2010North American Industrial Highlights 4Q 2010
North American Industrial Highlights 4Q 2010
 
Tampa Bay Office Market Report - Q4 2011
Tampa Bay Office Market Report - Q4 2011Tampa Bay Office Market Report - Q4 2011
Tampa Bay Office Market Report - Q4 2011
 
North American Office highlights 2Q 2012
North American Office highlights 2Q 2012North American Office highlights 2Q 2012
North American Office highlights 2Q 2012
 
US Industrial Highlights Q3 2011
US Industrial Highlights Q3 2011US Industrial Highlights Q3 2011
US Industrial Highlights Q3 2011
 
Tampa Bay Office Market Report - Q3 2011
Tampa Bay Office Market Report - Q3 2011Tampa Bay Office Market Report - Q3 2011
Tampa Bay Office Market Report - Q3 2011
 
Retail US Highlights Spring 2011
Retail US Highlights Spring 2011Retail US Highlights Spring 2011
Retail US Highlights Spring 2011
 
Colliers North American Industrial Highlights 4Q-11
Colliers North American Industrial Highlights 4Q-11Colliers North American Industrial Highlights 4Q-11
Colliers North American Industrial Highlights 4Q-11
 
Sjc.all.
Sjc.all.Sjc.all.
Sjc.all.
 
Green Building Index Profile Report: Midtown NY
Green Building Index Profile Report: Midtown NYGreen Building Index Profile Report: Midtown NY
Green Building Index Profile Report: Midtown NY
 
Colliers International: Retail Highlights Fall 2010
Colliers International: Retail Highlights Fall 2010Colliers International: Retail Highlights Fall 2010
Colliers International: Retail Highlights Fall 2010
 
Q2 2011 Houston Office Market Report
Q2 2011 Houston Office Market ReportQ2 2011 Houston Office Market Report
Q2 2011 Houston Office Market Report
 
FHO Partners 3Q 2010 Market Report
FHO Partners 3Q 2010 Market ReportFHO Partners 3Q 2010 Market Report
FHO Partners 3Q 2010 Market Report
 
C&W - MONTREAL OFFICE MARKETBEAT - Q4 2012
C&W - MONTREAL  OFFICE MARKETBEAT - Q4 2012 C&W - MONTREAL  OFFICE MARKETBEAT - Q4 2012
C&W - MONTREAL OFFICE MARKETBEAT - Q4 2012
 
FHO Partners 4Q 2010 Market Report
FHO Partners 4Q 2010 Market ReportFHO Partners 4Q 2010 Market Report
FHO Partners 4Q 2010 Market Report
 
Western U.S. view point april 2012
Western U.S. view point april 2012Western U.S. view point april 2012
Western U.S. view point april 2012
 

Mais de Coy Davidson

Q4 2014 San Francisco Office Report
Q4 2014 San Francisco Office ReportQ4 2014 San Francisco Office Report
Q4 2014 San Francisco Office Report
Coy Davidson
 
Boma standards-update
Boma standards-update Boma standards-update
Boma standards-update
Coy Davidson
 

Mais de Coy Davidson (20)

The Future of Work from Home
The Future of Work from HomeThe Future of Work from Home
The Future of Work from Home
 
Occupier Services CoreNetWebinarTakeaways
Occupier Services CoreNetWebinarTakeaways Occupier Services CoreNetWebinarTakeaways
Occupier Services CoreNetWebinarTakeaways
 
Horizon Tower
Horizon TowerHorizon Tower
Horizon Tower
 
Leading Occupiers to the New Normal
Leading Occupiers to the New NormalLeading Occupiers to the New Normal
Leading Occupiers to the New Normal
 
Houston Methodist and Colliers International Houston
Houston Methodist and Colliers International HoustonHouston Methodist and Colliers International Houston
Houston Methodist and Colliers International Houston
 
2017 Healthcare Marketplace
2017 Healthcare Marketplace2017 Healthcare Marketplace
2017 Healthcare Marketplace
 
Colliers International Houston Trends 2017
Colliers International Houston Trends 2017Colliers International Houston Trends 2017
Colliers International Houston Trends 2017
 
2016 Houston Economic Outlook
2016 Houston Economic Outlook2016 Houston Economic Outlook
2016 Houston Economic Outlook
 
2016 Healthcare Real Estate Marketplace
2016 Healthcare Real Estate Marketplace2016 Healthcare Real Estate Marketplace
2016 Healthcare Real Estate Marketplace
 
Houston Healthcare Real Estate Market Report - Year End 2015
Houston Healthcare Real Estate Market Report - Year End 2015Houston Healthcare Real Estate Market Report - Year End 2015
Houston Healthcare Real Estate Market Report - Year End 2015
 
Top Office Metros 2015 4Q
Top Office Metros 2015 4Q Top Office Metros 2015 4Q
Top Office Metros 2015 4Q
 
Colliers Houston Trends 2016 slides
Colliers Houston Trends 2016 slidesColliers Houston Trends 2016 slides
Colliers Houston Trends 2016 slides
 
Cre tech year end report 2015
Cre tech year end report 2015Cre tech year end report 2015
Cre tech year end report 2015
 
Q4 2014 San Francisco Office Report
Q4 2014 San Francisco Office ReportQ4 2014 San Francisco Office Report
Q4 2014 San Francisco Office Report
 
Houston Medical Office Report and Healthcare Commentary
Houston Medical Office Report and Healthcare CommentaryHouston Medical Office Report and Healthcare Commentary
Houston Medical Office Report and Healthcare Commentary
 
Colliers
Colliers Colliers
Colliers
 
Boma standards-update
Boma standards-update Boma standards-update
Boma standards-update
 
SIOR: Understanding the Common Factor
SIOR: Understanding the Common FactorSIOR: Understanding the Common Factor
SIOR: Understanding the Common Factor
 
North American Industrial Outlook Q4 13
North American Industrial Outlook Q4 13North American Industrial Outlook Q4 13
North American Industrial Outlook Q4 13
 
Colliers Medical Office-Update
Colliers Medical Office-Update Colliers Medical Office-Update
Colliers Medical Office-Update
 

Último

Listing Turkey - 2024 - May Featured Portfolio
Listing Turkey - 2024 - May Featured PortfolioListing Turkey - 2024 - May Featured Portfolio
Listing Turkey - 2024 - May Featured Portfolio
Listing Turkey
 
Bptp The Amaario Launch Luxury Project Sector 37D Gurgaon Dwarka Expressway...
Bptp The Amaario Launch  Luxury Project  Sector 37D Gurgaon Dwarka Expressway...Bptp The Amaario Launch  Luxury Project  Sector 37D Gurgaon Dwarka Expressway...
Bptp The Amaario Launch Luxury Project Sector 37D Gurgaon Dwarka Expressway...
ApartmentWala1
 
Cheap Rate ✨➥9582086666▻✨Call Girls In Gurgaon Sector 11 (Gurgaon)
Cheap Rate ✨➥9582086666▻✨Call Girls In Gurgaon Sector 11 (Gurgaon)Cheap Rate ✨➥9582086666▻✨Call Girls In Gurgaon Sector 11 (Gurgaon)
Cheap Rate ✨➥9582086666▻✨Call Girls In Gurgaon Sector 11 (Gurgaon)
delhi24hrs1
 
Low Density Living New Project in BPTP THE AMAARIO Sector 37D Gurgaon Haryana...
Low Density Living New Project in BPTP THE AMAARIO Sector 37D Gurgaon Haryana...Low Density Living New Project in BPTP THE AMAARIO Sector 37D Gurgaon Haryana...
Low Density Living New Project in BPTP THE AMAARIO Sector 37D Gurgaon Haryana...
ApartmentWala1
 
Cheap Rate ✨➥9582086666▻✨Call Girls In Gurgaon Sector 1 (Gurgaon)
Cheap Rate ✨➥9582086666▻✨Call Girls In Gurgaon Sector 1 (Gurgaon)Cheap Rate ✨➥9582086666▻✨Call Girls In Gurgaon Sector 1 (Gurgaon)
Cheap Rate ✨➥9582086666▻✨Call Girls In Gurgaon Sector 1 (Gurgaon)
delhi24hrs1
 
Low rate ↬Call girls in Sabzi Mandi Delhi | 8447779280}Escort Service In All ...
Low rate ↬Call girls in Sabzi Mandi Delhi | 8447779280}Escort Service In All ...Low rate ↬Call girls in Sabzi Mandi Delhi | 8447779280}Escort Service In All ...
Low rate ↬Call girls in Sabzi Mandi Delhi | 8447779280}Escort Service In All ...
asmaqueen5
 
Call girls In Rana Pratap Bagh {Delhi ↫8447779280↬Escort Service (Delhi)
Call girls In Rana Pratap Bagh {Delhi ↫8447779280↬Escort Service (Delhi)Call girls In Rana Pratap Bagh {Delhi ↫8447779280↬Escort Service (Delhi)
Call girls In Rana Pratap Bagh {Delhi ↫8447779280↬Escort Service (Delhi)
asmaqueen5
 
Call Girls in Maurice Nagar (Delhi) ꧁8447779280꧂ Female Escorts Service in De...
Call Girls in Maurice Nagar (Delhi) ꧁8447779280꧂ Female Escorts Service in De...Call Girls in Maurice Nagar (Delhi) ꧁8447779280꧂ Female Escorts Service in De...
Call Girls in Maurice Nagar (Delhi) ꧁8447779280꧂ Female Escorts Service in De...
asmaqueen5
 
Escort—>Call GiRls In Mori Gate Delhi —>8447779280—Service Escorts In South D...
Escort—>Call GiRls In Mori Gate Delhi —>8447779280—Service Escorts In South D...Escort—>Call GiRls In Mori Gate Delhi —>8447779280—Service Escorts In South D...
Escort—>Call GiRls In Mori Gate Delhi —>8447779280—Service Escorts In South D...
asmaqueen5
 
BPTP THE AMAARIO For The Royals Of Tomorrow in Sector 37D Gurgaon Dwarka Expr...
BPTP THE AMAARIO For The Royals Of Tomorrow in Sector 37D Gurgaon Dwarka Expr...BPTP THE AMAARIO For The Royals Of Tomorrow in Sector 37D Gurgaon Dwarka Expr...
BPTP THE AMAARIO For The Royals Of Tomorrow in Sector 37D Gurgaon Dwarka Expr...
ApartmentWala1
 

Último (20)

SVN Live 5.13.24 Weekly Property Broadcast
SVN Live 5.13.24 Weekly Property BroadcastSVN Live 5.13.24 Weekly Property Broadcast
SVN Live 5.13.24 Weekly Property Broadcast
 
Best Interior Design Services in Haldwani
Best Interior Design Services in HaldwaniBest Interior Design Services in Haldwani
Best Interior Design Services in Haldwani
 
Listing Turkey - 2024 - May Featured Portfolio
Listing Turkey - 2024 - May Featured PortfolioListing Turkey - 2024 - May Featured Portfolio
Listing Turkey - 2024 - May Featured Portfolio
 
Bptp The Amaario Launch Luxury Project Sector 37D Gurgaon Dwarka Expressway...
Bptp The Amaario Launch  Luxury Project  Sector 37D Gurgaon Dwarka Expressway...Bptp The Amaario Launch  Luxury Project  Sector 37D Gurgaon Dwarka Expressway...
Bptp The Amaario Launch Luxury Project Sector 37D Gurgaon Dwarka Expressway...
 
Bridge & Elliot Ladner Floor Plans May 2024.pdf
Bridge & Elliot Ladner Floor Plans May 2024.pdfBridge & Elliot Ladner Floor Plans May 2024.pdf
Bridge & Elliot Ladner Floor Plans May 2024.pdf
 
Cheap Rate ✨➥9582086666▻✨Call Girls In Gurgaon Sector 11 (Gurgaon)
Cheap Rate ✨➥9582086666▻✨Call Girls In Gurgaon Sector 11 (Gurgaon)Cheap Rate ✨➥9582086666▻✨Call Girls In Gurgaon Sector 11 (Gurgaon)
Cheap Rate ✨➥9582086666▻✨Call Girls In Gurgaon Sector 11 (Gurgaon)
 
Dynamic Grandeur Undri Pune | A Space For You To Find Your Space
Dynamic Grandeur Undri Pune | A Space For You To Find Your SpaceDynamic Grandeur Undri Pune | A Space For You To Find Your Space
Dynamic Grandeur Undri Pune | A Space For You To Find Your Space
 
Jaipur Escorts 🥰 8617370543 Call Girls Offer VIP Hot Girls
Jaipur Escorts 🥰 8617370543 Call Girls Offer VIP Hot GirlsJaipur Escorts 🥰 8617370543 Call Girls Offer VIP Hot Girls
Jaipur Escorts 🥰 8617370543 Call Girls Offer VIP Hot Girls
 
Low Density Living New Project in BPTP THE AMAARIO Sector 37D Gurgaon Haryana...
Low Density Living New Project in BPTP THE AMAARIO Sector 37D Gurgaon Haryana...Low Density Living New Project in BPTP THE AMAARIO Sector 37D Gurgaon Haryana...
Low Density Living New Project in BPTP THE AMAARIO Sector 37D Gurgaon Haryana...
 
Vanam At Purva Soukhyam Guduvanchery.pdf.pdf
Vanam At Purva Soukhyam Guduvanchery.pdf.pdfVanam At Purva Soukhyam Guduvanchery.pdf.pdf
Vanam At Purva Soukhyam Guduvanchery.pdf.pdf
 
San Francisco Market Update -February 2024
San Francisco Market Update -February 2024San Francisco Market Update -February 2024
San Francisco Market Update -February 2024
 
Cheap Rate ✨➥9582086666▻✨Call Girls In Gurgaon Sector 1 (Gurgaon)
Cheap Rate ✨➥9582086666▻✨Call Girls In Gurgaon Sector 1 (Gurgaon)Cheap Rate ✨➥9582086666▻✨Call Girls In Gurgaon Sector 1 (Gurgaon)
Cheap Rate ✨➥9582086666▻✨Call Girls In Gurgaon Sector 1 (Gurgaon)
 
Madhugiri Boucher Managed Farmland (knx)
Madhugiri Boucher Managed Farmland (knx)Madhugiri Boucher Managed Farmland (knx)
Madhugiri Boucher Managed Farmland (knx)
 
Low rate ↬Call girls in Sabzi Mandi Delhi | 8447779280}Escort Service In All ...
Low rate ↬Call girls in Sabzi Mandi Delhi | 8447779280}Escort Service In All ...Low rate ↬Call girls in Sabzi Mandi Delhi | 8447779280}Escort Service In All ...
Low rate ↬Call girls in Sabzi Mandi Delhi | 8447779280}Escort Service In All ...
 
Call girls In Rana Pratap Bagh {Delhi ↫8447779280↬Escort Service (Delhi)
Call girls In Rana Pratap Bagh {Delhi ↫8447779280↬Escort Service (Delhi)Call girls In Rana Pratap Bagh {Delhi ↫8447779280↬Escort Service (Delhi)
Call girls In Rana Pratap Bagh {Delhi ↫8447779280↬Escort Service (Delhi)
 
Kohinoor Teiko Hinjewadi Phase 2 Pune E-Brochure.pdf
Kohinoor Teiko Hinjewadi Phase 2 Pune  E-Brochure.pdfKohinoor Teiko Hinjewadi Phase 2 Pune  E-Brochure.pdf
Kohinoor Teiko Hinjewadi Phase 2 Pune E-Brochure.pdf
 
Eldeco Dwarka Project In Delhi-brochure.pdf.pdf
Eldeco Dwarka Project In Delhi-brochure.pdf.pdfEldeco Dwarka Project In Delhi-brochure.pdf.pdf
Eldeco Dwarka Project In Delhi-brochure.pdf.pdf
 
Call Girls in Maurice Nagar (Delhi) ꧁8447779280꧂ Female Escorts Service in De...
Call Girls in Maurice Nagar (Delhi) ꧁8447779280꧂ Female Escorts Service in De...Call Girls in Maurice Nagar (Delhi) ꧁8447779280꧂ Female Escorts Service in De...
Call Girls in Maurice Nagar (Delhi) ꧁8447779280꧂ Female Escorts Service in De...
 
Escort—>Call GiRls In Mori Gate Delhi —>8447779280—Service Escorts In South D...
Escort—>Call GiRls In Mori Gate Delhi —>8447779280—Service Escorts In South D...Escort—>Call GiRls In Mori Gate Delhi —>8447779280—Service Escorts In South D...
Escort—>Call GiRls In Mori Gate Delhi —>8447779280—Service Escorts In South D...
 
BPTP THE AMAARIO For The Royals Of Tomorrow in Sector 37D Gurgaon Dwarka Expr...
BPTP THE AMAARIO For The Royals Of Tomorrow in Sector 37D Gurgaon Dwarka Expr...BPTP THE AMAARIO For The Royals Of Tomorrow in Sector 37D Gurgaon Dwarka Expr...
BPTP THE AMAARIO For The Royals Of Tomorrow in Sector 37D Gurgaon Dwarka Expr...
 

North American Office Highlights 2Q 2011

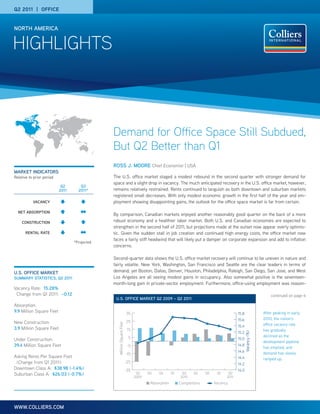
  • 1. Q2 2011 | OFFICE NORTH AMERICA HIGHLIGHTS Demand for Office Space Still Subdued, But Q2 Better than Q1 ROSS J. MOORE Chief Economist | USA MARKET INDICATORS Relative to prior period The U.S. office market staged a modest rebound in the second quarter with stronger demand for space and a slight drop in vacancy. The much anticipated recovery in the U.S. office market, however, Q2 Q3 2011 2011* remains relatively restrained. Rents continued to languish as both downtown and suburban markets registered small decreases. With only modest economic growth in the first half of the year and em- VACANCY ployment showing disappointing gains, the outlook for the office space market is far from certain. NET ABSORPTION By comparison, Canadian markets enjoyed another reasonably good quarter on the back of a more CONSTRUCTION robust economy and a healthier labor market. Both U.S. and Canadian economies are expected to strengthen in the second half of 2011, but projections made at the outset now appear overly optimis- RENTAL RATE tic. Given the sudden stall in job creation and continued high energy costs, the office market now faces a fairly stiff headwind that will likely put a damper on corporate expansion and add to inflation *Projected concerns. Second-quarter data shows the U.S. office market recovery will continue to be uneven in nature and fairly volatile. New York, Washington, San Francisco and Seattle are the clear leaders in terms of U.S. OFFICE MARKET demand; yet Boston, Dallas, Denver, Houston, Philadelphia, Raleigh, San Diego, San Jose, and West SUMMARY STATISTICS, Q2 2011 Los Angeles are all seeing modest gains in occupancy. Also somewhat positive is the seventeen- month-long gain in private-sector employment. Furthermore, office-using employment was reason- Vacancy Rate: 15.28% Change from Q1 2011: –0.12 continued on page 6 U.S. OFFICE MARKET Q2 2009 – Q2 2011 Absorption: 9.9 Million Square Feet 35 15.8 After peaking in early 15.6 2010, the nation’s New Construction: 25 office vacancy rate Million Square Feet 15.4 3.9 Million Square Feet 15 has gradually 15.2 Vacancy (%) 5 declined as the Under Construction: 15.0 development pipeline 39.4 Million Square Feet -5 14.8 has emptied, and 14.6 demand has slowly -15 Asking Rents Per Square Foot 14.4 ramped up. (Change from Q1 2011): -25 14.2 Downtown Class A: $38.98 (-1.4%) -35 14.0 Suburban Class A: $26.03 (-0.7%) Q2 Q3 Q4 Q1 Q2 Q3 Q4 Q1 Q2 2009 2010 2011 Absorption Completions Vacancy WWW.COLLIERS.COM
  • 2. HIGHLIGHTS | Q2 2011 | OFFICE | NORTH AMERICA UNITED STATES | DOWNTOWN OFFICE | ALL INVENTORY EXISTING NEW SUPPLY NEW SUPPLY UNDER VACANCY VACANCY ABSORPTION ABSORPTION INVENTORY (SF) Q2 2011 YTD 2011 CONSTRUCTION RATE (%) RATE (%) Q2 2011 YTD 2011 MARKET JUNE 30, 2011 (SF) (SF) (SF) MAR. 31, 2011 JUNE 30, 2011 (SF) (SF) NORTHEAST Baltimore, MD 41,959,000 0 28,000 0 14.19 14.19 21,000 171,000 Boston, MA 60,233,000 50,000 0 1,810,000 16.58 16.34 181,000 146,000 Hartford, CT 9,628,000 0 0 180,000 22.76 23.98 (64,000) (55,000) New York, NY – Downtown Manhattan 109,357,000 0 0 13,685,000 14.07 12.55 1,664,000 1,829,000 New York, NY – Midtown Manhattan 228,627,000 0 0 1,876,000 12.31 11.98 768,000 668,000 New York, NY – Midtown S. Manhattan 167,392,000 0 0 0 9.43 8.83 1,003,000 1,200,000 Philadelphia, PA 42,739,000 0 0 0 12.07 12.06 5,000 120,000 Pittsburgh, PA 33,146,000 0 0 0 11.82 11.34 116,000 193,000 Stamford, CT 18,798,000 0 0 0 18.68 17.45 334,000 578,000 Washington, DC 142,039,000 0 573,000 1,262,000 11.08 10.53 697,000 1,356,000 White Plains, NY 14,071,000 0 0 0 15.33 15.90 (32,000) 22,000 NORTHEAST TOTAL/AVERAGE 867,988,000 50,000 601,000 18,813,000 12.44 11.91 4,693,000 6,228,000 SOUTH Atlanta, GA 48,889,000 0 0 0 17.93 17.89 18,000 (409,000) Charleston, SC 1,995,000 0 0 0 10.15 9.49 13,000 9,000 Charlotte, NC 22,164,000 0 0 0 11.25 11.59 (69,000) 329,000 Columbia, SC 5,028,000 0 0 0 21.78 23.81 (48,000) (2,000) Dallas/Fort Worth, TX 46,212,000 0 0 0 22.46 23.12 (304,000) (261,000) Ft. Lauderdale/Broward Co., FL 8,236,000 0 0 0 17.48 17.33 12,000 (47,000) Greenville, SC 3,184,000 0 0 0 18.81 18.35 15,000 7,000 Houston, TX 37,642,000 845,000 1,817,000 0 16.37 16.04 20,000 6,000 Jacksonville, FL 15,973,000 0 0 0 13.85 13.06 89,000 102,000 Little Rock, AR 6,538,000 (39,000) (39,000) 0 15.76 16.29 (29,000) (29,000) Louisville, KY 16,253,000 0 0 80,000 10.49 10.33 26,000 6,000 Memphis, TN 7,869,000 0 0 0 19.03 19.28 (20,000) (32,000) Miami-Dade, FL 17,485,000 0 0 615,000 20.43 19.56 153,000 225,000 Nashville, TN 7,857,000 0 0 90,000 22.23 22.30 32,000 83,000 Orlando, FL 12,605,000 0 105,000 0 13.49 14.30 (102,000) (7,000) Raleigh/Durham/Chapel Hill, NC 11,472,000 0 0 324,000 6.30 6.62 (37,000) (54,000) Savannah, GA 747,000 0 0 70,000 16.34 15.26 9,000 7,000 Tampa, FL 8,595,000 0 0 0 15.62 15.35 23,000 96,000 West Palm Beach/Palm Beach Co., FL 10,148,000 0 0 0 19.58 19.30 29,000 41,000 SOUTH TOTAL/AVERAGE 288,891,000 806,000 1,884,000 1,179,000 16.88 16.93 (170,000) 70,000 P. 2 | COLLIERS INTERNATIONAL
  • 3. HIGHLIGHTS | Q2 2011 | OFFICE | NORTH AMERICA UNITED STATES | DOWNTOWN OFFICE | ALL INVENTORY EXISTING NEW SUPPLY NEW SUPPLY UNDER VACANCY VACANCY ABSORPTION ABSORPTION INVENTORY (SF) Q2 2011 YTD 2011 CONSTRUCTION RATE (%) RATE (%) Q2 2011 YTD 2011 MARKET JUNE 30, 2011 (SF) (SF) (SF) MAR. 31, 2011 JUNE 30, 2011 (SF) (SF) MIDWEST Chicago, IL 158,464,000 0 0 0 14.83 14.53 473,000 560,000 Cincinnati, OH 19,342,000 0 805,000 0 18.93 18.96 (6,000) 116,000 Cleveland, OH 34,223,000 0 0 475,000 19.64 19.38 (68,000) (335,000) Columbus, OH 19,091,000 0 0 0 11.58 11.49 16,000 74,000 Detroit, MI 31,147,000 0 0 0 18.46 17.82 257,000 293,000 Grand Rapids, MI 5,404,000 0 0 0 24.63 23.87 17,000 24,000 Indianapolis, IN 70,827,000 0 23,000 0 11.43 10.69 528,000 417,000 Kansas City, MO-KS 34,342,000 0 0 0 13.23 13.65 (141,000) 66,000 Minneapolis, MN 30,731,000 0 0 0 16.61 15.24 440,000 353,000 Omaha, NE 6,747,000 0 0 0 7.44 8.98 (49,000) (59,000) St. Louis, MO 27,203,000 61,000 61,000 363,000 17.97 18.46 (127,000) (320,000) St Paul, MN 10,166,000 0 0 0 14.87 14.85 1,000 (55,000) MIDWEST TOTAL/AVERAGE 447,688,000 61,000 890,000 838,000 15.15 14.84 1,341,000 1,135,000 WEST Bakersfield, CA 2,986,000 0 0 0 9.97 10.03 (2,000) 28,000 Boise, ID 3,473,000 0 0 0 11.70 11.62 3,000 11,000 Denver, CO 30,979,000 0 0 270,000 13.89 14.14 (77,000) (33,000) Fresno, CA 3,263,000 0 0 0 12.14 11.29 28,000 5,000 Honolulu, HI 8,074,000 0 0 0 12.08 12.35 (22,000) (5,000) Las Vegas, NV 3,860,000 0 0 300,000 12.79 13.77 (37,000) (33,000) Los Angeles, CA 33,368,000 0 0 0 17.44 18.59 (384,000) (446,000) Oakland, CA 16,892,000 0 0 659,000 12.39 12.39 0 (40,000) Phoenix, AZ 19,500,000 0 0 0 21.82 21.20 121,000 (61,000) Pleasanton/Walnut Creek, CA 12,273,000 0 0 0 17.06 19.80 (337,000) (379,000) Portland, OR 33,649,000 0 0 195,000 8.82 8.94 (41,000) 37,000 Reno, NV 1,326,000 0 0 0 28.05 22.91 68,000 44,000 Sacramento, CA 18,239,000 0 0 155,000 10.40 10.59 (35,000) (82,000) San Diego County, CA 10,252,000 0 0 0 20.53 20.55 (2,000) (119,000) San Francisco, CA 85,635,000 0 0 288,000 14.22 13.51 560,000 1,047,000 San Jose/Silicon Valley, CA 7,593,000 0 0 0 25.34 24.12 44,000 (90,000) Seattle/Puget Sound, WA 58,346,000 600,000 1,446,000 497,000 16.46 15.01 743,000 463,000 Stockton/San Joaquin County, CA 8,345,000 0 0 0 19.49 18.95 45,000 (39,000) WEST TOTAL/AVERAGE 358,052,000 600,000 1,446,000 2,365,000 15.02 14.78 676,000 309,000 U.S. TOTAL/AVERAGE 1,962,619,000 1,518,000 4,821,000 23,194,000 14.18 13.84 6,539,000 7,741,000 COLLIERS INTERNATIONAL | P. 3
  • 4. HIGHLIGHTS | Q2 2011 | OFFICE | NORTH AMERICA UNITED STATES | DOWNTOWN OFFICE | CLASS A AVERAGE ANNUAL QUARTERLY ANNUAL EXISTING VACANCY VACANCY ABSORPTION ABSORPTION QUOTED RENT CHANGE IN CHANGE IN INVENTORY (SF) RATE (%) RATE (%) Q2 2011 YTD 2011 (USD PDF) RENT RENT MARKET JUNE 30, 2011 MAR. 31, 2011 JUNE 30, 2011 (SF) (SF) JUNE 30, 2011 (%) (%) NORTHEAST Baltimore, MD 15,753,000 18.50 19.00 (79,000) 86,000 24.10 -4.5 -0.5 Boston, MA 41,218,000 16.05 15.81 139,000 13,000 45.60 -0.5 0.3 Hartford, CT 6,383,000 22.44 22.13 12,000 16,000 23.00 0.1 -1.0 New York, NY – Downtown Manhattan 75,928,000 15.21 14.42 1,647,000 2,054,000 37.70 -2.1 -2.3 New York, NY – Midtown Manhattan 193,066,000 13.08 12.86 427,000 97,000 64.40 1.7 2.6 New York, NY – Midtown S. Manhattan 33,457,000 9.55 8.94 204,000 807,000 47.90 1.2 9.3 Philadelphia, PA 32,897,000 11.82 11.71 35,000 142,000 26.10 -0.1 0.0 Pittsburgh, PA 17,542,000 9.25 8.41 147,000 178,000 21.70 – – Stamford, CT 12,899,000 18.83 17.01 105,000 87,000 37.60 -2.6 1.5 Washington, DC 82,854,000 13.81 12.55 898,000 1,675,000 55.20 4.3 7.7 White Plains, NY 9,045,000 16.32 16.74 26,000 (361,000) 30.20 0.7 – NORTHEAST TOTAL/AVERAGE 521,043,000 13.78 13.27 3,562,000 4,793,000 49.66 SOUTH Atlanta, GA 28,893,000 20.07 20.20 (37,000) 254,000 22.50 -1.2 2.7 Charleston, SC 1,102,000 7.59 6.83 8,000 28,000 29.00 0.9 19.8 Charlotte, NC 16,112,000 12.87 13.27 (61,000) 341,000 24.20 0.7 -8.9 Columbia, SC 2,005,000 15.38 17.30 (10,000) (8,000) 19.50 0.1 -0.9 Dallas/Fort Worth, TX 28,005,000 19.39 20.11 (202,000) (214,000) 25.30 0.0 0.0 Ft. Lauderdale/Broward Co., FL 4,464,000 25.35 25.26 4,000 (39,000) 31.80 -1.1 -3.1 Greenville, SC 1,916,000 7.59 11.46 (17,000) (5,000) 20.30 -1.3 -1.0 Houston, TX 26,964,000 12.97 12.53 32,000 (1,000) 34.20 -0.1 -4.8 Jacksonville, FL 6,685,000 14.96 15.59 (73,000) (61,000) 19.80 4.8 -0.9 Little Rock, AR 2,636,000 11.40 12.22 (22,000) (19,000) 15.50 -6.9 -6.4 Louisville, KY 3,956,000 8.83 9.05 (2,000) 50,000 21.00 2.8 -5.3 Memphis, TN 1,938,000 26.09 27.31 (24,000) (25,000) 16.70 -4.0 -2.2 Miami-Dade, FL 9,058,000 23.42 22.26 105,000 171,000 41.20 -0.7 -2.0 Nashville, TN 3,845,000 22.87 23.71 13,000 37,000 21.90 -3.3 -1.7 Orlando, FL 5,674,000 17.18 19.04 (106,000) (3,000) 24.10 5.1 -0.9 Raleigh/Durham/Chapel Hill, NC 4,597,000 8.39 9.17 (36,000) (56,000) 21.70 -9.8 -4.6 Savannah, GA 570,000 13.14 11.99 6,000 (1,000) 18.90 – – Tampa, FL 4,809,000 16.59 16.82 (11,000) (79,000) 22.70 0.7 -0.5 West Palm Beach/Palm Beach Co., FL 3,379,000 23.10 22.71 13,000 9,000 37.20 0.9 -0.9 SOUTH TOTAL/AVERAGE 156,609,000 17.03 17.29 (421,000) 380,000 26.48 P. 4 | COLLIERS INTERNATIONAL
  • 5. HIGHLIGHTS | Q2 2011 | OFFICE | NORTH AMERICA UNITED STATES | DOWNTOWN OFFICE | CLASS A AVERAGE ANNUAL QUARTERLY ANNUAL EXISTING VACANCY VACANCY ABSORPTION ABSORPTION QUOTED RENT CHANGE IN CHANGE IN INVENTORY (SF) RATE (%) RATE (%) Q2 2011 YTD 2011 (USD PDF) RENT RENT MARKET JUNE 30, 2011 MAR. 31, 2011 JUNE 30, 2011 (SF) (SF) JUNE 30, 2011 (%) (%) MIDWEST Chicago, IL 60,487,000 15.84 15.70 84,000 115,000 33.00 1.5 3.1 Cincinnati, OH 8,867,000 22.34 19.23 275,000 238,000 23.20 8.7 6.2 Cleveland, OH 9,728,000 13.73 13.71 (25,000) (90,000) 20.70 -2.0 0.2 Columbus, OH 7,840,000 13.01 13.43 (32,000) (28,000) 19.00 -1.1 -7.2 Detroit, MI 11,468,000 17.31 14.83 285,000 286,000 22.60 -1.9 -0.2 Grand Rapids, MI 1,525,000 18.81 18.02 0 5,000 19.90 -10.0 -16.6 Indianapolis, IN 9,395,000 14.04 12.66 130,000 71,000 19.10 -0.4 – Kansas City, MO-KS 10,473,000 17.72 17.90 (19,000) 183,000 19.50 -0.1 -6.7 Minneapolis, MN 13,826,000 13.91 13.34 44,000 54,000 14.60 -3.4 -5.0 Omaha, NE 3,418,000 3.88 4.32 5,000 (25,000) 18.80 – – St. Louis, MO 10,481,000 14.84 14.73 20,000 (38,000) 18.00 -2.9 -6.9 St. Paul, MN 3,073,000 9.54 9.90 (11,000) 16,000 14.20 -0.7 1.4 MIDWEST TOTAL/AVERAGE 150,580,000 15.45 14.92 756,000 787,000 24.73 WEST Bakersfield, CA 670,000 6.28 5.75 4,000 4,000 17.40 0.0 0.0 Boise, ID 2,038,000 4.69 5.75 (22,000) (13,000) 18.00 0.0 0.0 Denver, CO 19,243,000 12.64 12.64 31,000 123,000 27.50 1.7 3.7 Fresno, CA 1,039,000 11.83 11.28 6,000 (18,000) 24.60 0.0 0.0 Honolulu, HI 4,709,000 12.62 13.27 (31,000) (48,000) 35.40 1.0 -1.3 Las Vegas, NV 808,000 8.95 11.26 (14,000) (14,000) 32.30 -7.2 -7.5 Los Angeles, CA 17,734,000 14.15 15.92 (313,000) (218,000) 38.50 0.0 -0.9 Oakland, CA 10,198,000 9.93 10.49 (57,000) (55,000) 30.70 -1.5 -0.8 Phoenix, AZ 9,536,000 22.49 22.30 18,000 (67,000) 23.90 -0.7 -6.6 Pleasanton/Walnut Creek, CA 7,950,000 18.57 19.36 (63,000) (76,000) 26.20 -5.2 -0.5 Portland, OR 13,094,000 6.96 6.81 20,000 150,000 24.80 -2.4 2.4 Reno, NV 548,000 20.38 21.10 (4,000) (8,000) 22.60 -3.6 -4.1 Sacramento, CA 8,912,000 10.10 9.75 32,000 24,000 32.40 0.7 -1.9 San Diego County, CA 7,254,000 18.30 18.89 (43,000) (127,000) 28.70 0.0 -4.0 San Francisco, CA 52,333,000 14.48 14.01 296,000 659,000 36.90 2.6 10.8 San Jose/Silicon Valley, CA 3,365,000 31.24 30.91 (27,000) (49,000) 31.90 -1.5 -9.8 Seattle/Puget Sound, WA 32,337,000 21.19 18.83 635,000 299,000 29.70 1.8 7.4 Stockton/San Joaquin County, CA 2,774,000 27.96 27.64 9,000 (2,000) 21.60 0.0 4.9 WEST TOTAL/AVERAGE 194,542,000 15.41 15.14 477,000 564,000 31.45 U.S. TOTAL/AVERAGE 1,022,774,000 14.83 14.48 4,375,000 6,524,000 39.00 weighted -1.45 1.16 27.10 equal -3.64 -4.42 COLLIERS INTERNATIONAL | P. 5
  • 6. HIGHLIGHTS | Q2 2011 | OFFICE | NORTH AMERICA Demand for Office Space Still Subdued, EMPLOYMENT, PROFESSIONAL & BUSINESS SERVICES But Q2 Better than Q1 90 Continued from page 1 80 Month to Month Change, thousands ably strong during the AprilJune period, with professional and business 70 employment in particular up 2.9 percent year-over-year (June). Widespread increases in rents are unlikely to occur in 2011 and may not materialize until 60 well into 2012. 50 40 Downtown markets push U.S. office vacancy rate lower. The U.S. national office vacancy rate fell slightly during the second quarter, shifting 12 basis 30 points lower (100 basis points equals one percent) on a sharp drop in down- 20 town vacancies. The U.S. office vacancy rate finished the quarter at 15.28 percent—back on track to finish the year below 15.00 percent. During the 10 second quarter, downtown vacancies fell by 34 basis points to register 13.84 0 percent, while the suburban office vacancy rate held steady at 16.00 per- cent. Over the past 12 months, the U.S. national office vacancy rate has -10 Jan Feb Mar Apr May Jun Jul Aug Sep Oct Nov Dec Jan Feb Mar Apr May Jun fallen 36 basis points. This quarter, the flight to quality was particularly evi- dent in Class A vacancies, which shrunk 28 basis points. Canadian office 2010 2011 vacancy rates fell in most markets with central business district (CBD) Source: U.S. Bureau of Labor Statistics va¬cancies falling 65 basis points to 6.13 percent, and suburban vacancies decreasing 32 basis points to 8.46 percent. ABSORPTION (SF) | SELECT DOWNTOWN MARKETS | Q2 2011 Office absorption positive for fifth consecutive quarter. The U.S. office 0 500,000 1,000,000 1,500,000 2,000,000 market registered a fifth consecutive quarter of rising occupancy. Second- quarter absorption came in at 9.9 million square feet (MSF)—a significant Downtown Manhattan improvement from the first quarter when occupied space increased by 4.2 Midtown S. Manhattan MSF, and slightly more than twice the absorption recorded a year ago when occupied space expanded by 4.9 MSF. Continuing a trend seen over the past Midtown Manhattan few quarters, Class A buildings continued to attract “move-up” tenants: Class A absorption totaled 8.5 MSF, or nearly 86 percent of overall absorp- Seattle tion. Canadian markets also recorded an increase in occupied space during the second quarter, with absorption totaling 3.6 MSF. This was a healthy Washington, DC increase from the 2.6 MSF recorded in the first quarter. San Francisco Rents take a further down-leg after showing signs of stabilizing. After a small increase in the first quarter, both CBD and suburban rents drifted Boston lower in the most recent three-month period. Second-quarter data shows Class A CBD rents decreased by 1.5 percent to average $38.98 per square Philadelphia foot. Class A suburban also moved lower, dropping 0.7 percent to average $26.06 per square foot. Of the 57 downtown markets tracked, 30 saw rents decrease, 20 saw rents increase and seven held steady. In the 58 suburban ABSORPTION (SF) | SELECT SUBURBAN MARKETS | Q2 2011 markets tracked, rents dropped in 28, rose in 24, and held steady in the re- maining six. Canadian downtown office rents moved higher during Q1 with 0 100,000 200,000 300,000 400,000 500,000 600,000 700,000 Class A CBD rents increasing 0.4 percent while suburban Class A rents San Jose/Silicon Valley decreased 1.3 percent. Dallas Office construction returns to record-low levels. After a modest increase in the first quarter, second-quarter office completions totaled just 3.9 MSF— Atlanta returning to levels recorded during the fourth quarter of 2010. It should also be noted that just four markets accounted for almost 60 percent of Q2 new San Diego supply: downtown Houston (845,000 SF), downtown Seattle (600,000 SF), suburban Baltimore (425,000 SF), and suburban Miami (422,000 SF). San Francisco Peninsula Construction underway increased by almost 14 MSF relative to the first quarter, with 39.4 MSF in various stages of development at the end of the Denver second quarter. Most of this increase was due to construction associated with the World Trade Center site in Lower Manhattan. The Canadian office Houston market had a modest level of new construction during the second quarter, Raleigh/Durham adding 1.1 MSF square feet with another 7.0 MSF underway. P. 6 | COLLIERS INTERNATIONAL
  • 7. HIGHLIGHTS | Q2 2011 | OFFICE | NORTH AMERICA UNITED STATES | SUBURBAN OFFICE | ALL INVENTORY EXISTING NEW SUPPLY NEW SUPPLY UNDER VACANCY VACANCY ABSORPTION ABSORPTION INVENTORY (SF) Q2 2011 YTD 2011 CONSTRUCTION RATE (%) RATE (%) Q2 2011 YTD 2011 MARKET JUNE 30, 2011 (SF) (SF) (SF) MAR. 31, 2011 JUNE 30, 2011 (SF) (SF) NORTHEAST Baltimore, MD 64,083,000 425,000 612,000 1,203,000 15.06 14.93 461,000 474,000 Boston, MA 106,368,000 0 0 59,000 19.43 19.46 (113,000) (44,000) Fairfield County, CT 57,808,000 0 18,000 0 13.80 13.61 726,000 959,000 Hartford, CT 12,394,000 0 0 0 14.45 15.40 (139,000) (58,000) Long Island, NY 71,299,000 31,000 31,000 149,000 10.69 11.05 (258,000) (27,000) New Jersey – Central 104,219,000 25,000 51,000 468,000 15.48 15.81 (349,000) (600,000) New Jersey – Northern 138,766,000 0 0 383,000 14.27 14.88 (851,000) (920,000) Philadelphia, PA 109,166,000 0 0 285,000 15.74 15.73 9,000 514,000 Pittsburgh, PA 92,366,000 0 0 181,000 8.27 8.07 184,000 473,000 Washington, DC 311,930,000 125,000 195,000 3,562,000 13.96 14.15 (545,000) (852,000) Westchester County, NY 41,078,000 0 0 0 10.70 10.82 (81,000) (38,000) NORTHEAST TOTAL/AVERAGE 1,109,476,000 606,000 907,000 6,290,000 14.10 14.27 (958,000) (120,000) SOUTH Atlanta, GA 168,014,000 0 19,000 617,000 18.11 17.89 376,000 765,000 Charleston, SC 9,502,000 0 0 0 17.19 16.82 35,000 198,000 Charlotte, NC 72,792,000 369,000 374,000 534,000 13.68 13.55 308,000 557,000 Columbia, SC 4,655,000 0 0 0 20.86 19.64 36,000 40,000 Dallas/Fort Worth, TX 259,944,000 129,000 179,000 723,000 16.69 16.49 619,000 973,000 Ft. Lauderdale/Broward Co., FL 43,861,000 0 0 0 14.57 14.18 172,000 210,000 Greenville, SC 4,560,000 0 0 14,000 21.97 22.47 (35,000) 75,000 Houston, TX 159,274,000 22,000 22,000 781,000 15.76 15.85 62,000 453,000 Jacksonville, FL 44,109,000 0 0 15,000 14.50 14.23 222,000 523,000 Little Rock, AR 7,399,000 36,000 36,000 186,000 10.88 10.70 8,000 27,000 Louisville, KY 35,898,000 3,000 57,000 197,000 15.89 16.73 (161,000) 385,000 Memphis, TN 28,088,000 12,000 82,000 0 13.40 13.39 14,000 60,000 Miami-Dade, FL 63,501,000 422,000 512,000 258,000 15.00 15.35 (35,000) 101,000 Nashville, TN 25,734,000 0 0 389,000 9.83 9.71 123,000 191,000 Orlando, FL 55,396,000 82,000 82,000 412,000 16.03 15.70 255,000 402,000 Raleigh/Durham/Chapel Hill, NC 66,214,000 102,000 102,000 70,000 13.66 13.73 6,000 176,000 Savannah, GA 1,505,000 0 0 0 21.31 24.19 (59,000) (89,000) Tampa, FL 71,313,000 0 0 107,000 16.28 16.35 (52,000) (224,000) West Palm Beach/Palm Beach Co., FL 29,059,000 0 73,000 32,000 21.01 20.23 227,000 359,000 SOUTH TOTAL/AVERAGE 1,150,817,000 1,178,000 1,540,000 4,333,000 15.95 15.86 2,122,000 5,181,000 P. 7 | COLLIERS INTERNATIONAL
  • 8. HIGHLIGHTS | Q2 2011 | OFFICE | NORTH AMERICA UNITED STATES | SUBURBAN OFFICE | ALL INVENTORY EXISTING NEW SUPPLY NEW SUPPLY UNDER VACANCY VACANCY ABSORPTION ABSORPTION INVENTORY (SF) Q2 2011 YTD 2011 CONSTRUCTION RATE (%) RATE (%) Q2 2011 YTD 2011 MARKET JUNE 30, 2011 (SF) (SF) (SF) MAR. 31, 2011 JUNE 30, 2011 (SF) (SF) MIDWEST Chicago, IL 153,141,000 0 0 416,000 17.91 19.02 (1,707,000) (1,639,000) Cincinnati, OH 34,463,000 0 16,000 195,000 20.92 21.06 (51,000) 85,000 Cleveland, OH 92,374,000 57,000 71,000 1,361,000 10.33 10.44 0 (141,000) Columbus, OH 43,748,000 0 65,000 210,000 14.13 13.67 199,000 126,000 Detroit, MI 100,009,000 24,000 51,000 24,000 21.74 21.27 481,000 364,000 Grand Rapids, MI 11,538,000 0 0 0 22.74 22.73 1,000 14,000 Indianapolis, IN 47,592,000 0 12,000 0 11.61 11.39 102,000 83,000 Kansas City, MO-KS 55,744,000 30,000 96,000 43,000 13.75 13.61 102,000 205,000 Minneapolis, MN 38,176,000 0 0 0 17.78 17.13 272,000 372,000 Omahan, NE 20,299,000 36,000 351,000 0 12.91 12.93 164,000 211,000 St. Louis, MO 55,087,000 0 0 0 12.55 13.06 (250,000) (1,214,000) St. Paul, MN 12,244,000 0 0 0 14.64 17.38 (340,000) (410,000) MIDWEST TOTAL/AVERAGE 664,415,000 146,000 662,000 2,248,000 15.96 16.17 (1,027,000) (1,945,000) WEST Bakersfield, CA 5,969,000 0 0 9,000 10.08 9.90 10,000 (4,000) Boise, ID 10,867,000 0 0 16,000 21.93 21.83 10,000 30,000 Denver, CO 101,418,000 0 286,000 30,000 15.61 15.41 230,000 451,000 Fairfield, CA 4,269,000 0 0 0 27.22 25.78 61,000 (42,000) Fresno, CA 17,885,000 56,000 86,000 60,000 13.42 13.43 47,000 75,000 Honolulu, HI 7,510,000 0 0 0 12.27 11.83 43,000 (21,000) Las Vegas, NV 34,798,000 0 175,000 12,000 26.85 26.56 75,000 (87,000) Los Angeles – Inland Empire, CA 21,667,000 0 0 0 25.67 25.00 147,000 (25,000) Los Angeles, CA 171,405,000 0 191,000 1,001,000 18.04 18.25 (356,000) (872,000) Oakland, CA 15,877,000 0 0 0 19.41 19.81 (63,000) (382,000) Orange County, CA 79,234,000 0 0 0 21.26 20.60 520,000 809,000 Phoenix, AZ 109,114,000 165,000 348,000 553,000 22.50 22.56 67,000 16,000 Pleasanton/Walnut Creek, CA 32,932,000 0 0 0 16.12 17.06 (310,000) (890,000) Portland, OR 43,993,000 0 63,000 505,000 13.35 13.12 754,000 1,770,000 Reno, NV 5,546,000 0 0 0 18.64 18.50 (50,000) (47,000) Sacramento, CA 72,863,000 0 80,000 125,000 19.48 19.36 84,000 (192,000) San Diego County, CA 68,075,000 0 0 87,000 15.64 15.07 359,000 683,000 San Francisco Peninsula, CA 35,175,000 0 0 0 15.24 14.26 347,000 932,000 San Jose/Silicon Valley, CA 53,989,000 0 0 578,000 18.90 17.97 636,000 1,052,000 Seattle/Puget Sound, WA 74,073,000 223,000 223,000 331,000 14.25 13.38 615,000 13,000 WEST TOTAL/AVERAGE 966,658,000 444,000 1,453,000 3,308,000 18.29 18.04 3,224,000 3,270,000 U.S. TOTAL/AVERAGE 3,891,366,000 2,374,000 4,561,000 16,180,000 16.00 16.00 3,361,000 6,386,000 COLLIERS INTERNATIONAL | P. 8
  • 9. HIGHLIGHTS | Q2 2011 | OFFICE | NORTH AMERICA UNITED STATES | SUBURBAN OFFICE | CLASS A AVERAGE ANNUAL QUARTERLY ANNUAL EXISTING VACANCY VACANCY ABSORPTION ABSORPTION QUOTED RENT CHANGE IN CHANGE IN INVENTORY (SF) RATE (%) RATE (%) Q2 2011 YTD 2011 (USD PDF) RENT RENT MARKET JUNE 30, 2011 MAR. 31, 2011 JUNE 30, 2011 (SF) (SF) JUNE 30, 2011 (%) (%) NORTHEAST Baltimore, MD 26,510,000 16.33 15.89 368,000 602,000 25.40 1.3 -3.4 Boston, MA 44,568,000 18.20 17.58 191,000 164,000 25.90 -1.0 -1.9 Fairfield County, CT 30,147,000 15.17 14.59 534,000 440,000 34.60 -1.2 11.8 Hartford, CT 7,486,000 14.23 16.05 (146,000) (192,000) 20.60 0.5 0.6 Long Island, NY 24,252,000 12.22 12.68 (113,000) 5,000 29.90 0.8 New Jersey – Central 62,479,000 16.75 17.19 (278,000) (281,000) 23.10 1.3 -3.6 New Jersey – Northern 83,883,000 14.36 14.36 1,000 (218,000) 24.00 -3.0 -1.7 Philadelphia, PA 67,344,000 15.47 15.36 71,000 557,000 24.00 -0.1 -0.9 Pittsburgh, PA 16,833,000 44.84 43.71 190,000 218,000 21.70 – – Washington, DC 161,411,000 15.88 15.50 460,000 462,000 31.30 -0.3 1.7 Westchester County, NY 18,445,000 13.23 13.45 (37,000) 22,000 27.60 0.6 0.5 NORTHEAST TOTAL/AVERAGE 543,357,000 16.49 16.33 1,239,000 1,778,000 27.12 – – SOUTH Atlanta, GA 77,627,000 17.83 17.35 368,000 927,000 21.80 -0.4 0.0 Charleston, SC 4,475,000 13.96 13.23 33,000 117,000 23.10 0.0 – Charlotte, NC 18,629,000 16.40 16.86 146,000 295,000 20.30 0.6 -0.4 Columbia, SC 888,000 16.31 16.54 (2,000) 33,000 16.80 -3.1 -0.8 Dallas/Fort Worth, TX 91,918,000 18.15 18.00 200,000 367,000 24.80 0.0 0.0 Ft. Lauderdale/Broward Co., FL 10,794,000 20.90 20.42 53,000 7,000 28.50 -0.1 1.2 Greenville, SC 1,931,000 18.90 21.12 (43,000) (51,000) 18.10 2.7 1.7 Houston, TX 70,015,000 16.56 16.17 261,000 799,000 26.60 -1.0 -2.6 Jacksonville, FL 9,241,000 12.25 7.98 20,000 167,000 20.40 3.9 0.1 Little Rock, AR 2,689,000 15.42 15.43 0 13,000 18.50 -0.2 -0.2 Louisville, KY 6,893,000 17.65 20.74 9,000 361,000 20.00 0.2 0.0 Memphis, TN 7,963,000 9.19 9.01 14,000 (11,000) 21.30 -0.3 0.2 Miami-Dade, FL 15,532,000 21.35 23.08 (106,000) 88,000 31.70 -0.8 -3.6 Nashville, TN 13,989,000 7.73 7.42 116,000 122,000 22.40 0.1 0.3 Orlando, FL 17,265,000 20.13 19.47 113,000 97,000 22.30 -1.7 -2.4 Raleigh/Durham/Chapel Hill, NC 25,631,000 16.04 15.84 10,000 236,000 21.70 0.3 1.4 Savannah, GA 490,000 26.39 26.44 2,000 (26,000) 22.30 – – Tampa, FL 23,615,000 18.01 18.38 (88,000) (135,000) 23.30 0.8 -2.3 West Palm Beach/Palm Beach Co., FL 9,178,000 19.49 18.29 110,000 212,000 30.10 -0.4 -1.7 SOUTH TOTAL/AVERAGE 408,763,000 17.17 16.96 1,217,000 3,619,000 23.98 P. 9 | COLLIERS INTERNATIONAL
  • 10. HIGHLIGHTS | Q2 2011 | OFFICE | NORTH AMERICA UNITED STATES | SUBURBAN OFFICE | CLASS A AVERAGE ANNUAL QUARTERLY ANNUAL EXISTING VACANCY VACANCY ABSORPTION ABSORPTION QUOTED RENT CHANGE IN CHANGE IN INVENTORY (SF) RATE (%) RATE (%) Q2 2011 YTD 2011 (USD PDF) RENT RENT MARKET JUNE 30, 2011 MAR. 31, 2011 JUNE 30, 2011 (SF) (SF) JUNE 30, 2011 (%) (%) MIDWEST Chicago, IL 75,187,000 18.61 20.22 (1,206,000) (904,000) 27.00 -1.2 -1.8 Cincinnati, OH 16,602,000 19.98 19.46 85,000 172,000 21.50 6.4 4.9 Cleveland, OH 12,922,000 12.65 11.75 79,000 3,000 21.50 -0.2 -2.0 Columbus, OH 17,837,000 12.34 11.95 69,000 (21,000) 18.30 5.7 -2.0 Detroit, MI 25,723,000 19.62 18.55 280,000 172,000 21.70 -2.2 -3.2 Grand Rapids, MI 2,180,000 42.43 29.89 5,000 3,000 19.20 2.8 -8.2 Indianapolis, IN 12,580,000 15.02 14.57 57,000 39,000 18.50 -0.3 – Kansas City, MO-KS 15,038,000 14.85 14.21 97,000 104,000 20.60 0.0 -4.1 Minneapolis, MN 16,158,000 18.38 16.04 320,000 427,000 14.60 -0.7 -5.6 Omaha, NE 4,340,000 7.13 7.02 13,000 365,000 25.50 – – St. Louis, MO 25,880,000 14.10 14.48 (68,000) (684,000) 22.20 1.6 -5.2 St. Paul, MN 3,013,000 15.61 18.10 (61,000) (112,000) 15.00 0.3 -3.2 MIDWEST TOTAL/AVERAGE 227,460,000 16.99 17.00 (330,000) (438,000) 22.42 WEST Bakersfield, CA 2,698,000 6.55 6.24 8,000 13,000 24.00 0.0 0.0 Boise, ID 4,684,000 24.15 23.74 19,000 0 18.00 0.0 0.0 Denver, CO 33,163,000 13.41 12.81 187,000 628,000 21.90 1.9 2.6 Fairfield, CA 1,795,000 28.95 27.86 20,000 (63,000) 25.10 -1.9 -7.5 Fresno, CA 3,851,000 17.91 17.74 7,000 34,000 25.20 0.0 0.0 Las Vegas, NV 4,923,000 37.96 37.93 (32,000) (15,000) 30.70 -2.1 -6.5 Los Angeles – Inland Empire, CA 4,970,000 31.95 30.91 52,000 49,000 23.40 -3.0 -10.1 Los Angeles, CA 102,537,000 18.43 18.52 (98,000) (345,000) 34.20 -1.0 -2.1 Oakland, CA 3,582,000 29.10 24.59 162,000 78,000 26.40 1.9 -7.2 Orange County, CA 32,936,000 23.58 22.37 399,000 415,000 25.80 -0.9 -5.7 Phoenix, AZ 30,975,000 26.04 26.19 76,000 312,000 23.70 -0.2 -3.8 Pleasanton/Walnut Creek, CA 15,978,000 14.48 15.92 (230,000) (124,000) 25.70 12.6 1.9 Portland, OR 11,086,000 14.37 15.00 (70,000) 120,000 23.60 1.6 1.7 Reno, NV 3,001,000 17.68 17.51 (50,000) (64,000) 20.50 3.0 2.4 Sacramento, CA 16,341,000 25.04 24.49 89,000 298,000 23.20 -1.6 -6.0 San Diego County, CA 23,892,000 15.87 14.05 408,000 696,000 31.10 -1.5 -4.8 San Francisco Peninsula, CA 22,246,000 13.82 12.07 390,000 972,000 34.80 5.1 9.0 San Jose/Silicon Valley, CA 26,166,000 20.86 19.78 490,000 1,061,000 35.20 3.2 -2.0 Seattle/Puget Sound, WA 26,938,000 16.99 16.37 158,000 (162,000) 26.70 -2.9 0.9 WEST TOTAL/AVERAGE 371,761,000 19.26 18.78 1,984,000 3,904,000 28.89 U.S. TOTAL/AVERAGE 1,551,341,000 17.41 17.18 4,110,000 8,863,000 26.00 weighted -0.66 -0.81 24.00 equal -1.46 -3.13 COLLIERS INTERNATIONAL | P. 10
  • 11. HIGHLIGHTS | Q2 2011 | OFFICE | NORTH AMERICA CANADA | DOWNTOWN OFFICE | ALL INVENTORY EXISTING NEW SUPPLY NEW SUPPLY UNDER VACANCY VACANCY ABSORPTION ABSORPTION INVENTORY (SF) Q2 2011 YTD 2011 CONSTRUCTION RATE (%) RATE (%) Q2 2011 YTD 2011 MARKET JUNE 30, 2011 (SF) (SF) (SF) MAR. 31, 2011 JUNE 30, 2011 (SF) (SF) Calgary, AB 37,809,000 0 0 1,940,000 10.92 7.79 1,184,000 1,577,000 Edmonton, AB 11,257,000 625,000 625,000 0 7.60 11.36 151,000 184,000 Guelph, ON 383,000 0 0 55,000 13.78 13.35 2,000 (4,000) Halifax, NS 4,659,000 0 0 0 6.81 7.68 (32,000) 0 Montreal, QC 49,429,000 0 0 0 7.37 6.89 239,000 167,000 Ottawa, ON 14,992,000 0 0 550,000 5.63 5.39 36,000 35,000 Regina, SK 3,549,000 0 0 200,000 1.84 1.49 12,000 2,000 Saskatoon, SK 2,099,000 0 20,000 147,000 4.56 5.39 18,000 41,000 Toronto, ON 88,614,000 0 0 645,000 5.47 4.60 945,000 1,873,000 Vancouver, BC 24,295,000 58,000 58,000 72,000 3.71 3.76 (14,000) 201,000 Victoria, BC 4,910,000 0 0 0 8.39 9.04 (32,000) (32,000) Winnipeg, MB 11,139,000 0 0 0 6.82 7.25 (48,000) (10,000) Waterloo Region, ON 3,578,000 0 0 176,000 13.32 13.74 (7,000) 7,000 CANADA TOTAL/AVERAGE 256,712,000 683,000 703,000 3,784,000 6.78 6.13 1,570,000 1,570,000 CANADA | DOWNTOWN OFFICE | CLASS A VACANCY VACANCY AVERAGE ANNUAL QUARTERLY ANNUAL EXISTING RATE (%) RATE (%) ABSORPTION ABSORPTION QUOTED RENT CHANGE CHANGE INVENTORY (SF) MAR. 31, JUNE 30, Q2 2011 YTD 2011 (CAD PSF) IN RENT IN RENT MARKET JUNE 30, 2011 2011 2011 (SF) (SF) JUNE 30, 2011 (%) (%) Calgary, AB 24,787,000 8.78 4.82 981,000 1,233,000 44.00 11.3 11.3 Edmonton, AB 8,879,000 7.23 9.87 346,000 346,000 39.20 -0.2 -4.7 Guelph, ON 203,000 0.00 0.00 0 14,000 27.40 0.0 Halifax, NS 1,928,000 6.70 6.53 6,000 (3,000) 32.40 0.1 2.7 Montreal, QC 23,076,000 7.29 6.65 147,000 197,000 37.00 0.0 15.6 Ottawa, ON 9,001,000 6.60 5.94 60,000 63,000 48.60 0.5 0.3 Regina, SK 1,031,000 1.52 1.52 0 (5,000) 37.10 0.0 6.7 Saskatoon, SK 492,000 0.21 0.00 1,000 1,000 34.00 0.0 7.9 Toronto, ON 42,102,000 5.99 4.94 606,000 1,177,000 52.40 -5.8 -2.1 Vancouver, BC 9,901,000 2.40 2.38 0 40,000 53.80 0.5 3.4 Victoria, BC 821,000 16.59 14.61 10,000 10,000 37.80 – – Winnipeg, MB 2,619,000 6.59 6.11 13,000 13,000 30.00 0.0 – Waterloo Region, ON 1,425,000 8.20 8.26 (1,000) 25,000 25.70 11.1 -3.5 CANADA TOTAL/AVERAGE 126,264,000 6.67 5.54 2,170,000 3,113,000 45.40 weighted -0.40 3.26 38.40 equal 0.77 -1.81 P. 11 | COLLIERS INTERNATIONAL
  • 12. HIGHLIGHTS | Q2 2011 | OFFICE | NORTH AMERICA CANADA | SUBURBAN OFFICE | ALL INVENTORY EXISTING NEW SUPPLY NEW SUPPLY UNDER VACANCY VACANCY ABSORPTION ABSORPTION INVENTORY (SF) Q2 2011 YTD 2011 CONSTRUCTION RATE (%) RATE (%) Q2 2011 YTD 2011 MARKET JUNE 30, 2011 (SF) (SF) (SF) MAR. 31, 2011 JUNE 30, 2011 (SF) (SF) Calgary, AB 23,478,000 220,000 220,000 576,000 9.73 9.17 329,000 621,000 Edmonton, AB 8,940,000 0 0 40,000 15.14 13.31 139,000 182,000 Guelph, ON 1,353,000 0 0 17,000 4.26 3.80 6,000 0 Halifax, NS 6,335,000 18,000 77,000 90,000 9.65 10.41 (12,000) 38,000 Montreal, QC 23,621,000 0 0 112,000 9.93 9.41 123,000 93,000 Ottawa, ON 20,638,000 0 0 0 7.99 7.74 72,000 (143,000) Regina, SK 659,000 0 0 0 0.26 0.14 1,000 3,000 Toronto, ON 98,006,000 116,000 116,000 918,000 7.20 7.03 327,000 1,157,000 Vancouver, BC 27,273,000 0 113,000 705,000 10.93 10.75 49,000 94,000 Victoria, BC 3,573,000 0 0 113,000 10.18 8.54 66,000 66,000 Winnipeg, MB 3,173,000 0 0 37,000 12.52 12.61 (9,000) (26,000) Waterloo Region, ON 5,984,000 103,000 155,000 609,000 7.96 7.72 6,000 64,000 CANADA TOTAL/AVERAGE 223,033,000 456,000 679,000 3,217,000 8.78 8.46 1,097,000 2,149,000 CANADA | SUBURBAN OFFICE | CLASS A VACANCY VACANCY AVERAGE ANNUAL QUARTERLY ANNUAL EXISTING RATE (%) RATE (%) ABSORPTION ABSORPTION QUOTED RENT CHANGE CHANGE INVENTORY (SF) MAR. 31, JUNE 30, Q2 2011 YTD 2011 (CAD PSF) IN RENT IN RENT MARKET JUNE 30, 2011 2011 2011 (SF) (SF) JUNE 30, 2011 (%) (%) Calgary, AB 10,829,000 9.90 7.94 410,000 640,000 38.00 2.7 18.8 Guelph, ON 821,000 1.08 0.86 2,000 (4,000) 24.30 -5.0 – Halifax, NS 2,650,000 7.79 8.52 (14,000) 6,000 28.00 -1.2 4.7 Montreal, QC 13,226,000 7.43 7.77 113,000 111,000 30.00 0.0 25.0 Ottawa, ON 11,626,000 7.83 7.80 3,000 12,000 30.00 -8.2 -3.3 Regina, SK 659,000 0.26 0.14 1,000 3,000 28.50 0.0 16.3 Toronto, ON 43,204,000 8.08 7.88 122,000 556,000 29.90 -1.6 -4.1 Vancouver, BC 13,132,000 13.33 13.07 35,000 63,000 38.30 -0.6 9.3 Victoria, BC 817,000 8.67 8.93 (2,000) (2,000) 40.00 – 27.0 Waterloo Region, ON 2,413,000 10.51 8.43 50,000 30,000 21.90 -4.8 -2.1 CANADA TOTAL/AVERAGE 99,377,000 8.80 8.48 719,000 1,414,000 31.70 weighted -1.30 3.60 30.90 equal 1.46 5.12 Glossary Inventory – Includes all existing multi- or single- New Supply – Includes completed speculative and Cap Rate – (Or going-in cap rate) Capitalization tenant leased and owner-occupied office properties build-to-suit construction. New supply quoted on a rates in this survey are based on multi-tenant greater than or equal to 10,000 square feet (net net basis after any demolitions or conversions. institutional grade buildings fully leased at market rentable area). In some larger markets this minimum rents. Cap rates are calculated by dividing net size threshold may vary up to 50,000 square feet. Annual Quoted Rent – Includes all costs associated operating income (NOI) by purchase price. Does not include medical or government buildings. with occupying a full floor in the mid-rise portion of a Class A building inclusive of taxes, insurance, Note: SF = square feet Vacancy Rate – Percentage of total inventory maintenance, janitorial and utilities (electricity PSF = per square foot physically vacant as at the survey date including surcharges added where applicable). All office rents CBD = central business district direct vacant and sublease space. in this report are quoted on an annual, gross per square foot basis. Rent calculations do not include Absorption – Net change in physically occupied sublease space. space over a given period of time. COLLIERS INTERNATIONAL | P. 12
  • 13. HIGHLIGHTS | Q2 2011 | OFFICE | NORTH AMERICA UNITED STATES | OFFICE INVESTMENT CBD CBD SUBURBAN SUBURBAN 512 offices in 61 countries on SALES PRICE CAP RATE SALES PRICE CAP RATE MARKET (USD PSF) (%) (USD PSF) (%) Atlanta, GA 75.00 7.50 139.00 8.50 Baltimore, MD Boston, MA – 247.00 – 5.00 141.13 236.00 7.50 – 6 continents Charleston, SC 250.00 8.00 135.00 11.00 Chicago, IL 165.00 7.25 106.00 8.50 United States: 125 Cincinnati, OH 125.00 9.75 140.00 9.50 Canada: 38 Columbus, OH 80.00 – 141.00 – Latin America: 18 Dallas/Fort Worth, TX 88.00 8.20 115.00 7.60 Asia Pacific: 214 Denver, CO 300.00 7.50 150.00 8.00 EMEA: 117 Fairfield County, CT – – 250.00 8.00 Fresno, CA 105.00 9.00 140.00 8.50 • $1.5 billion in annual revenue Ft. Lauderdale-Broward, FL – – 106.00 8.33 Grand Rapids, MI – – 40.75 – • 979 million square feet under Hartford, CT 10.13 – 66.48 – management Houston, TX 280.00 7.60 187.00 8.10 Indianapolis, IN – – 203.00 6.90 • Over 12,000 professionals Kansas City, MO – 8.00 – 8.00 Las Vegas, NV – – 73.58 – Little Rock, AR 88.00 9.50 110.00 9.25 COLLIERS INTERNATIONAL Long Island, NY – – 186.78 8.34 Los Angeles – Inland Empire, CA – – 175.00 8.00 601 Union Street, Suite 4800 Los Angeles, CA 290.00 6.00 275.00 7.50 Seattle, WA 98101 Miami-Dade, FL 149.00 – 128.00 7.50 TEL +1 206 695 4200 Minneapolis, MN – – 103.30 9.28 New Jersey - Central – – 145.00 7.20 New Jersey - Northern – – 141.00 8.80 New York, NY – Downtown Manhattan 247.00 6.90 – – FOR MORE INFORMATION New York, NY – Midtown Manhattan 618.00 5.00 – – New York, NY – Midtown S. Manhattan 618.00 5.00 – – Ross J. Moore Oakland, CA – 8.00 – 9.00 Chief Economist | USA Orange County, CA – – 250.00 8.00 TEL +1 617 722 0221 Orlando, FL 148.75 8.00 115.00 6.70 Philadelphia, PA 160.00 8.60 119.00 8.50 EMAIL ross.moore@colliers.com Phoenix, AZ 116.00 – 82.00 9.00 Pittsburgh, PA 150.00 8.25 100.00 9.00 Pleasanton/Walnut Creek, CA 117.50 8.00 87.50 8.50 Raleigh/Durham/Chapel Hill, NC – – 225.00 7.50 Copyright © 2011 Colliers International. Sacramento, CA – – 171.57 – San Diego, CA 131.48 – 126.40 8.63 The information contained herein has been obtained San Francisco 500.00 5.50 – – from sources deemed reliable. While every reasonable effort has been made to ensure its accuracy, we cannot San Francisco Peninsula, CA – – 200.00 7.00 guarantee it. No responsibility is assumed for any Savannah, GA 150.00 9.50 120.00 9.75 inaccuracies. Readers are encouraged to consult their Seattle/Puget Sound, WA 158.62 8.03 119.17 7.05 professional advisors prior to acting on any of the St. Louis, MO 100.00 9.25 130.00 8.50 material contained in this report. Stamford, CT 350.00 8.00 – – Stockton/San Joaquin County, CA 125.00 8.50 – – Tampa, FL 47.00 – 78.00 8.00 West Palm Beach/Palm Beach County, FL – – 122.00 7.22 Westchester County, NY – – 250.00 8.00 White Plains, NY 350.00 8.00 – – CANADA | OFFICE INVESTMENT CBD CBD SUBURBAN SUBURBAN SALES PRICE CAP RATE SALES PRICE CAP RATE MARKET (CAD PSF) (%) (CAD PSF) (%) Calgary, AB 395.00 6.25 375.00 6.50 Edmonton, AB – – 256.11 6.70 Guelph, ON 140.00 7.25 150.00 7.50 Halifax, NS – – 197.00 8.15 Montreal, QC 275.00 7.00 190.00 7.25 Ottawa, ON 270.00 7.25 145.00 7.60 Regina, SK 100.00 8.00 – – Saskatoon, SK 240.00 7.00 – – Toronto, ON 299.00 6.54 178.00 5.09 Vancouver, BC 400.00 5.75 300.00 6.50 Victoria, BC 285.00 6.50 280.00 6.75 Winnipeg, MB 155.00 7.75 135.00 7.75 Accelerating success. Waterloo Region, ON 140.00 7.25 150.00 7.50 WWW.COLLIERS.COM