Connecting Cities for Sustainable Living: An Urban Revolution
•
0 gostou•528 visualizações

An Overview of the Connected Urban Development Program

Recomendados
Recomendados
Mais conteúdo relacionado
Mais procurados
Mais procurados (17)
Destaque
Destaque (20)
Semelhante a Connecting Cities for Sustainable Living: An Urban Revolution
Semelhante a Connecting Cities for Sustainable Living: An Urban Revolution (20)
Mais de Shane Mitchell
Mais de Shane Mitchell (20)
Último
Último (20)
Connecting Cities for Sustainable Living: An Urban Revolution
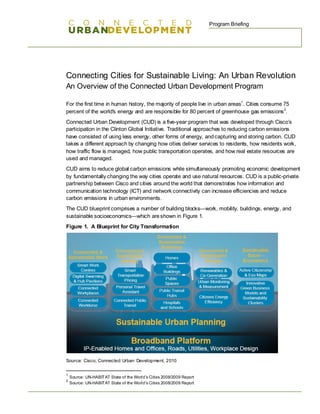
- 1. Program Briefing Connecting Cities for Sustainable Living: An Urban Revolution An Overview of the Connected Urban Development Program For the first time in human history, the majority of people live in urban areas1. Cities consume 75 percent of the world's energy and are responsible for 80 percent of greenhouse gas emissions 2. Connected Urban Development (CUD) is a five-year program that was developed through Cisco’s participation in the Clinton Global Initiative. Traditional approaches to reducing carbon emissions have consisted of using less energy, other forms of energy, and capturing and storing carbon. CUD takes a different approach by changing how cities deliver services to residents, how residents work, how traffic flow is managed, how public transportation operates, and how real estate resources are used and managed. CUD aims to reduce global carbon emissions while simultaneously promoting economic development by fundamentally changing the way cities operate and use natural resources. CUD is a public-private partnership between Cisco and cities around the world that demonstrates how information and communication technology (ICT) and network connectivity can increase efficiencies and reduce carbon emissions in urban environments. The CUD blueprint comprises a number of building blocks—work, mobility, buildings, energy, and sustainable socioeconomics—which are shown in Figure 1. Figure 1. A Blueprint for City Transformation Source: Cisco, Connected Urban Development, 2010 1 Source: UN-HABITAT State of the World’s Cities 2008/2009 Report 2 Source: UN-HABITAT State of the World’s Cities 2008/2009 Report
- 2. Program Briefing CUD was launched in partnership with the cities of San Francisco, Amsterdam, and Seoul in 2006. In 2008, four new cities joined the program: Birmingham, Hamburg, Lisbon, and Madrid. Cisco and Massachusetts Institute of Technology (MIT) Mobile Experience Lab3—which provided additional research—work together to provide thought leadership and develop programs in support of each city's strategic planning process. By using network connectivity for communication, collaboration, and urban planning, CUD is helping cities improve efficiencies in the following areas: ● Service delivery ● Traffic management ● Public transportation ● Real estate ● Carbon footprint monitoring tools Two CUD conferences took place in 2008: the first was in San Francisco, February 20 and 21; the second was in Amsterdam, September 23 and 24. The third CUD Global Conference 4 on 21 and 22 May 2009, co-hosted by Cisco and the city of Seoul, provided program updates to the global community of business, research, academic, and civic leaders. All three conferences have presented innovative approaches to connected and sustainable cities being developed by the CUD cities, as well as by other cities and global partners from business, NGO’s and academia. The CUD program has gained significant recognition as a result of the successful development of the proof-of-concept pilots achieved to date. CUD has been selected by the European Commission as a top “Benchmark of Excellence” program within the continental “Covenant of Mayors” energy efficiency initiative, an official partner of the ‘Sustainable Energy Europe Campaign’, and has also been recognized as one of the most successful project commitments to the Clinton Global Initiative. Impact and Updates Areas of focus for each city are as follows: ● Amsterdam: Connected and sustainable work and living solutions ● San Francisco: Smart mobility and eco-footprint monitoring ● Seoul: Connected and sustainable mobility solutions ● Birmingham: EnergyWise buildings and ICT ● Hamburg: Intelligent traffic management ● Lisbon: Smart UrbanEnergy for Schools ● Madrid: UrbanEnergy Management for homes and communities 3 http://mobile.mit.edu 4 www.connectecurbandevelopment.org/conferences
- 3. Program Briefing Connected Urban Development portal: The CUD community engages through the program website. The online presence seeks to update / engage / inform cities and public on CUD. The website at: www.ConnectedUrbanDevelopment.org, contains a wealth of information regarding CUD Solutions Toolkit, community features and access to full suite of multimedia content from the conferences and proof of concept projects. Cisco has developed a ‘CUD Solutions Toolkit’5 that includes lessons learned, best practices, economic and environmental value case models, and CUD project outcomes. Proof-of-Concept Pilots Progress More than 12 CUD pilots have been successfully launched, with “CUD Solution toolkit” content made widely available. Toolkits include executive decks describing the projects, “how to” project guides, reusable economic and environmental value-case models, technical architectures, and reference sites for customer visits. Following are the CUD pilots launched as of March 2010: Personal Travel Assistant (PTA): A web-based service architecture allowing people to access real- time transportation information and multimodal transportation routing services on any web-enabled device, from any location, helping improve the transit experience and reduce personal carbon footprint. The service is being piloted in Seoul (Seoul PTA6) and Amsterdam, Smart Transportation Pricing: A GPS- and wireless-based solution providing functionality and services for next-generation road-use charging and integrated transportation pricing. A prototype service is being piloted in Seoul to allow flexible transportation pricing through innovative charging schemes based on time and distance, in an effort to reduce traffic and parking congestion. Urban EcoMap7: A web based solution aimed at providing citizens, businesses, and policymakers with visual, transparent, and integrated information on CO2 emissions across transportation, buildings, energy, and waste, on a zip-code aggregated level. The application was launched in May 2009 at the CUD Global Conference to the citizens of San Francisco and to other global cities. The concept is now scaled to Amsterdam, 5 www.connectedurbandevelopment.org/toolkit 6 http://topis.seoul.go.kr/pta, launched in May 2009 7 www.urbanecomap.org, launched in May 2009
- 4. Program Briefing with technology partnerships and visualization applications currently being developed in the next phase. Smart Work Center (SWC): A regional network of neighborhood professional work and community centers supporting travel virtualization and enabling mobile working practices. Integrating TelePresence with virtual office solutions, the SWC offers a professional work environment near residential areas to lower energy use and carbon emissions. It is equipped with networking technology, collaboration tools, and social amenities. Launched in Amsterdam and Almere (Netherlands) in September 2008, the SWC concept and business model are now being scaled in Amsterdam and other cities around the world, including locations in South Korea, Europe, the United States, and India. The Connected Bus8: A wireless and Unified Communications-based architecture aimed at improving travelers’ experience and enabling dynamically organized transportation system capabilities for city authorities. San Francisco Municipal Transportation Agency and Cisco launched a Connected Bus pilot to encourage citizens to use the city’s bus system. The user research and value- case analysis are now available, and the pilot is being replicated in other cities globally. UrbanEnergy Management: A broadband-based architecture enabling information sharing about energy generation, consumption, and usage patterns in homes and open spaces. Relying on Home Energy Controller and neighborhood Urban Energy Controller solutions, the concept is being piloted in Madrid, where it was launched in a 22-apartment block. The team is now working on developing a business case for the rollout. Smart UrbanEnergy for Schools: A school-based architecture that incorporates EnergyWise, an IP-enabled Demand-Side Management solution for cogeneration, and a web-based tool for student and family outreach on energy efficiency. The pilot was launched in three schools, and the team is now working on extending the solution to other schools and municipal buildings. EnergyWise in Public Buildings: In Birmingham, CUD is beta-testing an EnergyWise solution across the building infrastructure of the city council. 8 www.theconnectedbus.org, launched in February 2008
- 5. Program Briefing Intelligent Traffic Management: In Hamburg, a multimodal traffic management project passed its planning phase, with implementation expected in 2010. In order to effectively manage the overall CUD initiative, Cisco and the CUD cities have established a CUD Steering Committee to focus on program governance and tracking the projects' results. MIT Research 9 MIT’s Mobile Experience Lab have delivered six visionary outputs from their engagement in the CUD program with Cisco and the cities. This has been in the form of flash demo’s, student classes and a sustainability innovation inventory of leading examples of technology application being used today. This has culminated in the book ‘Connected Sustainable Cities’ written by two leading academic researchers at MIT, and looks at the future applications of technology in the way we move about, work and live in cities. The CUD Alliance: A Next Generation Innovation Initiative In the next phase of the program’s evolution, The CUD Alliance10 was announced on September 24th2010. The Alliance —under the governance and secretariat of The Climate Group11 as an independent NGO— aims at bringing together cities, business partners and NGO into a global industry platform approach for IT in the sustainable city. To learn more about CUD, please visit; www.ConnectedUrbanDevelopment.org Main Contacts Nicola Villa, Global Director, Connected Urban Development, nvilla@cisco.com Shane Mitchell, Program Manager, Connected Urban Development, shanmitc@cisco.com 9 www.connectedurbandevelopment.org/mit 10 http://newsroom.cisco.com/dlls/2009/prod_092409b.html 11 www.theclimategroup.org
- 6. Program Briefing Appendix 1 – Connected Urban Development: Economic and Environmental Value Case Summaries The CUD initiative is delivering a series of Proof of Concept (PoC) programs, which are intended to illustrate the opportunities for ICT to deliver Connected and Sustainable Urban environments. At the PoC or pilot stage of the CUD initiatives, the benefits to energy and climate change can be provided on an ex-ante basis. For the most advanced pilot projects; The Connected Bus, Smart Work Center, Personal Travel Assistant and Smart Transportation Pricing, we have developed Value Case models 12, as part of the solutions toolkit that is provided on the CUD community website. Value Case Summaries: 1 - The Connected Bus Cisco has developed a value case to estimate the economic case for bus travel, the net environmental impact and an assessment of the range of possible reductions enabled by The Connected Bus. The hypothesis of the value case study is that investment in improving the effectiveness of the bus service is a positive Net Present Value (NPV) proposition that can lead to a net reduction in emissions. The comparison baseline is that of business-as-usual, against a technologically enhanced approach. Economic and Environmental Costs Delivery the functionality displayed on The Connected Bus requires a cumulative investment of US$115,000, or nearly $68,000 (NPV) over 10 years. This represents a 10-year cost per passenger of 6.8 cents, compared with the $2.38 operating cost per passenger over this period for the standard bus. A cumulative 10-year emission per bus of 87.39 tons based on hardware and operational expenditures is projected. Economic Benefits Reliability. The Connected Bus is available for an additional 30 hours per year, resulting in an increase in ridership of 3,000 passengers, and an increase in revenue of $2,070 per year. Passenger Information. The principal benefit is to reduce the perceived transfer times, resulting in an additional 20,625 bus trips per year. Vendor Integration. An IP platform would allow equipment vendors to swap and transmit information using IP rather than proprietary standards. This would allow tighter and more effective integration of vendor services, likely leading to lower costs in the long term. Over the 10-year life of the bus, this is equivalent to $500 a year. 12 All of the ex-ante value cases need to be considered in conjunction with the assumptions, and scenarios stated in the model logic descriptions, as provided in the CUD solutions toolkit: http://www.connectedurbandevelopment.org/toolkit
- 7. Program Briefing Traffic-light Integration. The Connected Bus allows information to be passed to local traffic lights, either holding the green light for an extended time or shortening the red-light cycle. This provides a 3.13 percent decrease in the usual bus-route-trip time of 90 minutes, suggesting a 1.56 percent improvement in ridership, some 7,734 additional riders each year and revenue of $5,337. This provides a NPV of $2.3 thousand at a discount rate of 12 percent per bus. The work has a 10- year cumulative revenue of $115.9 thousand and a 10-year cumulative cost of $100.3 thousand. Environmental Benefits The environmental benefits are calculated in a simple manner that avoids some of the complexity of a detailed environmental impact analysis. The aggregate increased ridership per year is estimated to be 12,281. Assuming that 5 percent of these trips replaced a car trip then some 614 additional car trips were avoided. With an average car trip of 6.3 miles (10 kilometres) this provides a reduction in carbon emission of 1,228 tons. Subtracting the 87 tons construction footprint, yields a net environmental benefit of 1,141 tons over 10 years. 2 - Smart Work Center Smart Work Centres (SWCs) provide a decentralised connected workplace for employees to collaborate and work. A SWC provides high speed secure wireless connectivity and telepresence like communication facilities in an appealing working environment, This summary documents the economic and environmental costs and benefits of a company 100 full time equivalents (FTEs) to a SWC. Space Requirements A SWC uses less space per employee. The 100 employees in the SWC would require 1,301 square metres, a net reduction in office space of 929 square metres. At the assumed value, this produces a one off benefit of € 1,832,690. Energy requirements A traditional office is estimated to consume around 186.22 KWHrs/m2/ year for office equipment and lighting and 2.37 therms/m2/year of natural gas for heating. The reduction in office space per employee leads to a commensurate reduction in electricity and natural gas use. The reduction of 929 square metres, at the modelled price of electricity yields an annual benefit of € 25,946 in electricity savings and a natural gas benefit of € 4,949 each year. Environmental Impact Using the SWC requires some additional power per square meter, 216.3, applied to a smaller area, 1,301 square meters. This provides 281,398 KWHrs/year electricity use (219 tonnes), a reduction of 133,863 KWhrs each year (104 tonnes). Over ten years this provides an avoided GHG emission of 1,044 tonnes. This is a 33% reduction in GHG emissions. Economic Impact The cash flows associated with the proposal show a net positive position with an economic gain of € 13,865 per employee over the ten year period.
- 8. Program Briefing User assessment Current users were generally found to have positive experiences: • Average grade on SWC experience (scale 1-10): 7.7 • Reduction of travel time is main motivation with choice of location as value differentiator (significant difference between private sector users (car oriented) versus city of Amsterdam users (public transport oriented) • Average time gain is 66 minutes per SWC working day.13 3 - Smart Transportation Pricing Smart transportation pricing provides cities with intelligence and flexible tools to manage transportation demand in urban areas. It enables cities to charge intelligent fees for road use and communicate transportation-related information in real time, taking advantage of global positing systems (GPS) and wireless communications technology. In Seoul the impacts of the pilot program has been evaluated and analyzed for their transportation and environmental aspects. Effects in transportation are evaluated in terms of average travel speed, average travel time, vehicle kilometer trip, traffic volume. Effects in environment are evaluated in terms of amount reduction of Nox, PM10, CO2 Compared to the base scenario, the evaluation results show improved effects in both transportation and environment sectors. 14 • In transportation sector, travel speed increases by 5.56%, travel time decreases by 5.13%, Vehicle Kilometer Trip (VKT) decreases by 13.4%, traffic volume decreases by 13.7% • In the environment sector, PM10 decreases by 17%, CO2 decreases by 16%. 4 – Personal Travel Assi stant The Personal Travel Assistant (PTA) is a service designed to resolve complex, frustrating experiences within urban transportation environments. PTA integrates urban transportation services, experiences, and transactions, providing travel information and support in a convenient format through various information channels and devices (including PCs, mobile phones, and kiosks). PTA streamlines transactions, route selection, and “disruption management” (such as response to traffic congestion), and integrates with other services such as calendaring and social networking. In Seoul the impacts of the pilot program has been evaluated and analyzed for their transportation and environmental aspects. 13 Reference qualitative analysis by Telematic Instituut, February 2009: http://www.connectedurbandevelopment.org/pdf/toolkit/SWC_user_evaluation_results_Feb09.pdf 14 Reference value case analysis by Seoul Development Institute, December 2008: http://www.connectedurbandevelopment.org/pdf/toolkit/sdi_cud_seoul_research_final-eng.pdf
- 9. Program Briefing Effects in transportation are evaluated in terms of average travel speed, average travel time, vehicle kilometer trip, traffic volume. Effects in environment are evaluated in terms of amount reduction of Nox, PM10, CO2 Compared to the base scenario, in the optimum scenario assessed, the evaluation results show improved effects in both transportation and environment sectors. 15 • In transportation sector, travel speed increases by 24.58%, travel time decreases by 19.46%, Vehicle Kilometer Trip (VKT) decreases by 40.64%, traffic volume decreases by 23.9% • In the environment sector, PM10 decreases by 5%, CO2 decreases by 1%, and Nox decrease by 13%. Qualitative survey findings: In 2008, as part of the value case study, Seoul Development Institute surveyed to 100 Seoul residents explored how users’ behavior patterns and response to the information provided via PTA style services. The survey result shows that persons’ attitudes are positive in terms of PTA service (68.9%) and information preference (63.1%). 5 - Smart UrbanEnergy for Schools Through partnership with the city of Lisbon and the Portuguese Ministry of Education, this project aims to showcase how technology can improve global energy efficiency in both the built environment and energy networks. Energy savings of 33.4 percent were achieved 16 during the first few months of the pilot. 6 - UrbanEnergy Management for Homes & Communities This pilot with the city of Madrid explores how energy is generated, managed, and consumed. A 33- apartment building is being outfitted with bioclimatic design and design innovations based on a broadband infrastructure that shares information about energy generation, consumption, and usage. These innovations can deliver estimated energy savings of 75 and 85 percent. 17 Further value cases will be developed, as the pilots advance. All value cases will be posted to www.connectedurbandevelopment.org/toolkit for access by the global community of cities and partners. 15 ibid 16 Based on initial findings from the pilot study. Further information on EnergyWise is available at: http://www.cisco.com/en/US/solutions/ns726/intro_content_energywise.html , including a scenario based value case model. 17 Estimated on an ex-ante basis by the City of Madrid, Department for Urbanism and Housing.