SlideShare uma empresa Scribd logo
1 de 46
Baixar para ler offline
C H A R L O T T E D O U G L A S I N T E R N AT I O N A L A I R P O R T


                     Connecting the Carolinas to the World
C H A R L O T T E D O U G L A S I N T E R N AT I O N A L A I R P O R T


2010 IATA Eagle Award
 •   The International Air Transport Association (IATA)
     singled out CLT’s achievements with the
     prestigious Eagle Award in June 2010
 •   Recognizes outstanding performance in customer
     satisfaction, cost efficiency and continuous
     improvement
 •   CLT joins exclusive group of only five U.S. airports
     to receive award


     “Charlotte Douglas has the winning combination: low
     costs, low debt, and solid service levels. The strong
     financial and operational model at Charlotte Douglas
     works well for airlines, passengers, and the airport.
     There can be no greater accolade than the continued
     support from its major airline customers through this
     Eagle Award.”
     (Giovanni) Bisignani, (Director General and CEO, IATA)
C H A R L O T T E D O U G L A S I N T E R N AT I O N A L A I R P O R T


Airport Mission


     “Charlotte Douglas International will be the preferred airport and airline
     hub by providing the highest quality product for the lowest possible cost.”
C H A R L O T T E D O U G L A S I N T E R N AT I O N A L A I R P O R T


Airline Cost Per Enplaned Passenger
      $28.00


      $24.00


      $20.00


      $16.00


      $12.00


        $8.00


        $4.00


        $0.00
                                                                                                     MIA
                                                  DEN-UA
                                                           DEN-No UA


                                                                                                                                               IND


                                                                                                                                                                                   ANC
                                                                                   LAX


                                                                                                                                                     DAL


                                                                                                                                                                 ABQ
                                                                                                                                                                       PBI
                                                                             ORD


                                                                                                                       TPA


                                                                                                                                                           CMH
                                                                                                                                         CLE
                                      PHL
                                            PIT


                                                                       ATL


                                                                                                                 FLL


                                                                                                                                                                                         SDF
                                                                                         DFW


                                                                                                                                                                             RSW
                                                                                               SFO


                                                                                                                                   CVG
                            CLT O&D


                                                                                                           STL


                                                                                                                             DTW
                CLT Total


                                                                                         Group Median
C H A R L O T T E D O U G L A S I N T E R N AT I O N A L A I R P O R T


CLT Enplanements
                                         20


                                         18


                                         16
       Millions of Passengers Enplaned


                                         14


                                         12


                                         10


                                          8


                                          6


                                          4


                                          2


                                          0


                                                                         5
C H A R L O T T E D O U G L A S I N T E R N AT I O N A L A I R P O R T


Airport Fast Facts
 • 2nd Largest Airport on Eastern Seaboard
 • 677 Daily Departures (February 2011)
 • Non-stop service to 134 destinations; 33 int’l
 • Over 18,000 Employees
 • 529,101 aircraft operations in 2010
 • 38,254,207 passengers in 2010;
          10.7% increase over 2009
 • Nationwide Rankings 2010:
   •    7th in Movements/Operations
   •    11th in Passengers
 • Worldwide Rankings 2010:
   •   7th in Movements/Operations
   •   25th in Passengers


 * Rankings for 2010 based on preliminary data
C H A R L O T T E D O U G L A S I N T E R N AT I O N A L A I R P O R T


US Airways CLT Direct Routes
C H A R L O T T E D O U G L A S I N T E R N AT I O N A L A I R P O R T


Southwest RDU Direct Routes
C H A R L O T T E D O U G L A S I N T E R N AT I O N A L A I R P O R T


Industry Trends
Emerging Hub Trends in the U.S.
“Hub access is the name of the game…”
 • The role of Airline Alliances
 • Extensive Capacity Reductions
 • Future Fleet Demand
C H A R L O T T E D O U G L A S I N T E R N AT I O N A L A I R P O R T


Emerging Hub Trends in the U.S.
The Role of the Alliance
    • Passengers have access to worldwide destinations through airline partners
      in the alliance
    • Allows airlines to funnel passengers through hubs rather than extensive
      point-to-point international destinations
    • Allows airlines to sell additional tickets by routing passengers through the
      alliance network
    • Reduces redundancy of routes by multiple carriers
C H A R L O T T E D O U G L A S I N T E R N AT I O N A L A I R P O R T


Emerging Hub Trends in the U.S.
Capacity Reductions
    • Airlines taking control of their fate through capacity rather than pricing
    • Volatility of fuel costs
    • Effective in reducing costs
    • Seat capacity system-wide fell 9% in 2009; forecasted to fall another 10% in
      2010
    • Focus on more hub activity rather than point-to-point service
    • Capacity cuts include:
            • Older aircraft with high
              maintenance costs

            • 50 and 70 seat aircraft
C H A R L O T T E D O U G L A S I N T E R N AT I O N A L A I R P O R T


Emerging Hub Trends in the U.S.
Fleet Demand in North America
Much higher demand for replacement aircraft than new aircraft over next 18-20 yrs
C H A R L O T T E D O U G L A S I N T E R N AT I O N A L A I R P O R T


Emerging Hub Trends in the U.S.
 What does this mean to CLT?
    • Airlines will continue to focus on
      hub airports as they look for ways
      to return to profitability
    • Airports must focus on the metrics
      that make an attractive hub for
      the airlines
         • Geographic location
         • Expansion Capabilities
         • Financial Structure
C H A R L O T T E D O U G L A S I N T E R N AT I O N A L A I R P O R T


The Economic Development Platform
    • Generates nearly $10 billion in annual economic impact
    • 100,000 jobs are directly or indirectly supported by the Airport
C H A R L O T T E D O U G L A S I N T E R N AT I O N A L A I R P O R T


The Economic Development Platform
                                   Economic Impact
            12,000
                                                                                                                                 Total Economic Impact
            10,000
                                                                                                                10,000        1976 - $117,000,000
                                                                                                                              1996 - $4,000,000,000
             8,000
                                                                                                                              2004 - $10,000,000,000
 Millions


             6,000

             4,000                                                                                4,000

             2,000
                        117
                0

                                                                                                                                                               Employment
                     1976
                            1978
                                   1980
                                          1982
                                                 1984
                                                        1986
                                                               1988
                                                                      1990
                                                                             1992
                                                                                    1994
                                                                                           1996
                                                                                                  1998
                                                                                                         2000
                                                                                                                2002
                                                                                                                       2004
                                                                                                                              120,000

                                                                                                                                                                                                                              100,716
                                                                                                                              100,000

                                                                                                                               80,000                                                                   71,392

                                               Employment                                                                      60,000
                                          1976 - 1,342 jobs
                                                                                                                               40,000
                                          1996 - 71,392 jobs
                                          2004 - 100,716 jobs                                                                  20,000
                                                                                                                                         1,342
                                                                                                                                   0
                                                                                                                                        1976

                                                                                                                                               1978

                                                                                                                                                      1980

                                                                                                                                                             1982

                                                                                                                                                                    1984

                                                                                                                                                                           1986

                                                                                                                                                                                  1988

                                                                                                                                                                                         1990

                                                                                                                                                                                                1992

                                                                                                                                                                                                       1994

                                                                                                                                                                                                              1996

                                                                                                                                                                                                                     1998

                                                                                                                                                                                                                            2000

                                                                                                                                                                                                                                   2002

                                                                                                                                                                                                                                          2004
                                                                                                                                                                                                                                   15
C H A R L O T T E D O U G L A S I N T E R N AT I O N A L A I R P O R T


Expansion Plans
C H A R L O T T E D O U G L A S I N T E R N AT I O N A L A I R P O R T


Planned New Intermodal Facility
C H A R L O T T E D O U G L A S I N T E R N AT I O N A L A I R P O R T


Intermodal Train Facility
C H A R L O T T E D O U G L A S I N T E R N AT I O N A L A I R P O R T


Global Movement of Goods
C H A R L O T T E D O U G L A S I N T E R N AT I O N A L A I R P O R T


Existing Intermodal Facility
C H A R L O T T E D O U G L A S I N T E R N AT I O N A L A I R P O R T


West Blvd/I-485 Interchange
C H A R L O T T E D O U G L A S I N T E R N AT I O N A L A I R P O R T


Environmental
     Intermodal trains produce about one third as much CO2 per ton-mile as trucks
C H A R L O T T E D O U G L A S I N T E R N AT I O N A L A I R P O R T


                     Connecting the Carolinas to the World
Charlotte Chamber of
      Commerce
Transportation Summit
         2011
       April 8, 2011
4Q10 / 2010 Highlights

• 2010 profit of $447M* - second highest profit in
  Company history
• 4Q10 profit of $28M - first 4Q profit since 2006
• $2.3B in total cash, $364M restricted
• Accrued $47M in profit sharing for 2010
• 4Q unit costs* down 1.7% on 4.2% increase in flying
• Outstanding operational performance - $24M in
  operational incentive payouts
• A la carte baggage fees generated $483M in 2010, up
  $81M vs. 2009


  * Excludes special items
US Airways - 4th Largest Major Network Airline

                                                     4Q10 YTD System Capacity

                                         Major Network Airlines


                       250.0


                       200.0   190.7*
                                        175.7
                                                                                  Low Cost/Other
    Total ASMs (Bil)


                       150.0
                                                    124.2

                       100.0
                                                                         73.6
                                                                  64.8

                        50.0
                                                                                26.2     21.0      18.2

                         0.0


* Pro forma (United + Continental)
Capacity Discipline

   • Since 2006 US has removed significant domestic capacity
   • And that trend continued into 2010
                    Domestic ASM Changes                                       3Q10 YTD Change in Total ASMs (YOY)
                                (2010 vs. 2006)
                                                             8.0%
  10.0%
                                                      8.0%
                                                             7.0%    6.7%

    5.0%                                                     6.0%

                                                             5.0%
                                                                            4.1%
                                                             4.0%                  3.8%
        -

                                                             3.0%
   (5.0%)                                                    2.0%
                                                                                          1.1%
                                                             1.0%                                0.5%
                                                                                                        0.2%    0.1%
  (10.0%)
                                                             0.0%
                                                                                                                       -0.2%
                                                             -1.0%
                   (13.1%)
  (15.0%)                                   (14.4%)                                                                            -1.1%
                                                             -2.0%

  (20.0%)
                Legacy                        US      LCC
3Q 2010 YOY
Capacity Change


  Source: SEC filings and company reports
Industry Capacity Outlook
• Industry capacity* growth between 2 and 3 percent in 2011
• US Airways’ system capacity growth of approximately 2 percent
• Domestic capacity growth not expected to exceed GDP growth


                                                         2011 Estimated
                                                    System Capacity Growth*

    12.0%

                     7.8%              7.3%
      8.0%
                                                          4.9%
                                                                            3.3%                             Ind. Avg = 2.3%
      4.0%
                                                                                               2.0%
                                                                                                      0.8%         0.5%
      0.0%


* J.P. Morgan industry estimates, Feb. 2011. US Airways capacity growth based on company guidance
Seismic Changes in Industry Landscape

• New a la carte revenue streams
   – Baggage fees
   – Choice seating
   – In-flight charges
A la Carte Revenue


• Recent Initiatives:                            A La Carte Revenue
                                                       ($ mil)
   –   GoGo® Inflight WiFi                                       $514
                                                     $425
   –   Choice Seats
   –   Online bag pre-pay
   –   Premium snacks and beverages    $165
   –   Power-Nap Sack

• Generated more than                  2008         2009        2010
  $500M in revenue in 2010            Bag Fees    Other A La Carte
Focused Operational Performance Improvements

                      On-time Departure Numbers                                                    On-time Arrival Numbers

         2007              2008              2009              2010                    2007          2008          2009          2010

         DeltaFocused on:Northwest        US Airways       US Airways                   Delta      US Airways      United        United

       Northwest       US Airways            United           United                 Continental    Northwest    US Airways    US Airways

              •Started boarding early
      Continental          Delta           Northwest         American                  United         Delta       Northwest    Continental

         United          American            Delta             Delta                  Northwest    Continental   Continental    American
              •Invested in ticket scanners
       American           United           American         Continental               American       United         Delta        Delta


              •Closing door early
      US Airways        Continental       Continental                                US Airways     American      American

                             Mishandled Bags                                                        Customer Complaints

         2007 •Invested in baggage scanners
                           2008              2009              2010                    2007          2008          2009          2010

       Northwest         Northwest         Northwest       US Airways                Continental    Northwest    Continental    American

              •Added block time
      Continental       Continental       Continental       Continental               Northwest    Continental    American     Continental

         United        US Airways         US Airways           Delta                  American      American      Northwest    US Airways

              •Invested in GSE in key cities
       American           United             United           United                    Delta         Delta      US Airways      United


              •Reviewed daily and adjusted
         Delta           American          American          American                  United        United        United        Delta

      US Airways           Delta             Delta                                   US Airways    US Airways       Delta


Note: Figures are through December 2010. Source: U.S. Department of Transportation
US Positioning vs. Other Legacy Carriers
                                                                                   2010 Stage Adjusted CASM
                                                                                (excluding fuel and special items)
             2010 Stage Adjusted PRASM

  13.77¢
                                                                       9.58¢


                                                                                                              15% Advantage
                                        13% Disadvantage
                                                                                            8.37¢


                       12.20¢


 Network                 US                                           Network                US


Stage Adjusted to US Airways YTD average stage length of 981 miles;
Network includes new United, American, Delta; Low Cost includes
AirTran, JetBlue, and Southwest
US Airw ays System Facts

                        2008             2009            2010     4-05

Jet Fuel/Gal            $3.18            1.76            2.25     3.30

Employees               34,000           32,381          31,367

Destinations            230              210             201

Daily Flights           3,700            3,256           3,200

US Purchased 1.4 Billion Gallons of Fuel in 2010

A $1 Increase in a Barrel of Oil Costs US $35 million per Year
Charlotte Facts

                              4Q08        4Q09        4Q10
Daily Flights                 550         575         624

Employees                     5,955       6,030       6,637

Nonstop Destinations          121         126         133

Domestic                      104         102         106

International                 17          24          27
                              London      Paris/Rio   Rome
                              Frankfurt

Extensive Caribbean Network

Madrid and Dublin in May
Sao Paulo in November
Cities* with Hubs (Population)

1.    NYC            19.1   11.   Phoenix          4.4
2.    Los Angeles    12.8   12.   San Francisco    4.5
3.    Chicago        9.6    13.   Seattle          3.4
4.    Dallas         6.4    14.   Minneapolis      3.3
5.    Philadelphia   6.0    15.   Denver           2.6
6.    Houston        5.9    16.   Cleveland        2.1
7.    Miami          5.5    17.   Cincinnati       2.2
8.    Washington     5.5    18.   Charlotte        1.7
9.    Atlanta        5.5    19.   Milwaukee        1.6
10.   Detroit        4.4    20.   Memphis          1.3
                            21.   Salt Lake City   1.1
 *1,000,000 people
W hat Do These Cities Have in Com m on

•   Baltimore
•   Pittsburgh
•   Portland           All Larger in
•   Kansas City       Population than
•   Las Vegas            Charlotte
•   San Jose
                        Former Hubs
•   Columbus
•   St. Louis
New Envoy Suite
Announcements/Statements


• Introduced electronic boarding passes in Las
  Vegas, and Charlotte
• Adding MAD and DUB in May
• Adding Sao Paulo in November
• Hiring 500 (recall of furloughed employees)
  and up to 200 for WS Call Center
• Adding F/C to Express Fleet
• Ranked #1 in Wichita State/Purdue AQR
The Industry Environment

• Looking Ahead
   – 2011 industry capacity anticipated to be up
     approximately 2.5%
   – Industry in early rebound stages with robust business
     travel and recovering leisure travel
   – Wall Street very concerned about volatile fuel prices,
     pace of economic recovery, and high unemployment

v Wild Card--- Middle East Unrest
Summary

• US Airways is well positioned and is outperforming
  relative to the industry:
   –   Top tier operational performance
   –   Reduced capacity
   –   Aggressive cost management
   –   Industry leading financial performance and margin improvement


• US Airways will continue to look for ways to:
   – Enhance the product and optimize assets
   – Invest and build upon our safety culture


• We Continue to Invest in Charlotte
Stock Price Performance
 2010 Relative Return
120.0%
         106.8%
                          $4.84 to $10.01
100.0%

                  84.5%

80.0%

                              64.0%
60.0%

                                        41.6%
40.0%

                                                21.3%
20.0%                                                   13.6%   12.8%   10.7%

                                                                                0.8%
 0.0%
Questions?

Mais conteúdo relacionado

Mais de Charlotte Chamber

Changes in Environmental Laws and Regulations
Changes in Environmental Laws and RegulationsChanges in Environmental Laws and Regulations
Changes in Environmental Laws and RegulationsCharlotte Chamber
 
Charlotte Chamber Inter City Visit 2013 - Recap
Charlotte Chamber Inter City Visit 2013 - RecapCharlotte Chamber Inter City Visit 2013 - Recap
Charlotte Chamber Inter City Visit 2013 - RecapCharlotte Chamber
 
2013 Charlotte Chamber Program of Work
2013 Charlotte Chamber Program of Work2013 Charlotte Chamber Program of Work
2013 Charlotte Chamber Program of WorkCharlotte Chamber
 
2012 Energy Summit: The Business of Sustainability
2012 Energy Summit: The Business of Sustainability2012 Energy Summit: The Business of Sustainability
2012 Energy Summit: The Business of SustainabilityCharlotte Chamber
 
Charlotte chamberaugust2012 mcguirewoods
Charlotte chamberaugust2012   mcguirewoodsCharlotte chamberaugust2012   mcguirewoods
Charlotte chamberaugust2012 mcguirewoodsCharlotte Chamber
 
UNC Charlotte Economic Development
UNC Charlotte Economic DevelopmentUNC Charlotte Economic Development
UNC Charlotte Economic DevelopmentCharlotte Chamber
 
Charlotte Creates @ Packard Place
Charlotte Creates @ Packard PlaceCharlotte Creates @ Packard Place
Charlotte Creates @ Packard PlaceCharlotte Chamber
 
Communication Strategies for Organizational Success
Communication Strategies for Organizational SuccessCommunication Strategies for Organizational Success
Communication Strategies for Organizational SuccessCharlotte Chamber
 
Meet the Primes - LYNX Blue Line Extension
Meet the Primes - LYNX Blue Line ExtensionMeet the Primes - LYNX Blue Line Extension
Meet the Primes - LYNX Blue Line ExtensionCharlotte Chamber
 
Transportation and Quality of Life
Transportation and Quality of LifeTransportation and Quality of Life
Transportation and Quality of LifeCharlotte Chamber
 
Managed Lanes: More than a Revenue Tool
Managed Lanes: More than a Revenue ToolManaged Lanes: More than a Revenue Tool
Managed Lanes: More than a Revenue ToolCharlotte Chamber
 
Sustainable Transit & The Role of the Master Developer
Sustainable Transit & The Role of the Master DeveloperSustainable Transit & The Role of the Master Developer
Sustainable Transit & The Role of the Master DeveloperCharlotte Chamber
 
Charlotte Capital Improvement Program Proposal
Charlotte Capital Improvement Program ProposalCharlotte Capital Improvement Program Proposal
Charlotte Capital Improvement Program ProposalCharlotte Chamber
 
2011 Charlotte Chamber Energy Summit
2011 Charlotte Chamber Energy Summit2011 Charlotte Chamber Energy Summit
2011 Charlotte Chamber Energy SummitCharlotte Chamber
 

Mais de Charlotte Chamber (20)

Tax Law Changes
Tax Law ChangesTax Law Changes
Tax Law Changes
 
Changes in Environmental Laws and Regulations
Changes in Environmental Laws and RegulationsChanges in Environmental Laws and Regulations
Changes in Environmental Laws and Regulations
 
Charlotte Chamber Inter City Visit 2013 - Recap
Charlotte Chamber Inter City Visit 2013 - RecapCharlotte Chamber Inter City Visit 2013 - Recap
Charlotte Chamber Inter City Visit 2013 - Recap
 
2013 Charlotte Chamber Program of Work
2013 Charlotte Chamber Program of Work2013 Charlotte Chamber Program of Work
2013 Charlotte Chamber Program of Work
 
2012 Energy Summit: The Business of Sustainability
2012 Energy Summit: The Business of Sustainability2012 Energy Summit: The Business of Sustainability
2012 Energy Summit: The Business of Sustainability
 
Charlotte chamberaugust2012 mcguirewoods
Charlotte chamberaugust2012   mcguirewoodsCharlotte chamberaugust2012   mcguirewoods
Charlotte chamberaugust2012 mcguirewoods
 
UNC Charlotte Economic Development
UNC Charlotte Economic DevelopmentUNC Charlotte Economic Development
UNC Charlotte Economic Development
 
Charlotte Creates @ Packard Place
Charlotte Creates @ Packard PlaceCharlotte Creates @ Packard Place
Charlotte Creates @ Packard Place
 
What's Next for CMS?
What's Next for CMS?What's Next for CMS?
What's Next for CMS?
 
Communication Strategies for Organizational Success
Communication Strategies for Organizational SuccessCommunication Strategies for Organizational Success
Communication Strategies for Organizational Success
 
Meet the Primes - LYNX Blue Line Extension
Meet the Primes - LYNX Blue Line ExtensionMeet the Primes - LYNX Blue Line Extension
Meet the Primes - LYNX Blue Line Extension
 
Transportation and Quality of Life
Transportation and Quality of LifeTransportation and Quality of Life
Transportation and Quality of Life
 
Managed Lanes: More than a Revenue Tool
Managed Lanes: More than a Revenue ToolManaged Lanes: More than a Revenue Tool
Managed Lanes: More than a Revenue Tool
 
Sustainable Transit & The Role of the Master Developer
Sustainable Transit & The Role of the Master DeveloperSustainable Transit & The Role of the Master Developer
Sustainable Transit & The Role of the Master Developer
 
Implementing PLAN 2040
Implementing PLAN 2040Implementing PLAN 2040
Implementing PLAN 2040
 
Charlotte Capital Improvement Program Proposal
Charlotte Capital Improvement Program ProposalCharlotte Capital Improvement Program Proposal
Charlotte Capital Improvement Program Proposal
 
NCDOT Rail Update
NCDOT Rail UpdateNCDOT Rail Update
NCDOT Rail Update
 
CATS Update
CATS UpdateCATS Update
CATS Update
 
GreenWorks April Meeting
GreenWorks April MeetingGreenWorks April Meeting
GreenWorks April Meeting
 
2011 Charlotte Chamber Energy Summit
2011 Charlotte Chamber Energy Summit2011 Charlotte Chamber Energy Summit
2011 Charlotte Chamber Energy Summit
 

Último

{Qatar{^🚀^(+971558539980**}})Abortion Pills for Sale in Dubai. .abu dhabi, sh...
{Qatar{^🚀^(+971558539980**}})Abortion Pills for Sale in Dubai. .abu dhabi, sh...{Qatar{^🚀^(+971558539980**}})Abortion Pills for Sale in Dubai. .abu dhabi, sh...
{Qatar{^🚀^(+971558539980**}})Abortion Pills for Sale in Dubai. .abu dhabi, sh...hyt3577
 
Embed-2 (1).pdfb[k[k[[k[kkkpkdpokkdpkopko
Embed-2 (1).pdfb[k[k[[k[kkkpkdpokkdpkopkoEmbed-2 (1).pdfb[k[k[[k[kkkpkdpokkdpkopko
Embed-2 (1).pdfb[k[k[[k[kkkpkdpokkdpkopkobhavenpr
 
America Is the Target; Israel Is the Front Line _ Andy Blumenthal _ The Blogs...
America Is the Target; Israel Is the Front Line _ Andy Blumenthal _ The Blogs...America Is the Target; Israel Is the Front Line _ Andy Blumenthal _ The Blogs...
America Is the Target; Israel Is the Front Line _ Andy Blumenthal _ The Blogs...Andy (Avraham) Blumenthal
 
BDSM⚡Call Girls in Indirapuram Escorts >༒8448380779 Escort Service
BDSM⚡Call Girls in Indirapuram Escorts >༒8448380779 Escort ServiceBDSM⚡Call Girls in Indirapuram Escorts >༒8448380779 Escort Service
BDSM⚡Call Girls in Indirapuram Escorts >༒8448380779 Escort ServiceDelhi Call girls
 
Kishan Reddy Report To People (2019-24).pdf
Kishan Reddy Report To People (2019-24).pdfKishan Reddy Report To People (2019-24).pdf
Kishan Reddy Report To People (2019-24).pdfKISHAN REDDY OFFICE
 
05052024_First India Newspaper Jaipur.pdf
05052024_First India Newspaper Jaipur.pdf05052024_First India Newspaper Jaipur.pdf
05052024_First India Newspaper Jaipur.pdfFIRST INDIA
 
THE OBSTACLES THAT IMPEDE THE DEVELOPMENT OF BRAZIL IN THE CONTEMPORARY ERA A...
THE OBSTACLES THAT IMPEDE THE DEVELOPMENT OF BRAZIL IN THE CONTEMPORARY ERA A...THE OBSTACLES THAT IMPEDE THE DEVELOPMENT OF BRAZIL IN THE CONTEMPORARY ERA A...
THE OBSTACLES THAT IMPEDE THE DEVELOPMENT OF BRAZIL IN THE CONTEMPORARY ERA A...Faga1939
 
China's soft power in 21st century .pptx
China's soft power in 21st century   .pptxChina's soft power in 21st century   .pptx
China's soft power in 21st century .pptxYasinAhmad20
 
Enjoy Night ≽ 8448380779 ≼ Call Girls In Gurgaon Sector 48 (Gurgaon)
Enjoy Night ≽ 8448380779 ≼ Call Girls In Gurgaon Sector 48 (Gurgaon)Enjoy Night ≽ 8448380779 ≼ Call Girls In Gurgaon Sector 48 (Gurgaon)
Enjoy Night ≽ 8448380779 ≼ Call Girls In Gurgaon Sector 48 (Gurgaon)Delhi Call girls
 
Nurturing Families, Empowering Lives: TDP's Vision for Family Welfare in Andh...
Nurturing Families, Empowering Lives: TDP's Vision for Family Welfare in Andh...Nurturing Families, Empowering Lives: TDP's Vision for Family Welfare in Andh...
Nurturing Families, Empowering Lives: TDP's Vision for Family Welfare in Andh...narsireddynannuri1
 
TDP As the Party of Hope For AP Youth Under N Chandrababu Naidu’s Leadership
TDP As the Party of Hope For AP Youth Under N Chandrababu Naidu’s LeadershipTDP As the Party of Hope For AP Youth Under N Chandrababu Naidu’s Leadership
TDP As the Party of Hope For AP Youth Under N Chandrababu Naidu’s Leadershipanjanibaddipudi1
 
Enjoy Night ≽ 8448380779 ≼ Call Girls In Palam Vihar (Gurgaon)
Enjoy Night ≽ 8448380779 ≼ Call Girls In Palam Vihar (Gurgaon)Enjoy Night ≽ 8448380779 ≼ Call Girls In Palam Vihar (Gurgaon)
Enjoy Night ≽ 8448380779 ≼ Call Girls In Palam Vihar (Gurgaon)Delhi Call girls
 
Group_5_US-China Trade War to understand the trade
Group_5_US-China Trade War to understand the tradeGroup_5_US-China Trade War to understand the trade
Group_5_US-China Trade War to understand the tradeRahatulAshafeen
 
2024 03 13 AZ GOP LD4 Gen Meeting Minutes_FINAL.docx
2024 03 13 AZ GOP LD4 Gen Meeting Minutes_FINAL.docx2024 03 13 AZ GOP LD4 Gen Meeting Minutes_FINAL.docx
2024 03 13 AZ GOP LD4 Gen Meeting Minutes_FINAL.docxkfjstone13
 
Defensa de JOH insiste que testimonio de analista de la DEA es falso y solici...
Defensa de JOH insiste que testimonio de analista de la DEA es falso y solici...Defensa de JOH insiste que testimonio de analista de la DEA es falso y solici...
Defensa de JOH insiste que testimonio de analista de la DEA es falso y solici...AlexisTorres963861
 
Pakistan PMLN Election Manifesto 2024.pdf
Pakistan PMLN Election Manifesto 2024.pdfPakistan PMLN Election Manifesto 2024.pdf
Pakistan PMLN Election Manifesto 2024.pdfFahimUddin61
 
Julius Randle's Injury Status: Surgery Not Off the Table
Julius Randle's Injury Status: Surgery Not Off the TableJulius Randle's Injury Status: Surgery Not Off the Table
Julius Randle's Injury Status: Surgery Not Off the Tableget joys
 
06052024_First India Newspaper Jaipur.pdf
06052024_First India Newspaper Jaipur.pdf06052024_First India Newspaper Jaipur.pdf
06052024_First India Newspaper Jaipur.pdfFIRST INDIA
 
AI as Research Assistant: Upscaling Content Analysis to Identify Patterns of ...
AI as Research Assistant: Upscaling Content Analysis to Identify Patterns of ...AI as Research Assistant: Upscaling Content Analysis to Identify Patterns of ...
AI as Research Assistant: Upscaling Content Analysis to Identify Patterns of ...Axel Bruns
 
Gujarat-SEBCs.pdf pfpkoopapriorjfperjreie
Gujarat-SEBCs.pdf pfpkoopapriorjfperjreieGujarat-SEBCs.pdf pfpkoopapriorjfperjreie
Gujarat-SEBCs.pdf pfpkoopapriorjfperjreiebhavenpr
 

Último (20)

{Qatar{^🚀^(+971558539980**}})Abortion Pills for Sale in Dubai. .abu dhabi, sh...
{Qatar{^🚀^(+971558539980**}})Abortion Pills for Sale in Dubai. .abu dhabi, sh...{Qatar{^🚀^(+971558539980**}})Abortion Pills for Sale in Dubai. .abu dhabi, sh...
{Qatar{^🚀^(+971558539980**}})Abortion Pills for Sale in Dubai. .abu dhabi, sh...
 
Embed-2 (1).pdfb[k[k[[k[kkkpkdpokkdpkopko
Embed-2 (1).pdfb[k[k[[k[kkkpkdpokkdpkopkoEmbed-2 (1).pdfb[k[k[[k[kkkpkdpokkdpkopko
Embed-2 (1).pdfb[k[k[[k[kkkpkdpokkdpkopko
 
America Is the Target; Israel Is the Front Line _ Andy Blumenthal _ The Blogs...
America Is the Target; Israel Is the Front Line _ Andy Blumenthal _ The Blogs...America Is the Target; Israel Is the Front Line _ Andy Blumenthal _ The Blogs...
America Is the Target; Israel Is the Front Line _ Andy Blumenthal _ The Blogs...
 
BDSM⚡Call Girls in Indirapuram Escorts >༒8448380779 Escort Service
BDSM⚡Call Girls in Indirapuram Escorts >༒8448380779 Escort ServiceBDSM⚡Call Girls in Indirapuram Escorts >༒8448380779 Escort Service
BDSM⚡Call Girls in Indirapuram Escorts >༒8448380779 Escort Service
 
Kishan Reddy Report To People (2019-24).pdf
Kishan Reddy Report To People (2019-24).pdfKishan Reddy Report To People (2019-24).pdf
Kishan Reddy Report To People (2019-24).pdf
 
05052024_First India Newspaper Jaipur.pdf
05052024_First India Newspaper Jaipur.pdf05052024_First India Newspaper Jaipur.pdf
05052024_First India Newspaper Jaipur.pdf
 
THE OBSTACLES THAT IMPEDE THE DEVELOPMENT OF BRAZIL IN THE CONTEMPORARY ERA A...
THE OBSTACLES THAT IMPEDE THE DEVELOPMENT OF BRAZIL IN THE CONTEMPORARY ERA A...THE OBSTACLES THAT IMPEDE THE DEVELOPMENT OF BRAZIL IN THE CONTEMPORARY ERA A...
THE OBSTACLES THAT IMPEDE THE DEVELOPMENT OF BRAZIL IN THE CONTEMPORARY ERA A...
 
China's soft power in 21st century .pptx
China's soft power in 21st century   .pptxChina's soft power in 21st century   .pptx
China's soft power in 21st century .pptx
 
Enjoy Night ≽ 8448380779 ≼ Call Girls In Gurgaon Sector 48 (Gurgaon)
Enjoy Night ≽ 8448380779 ≼ Call Girls In Gurgaon Sector 48 (Gurgaon)Enjoy Night ≽ 8448380779 ≼ Call Girls In Gurgaon Sector 48 (Gurgaon)
Enjoy Night ≽ 8448380779 ≼ Call Girls In Gurgaon Sector 48 (Gurgaon)
 
Nurturing Families, Empowering Lives: TDP's Vision for Family Welfare in Andh...
Nurturing Families, Empowering Lives: TDP's Vision for Family Welfare in Andh...Nurturing Families, Empowering Lives: TDP's Vision for Family Welfare in Andh...
Nurturing Families, Empowering Lives: TDP's Vision for Family Welfare in Andh...
 
TDP As the Party of Hope For AP Youth Under N Chandrababu Naidu’s Leadership
TDP As the Party of Hope For AP Youth Under N Chandrababu Naidu’s LeadershipTDP As the Party of Hope For AP Youth Under N Chandrababu Naidu’s Leadership
TDP As the Party of Hope For AP Youth Under N Chandrababu Naidu’s Leadership
 
Enjoy Night ≽ 8448380779 ≼ Call Girls In Palam Vihar (Gurgaon)
Enjoy Night ≽ 8448380779 ≼ Call Girls In Palam Vihar (Gurgaon)Enjoy Night ≽ 8448380779 ≼ Call Girls In Palam Vihar (Gurgaon)
Enjoy Night ≽ 8448380779 ≼ Call Girls In Palam Vihar (Gurgaon)
 
Group_5_US-China Trade War to understand the trade
Group_5_US-China Trade War to understand the tradeGroup_5_US-China Trade War to understand the trade
Group_5_US-China Trade War to understand the trade
 
2024 03 13 AZ GOP LD4 Gen Meeting Minutes_FINAL.docx
2024 03 13 AZ GOP LD4 Gen Meeting Minutes_FINAL.docx2024 03 13 AZ GOP LD4 Gen Meeting Minutes_FINAL.docx
2024 03 13 AZ GOP LD4 Gen Meeting Minutes_FINAL.docx
 
Defensa de JOH insiste que testimonio de analista de la DEA es falso y solici...
Defensa de JOH insiste que testimonio de analista de la DEA es falso y solici...Defensa de JOH insiste que testimonio de analista de la DEA es falso y solici...
Defensa de JOH insiste que testimonio de analista de la DEA es falso y solici...
 
Pakistan PMLN Election Manifesto 2024.pdf
Pakistan PMLN Election Manifesto 2024.pdfPakistan PMLN Election Manifesto 2024.pdf
Pakistan PMLN Election Manifesto 2024.pdf
 
Julius Randle's Injury Status: Surgery Not Off the Table
Julius Randle's Injury Status: Surgery Not Off the TableJulius Randle's Injury Status: Surgery Not Off the Table
Julius Randle's Injury Status: Surgery Not Off the Table
 
06052024_First India Newspaper Jaipur.pdf
06052024_First India Newspaper Jaipur.pdf06052024_First India Newspaper Jaipur.pdf
06052024_First India Newspaper Jaipur.pdf
 
AI as Research Assistant: Upscaling Content Analysis to Identify Patterns of ...
AI as Research Assistant: Upscaling Content Analysis to Identify Patterns of ...AI as Research Assistant: Upscaling Content Analysis to Identify Patterns of ...
AI as Research Assistant: Upscaling Content Analysis to Identify Patterns of ...
 
Gujarat-SEBCs.pdf pfpkoopapriorjfperjreie
Gujarat-SEBCs.pdf pfpkoopapriorjfperjreieGujarat-SEBCs.pdf pfpkoopapriorjfperjreie
Gujarat-SEBCs.pdf pfpkoopapriorjfperjreie
 

Airport Updates

  • 1. C H A R L O T T E D O U G L A S I N T E R N AT I O N A L A I R P O R T Connecting the Carolinas to the World
  • 2. C H A R L O T T E D O U G L A S I N T E R N AT I O N A L A I R P O R T 2010 IATA Eagle Award • The International Air Transport Association (IATA) singled out CLT’s achievements with the prestigious Eagle Award in June 2010 • Recognizes outstanding performance in customer satisfaction, cost efficiency and continuous improvement • CLT joins exclusive group of only five U.S. airports to receive award “Charlotte Douglas has the winning combination: low costs, low debt, and solid service levels. The strong financial and operational model at Charlotte Douglas works well for airlines, passengers, and the airport. There can be no greater accolade than the continued support from its major airline customers through this Eagle Award.” (Giovanni) Bisignani, (Director General and CEO, IATA)
  • 3. C H A R L O T T E D O U G L A S I N T E R N AT I O N A L A I R P O R T Airport Mission “Charlotte Douglas International will be the preferred airport and airline hub by providing the highest quality product for the lowest possible cost.”
  • 4. C H A R L O T T E D O U G L A S I N T E R N AT I O N A L A I R P O R T Airline Cost Per Enplaned Passenger $28.00 $24.00 $20.00 $16.00 $12.00 $8.00 $4.00 $0.00 MIA DEN-UA DEN-No UA IND ANC LAX DAL ABQ PBI ORD TPA CMH CLE PHL PIT ATL FLL SDF DFW RSW SFO CVG CLT O&D STL DTW CLT Total Group Median
  • 5. C H A R L O T T E D O U G L A S I N T E R N AT I O N A L A I R P O R T CLT Enplanements 20 18 16 Millions of Passengers Enplaned 14 12 10 8 6 4 2 0 5
  • 6. C H A R L O T T E D O U G L A S I N T E R N AT I O N A L A I R P O R T Airport Fast Facts • 2nd Largest Airport on Eastern Seaboard • 677 Daily Departures (February 2011) • Non-stop service to 134 destinations; 33 int’l • Over 18,000 Employees • 529,101 aircraft operations in 2010 • 38,254,207 passengers in 2010; 10.7% increase over 2009 • Nationwide Rankings 2010: • 7th in Movements/Operations • 11th in Passengers • Worldwide Rankings 2010: • 7th in Movements/Operations • 25th in Passengers * Rankings for 2010 based on preliminary data
  • 7. C H A R L O T T E D O U G L A S I N T E R N AT I O N A L A I R P O R T US Airways CLT Direct Routes
  • 8. C H A R L O T T E D O U G L A S I N T E R N AT I O N A L A I R P O R T Southwest RDU Direct Routes
  • 9. C H A R L O T T E D O U G L A S I N T E R N AT I O N A L A I R P O R T Industry Trends Emerging Hub Trends in the U.S. “Hub access is the name of the game…” • The role of Airline Alliances • Extensive Capacity Reductions • Future Fleet Demand
  • 10. C H A R L O T T E D O U G L A S I N T E R N AT I O N A L A I R P O R T Emerging Hub Trends in the U.S. The Role of the Alliance • Passengers have access to worldwide destinations through airline partners in the alliance • Allows airlines to funnel passengers through hubs rather than extensive point-to-point international destinations • Allows airlines to sell additional tickets by routing passengers through the alliance network • Reduces redundancy of routes by multiple carriers
  • 11. C H A R L O T T E D O U G L A S I N T E R N AT I O N A L A I R P O R T Emerging Hub Trends in the U.S. Capacity Reductions • Airlines taking control of their fate through capacity rather than pricing • Volatility of fuel costs • Effective in reducing costs • Seat capacity system-wide fell 9% in 2009; forecasted to fall another 10% in 2010 • Focus on more hub activity rather than point-to-point service • Capacity cuts include: • Older aircraft with high maintenance costs • 50 and 70 seat aircraft
  • 12. C H A R L O T T E D O U G L A S I N T E R N AT I O N A L A I R P O R T Emerging Hub Trends in the U.S. Fleet Demand in North America Much higher demand for replacement aircraft than new aircraft over next 18-20 yrs
  • 13. C H A R L O T T E D O U G L A S I N T E R N AT I O N A L A I R P O R T Emerging Hub Trends in the U.S. What does this mean to CLT? • Airlines will continue to focus on hub airports as they look for ways to return to profitability • Airports must focus on the metrics that make an attractive hub for the airlines • Geographic location • Expansion Capabilities • Financial Structure
  • 14. C H A R L O T T E D O U G L A S I N T E R N AT I O N A L A I R P O R T The Economic Development Platform • Generates nearly $10 billion in annual economic impact • 100,000 jobs are directly or indirectly supported by the Airport
  • 15. C H A R L O T T E D O U G L A S I N T E R N AT I O N A L A I R P O R T The Economic Development Platform Economic Impact 12,000 Total Economic Impact 10,000 10,000 1976 - $117,000,000 1996 - $4,000,000,000 8,000 2004 - $10,000,000,000 Millions 6,000 4,000 4,000 2,000 117 0 Employment 1976 1978 1980 1982 1984 1986 1988 1990 1992 1994 1996 1998 2000 2002 2004 120,000 100,716 100,000 80,000 71,392 Employment 60,000 1976 - 1,342 jobs 40,000 1996 - 71,392 jobs 2004 - 100,716 jobs 20,000 1,342 0 1976 1978 1980 1982 1984 1986 1988 1990 1992 1994 1996 1998 2000 2002 2004 15
  • 16. C H A R L O T T E D O U G L A S I N T E R N AT I O N A L A I R P O R T Expansion Plans
  • 17. C H A R L O T T E D O U G L A S I N T E R N AT I O N A L A I R P O R T
  • 18. C H A R L O T T E D O U G L A S I N T E R N AT I O N A L A I R P O R T
  • 19. C H A R L O T T E D O U G L A S I N T E R N AT I O N A L A I R P O R T
  • 20. C H A R L O T T E D O U G L A S I N T E R N AT I O N A L A I R P O R T
  • 21. C H A R L O T T E D O U G L A S I N T E R N AT I O N A L A I R P O R T Planned New Intermodal Facility
  • 22. C H A R L O T T E D O U G L A S I N T E R N AT I O N A L A I R P O R T Intermodal Train Facility
  • 23. C H A R L O T T E D O U G L A S I N T E R N AT I O N A L A I R P O R T Global Movement of Goods
  • 24. C H A R L O T T E D O U G L A S I N T E R N AT I O N A L A I R P O R T Existing Intermodal Facility
  • 25. C H A R L O T T E D O U G L A S I N T E R N AT I O N A L A I R P O R T West Blvd/I-485 Interchange
  • 26. C H A R L O T T E D O U G L A S I N T E R N AT I O N A L A I R P O R T Environmental Intermodal trains produce about one third as much CO2 per ton-mile as trucks
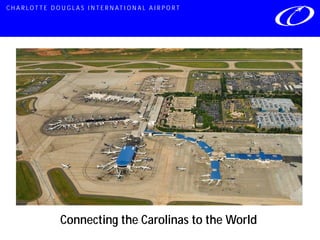
  • 27. C H A R L O T T E D O U G L A S I N T E R N AT I O N A L A I R P O R T Connecting the Carolinas to the World
  • 28. Charlotte Chamber of Commerce Transportation Summit 2011 April 8, 2011
  • 29. 4Q10 / 2010 Highlights • 2010 profit of $447M* - second highest profit in Company history • 4Q10 profit of $28M - first 4Q profit since 2006 • $2.3B in total cash, $364M restricted • Accrued $47M in profit sharing for 2010 • 4Q unit costs* down 1.7% on 4.2% increase in flying • Outstanding operational performance - $24M in operational incentive payouts • A la carte baggage fees generated $483M in 2010, up $81M vs. 2009 * Excludes special items
  • 30. US Airways - 4th Largest Major Network Airline 4Q10 YTD System Capacity Major Network Airlines 250.0 200.0 190.7* 175.7 Low Cost/Other Total ASMs (Bil) 150.0 124.2 100.0 73.6 64.8 50.0 26.2 21.0 18.2 0.0 * Pro forma (United + Continental)
  • 31. Capacity Discipline • Since 2006 US has removed significant domestic capacity • And that trend continued into 2010 Domestic ASM Changes 3Q10 YTD Change in Total ASMs (YOY) (2010 vs. 2006) 8.0% 10.0% 8.0% 7.0% 6.7% 5.0% 6.0% 5.0% 4.1% 4.0% 3.8% - 3.0% (5.0%) 2.0% 1.1% 1.0% 0.5% 0.2% 0.1% (10.0%) 0.0% -0.2% -1.0% (13.1%) (15.0%) (14.4%) -1.1% -2.0% (20.0%) Legacy US LCC 3Q 2010 YOY Capacity Change Source: SEC filings and company reports
  • 32. Industry Capacity Outlook • Industry capacity* growth between 2 and 3 percent in 2011 • US Airways’ system capacity growth of approximately 2 percent • Domestic capacity growth not expected to exceed GDP growth 2011 Estimated System Capacity Growth* 12.0% 7.8% 7.3% 8.0% 4.9% 3.3% Ind. Avg = 2.3% 4.0% 2.0% 0.8% 0.5% 0.0% * J.P. Morgan industry estimates, Feb. 2011. US Airways capacity growth based on company guidance
  • 33. Seismic Changes in Industry Landscape • New a la carte revenue streams – Baggage fees – Choice seating – In-flight charges
  • 34. A la Carte Revenue • Recent Initiatives: A La Carte Revenue ($ mil) – GoGo® Inflight WiFi $514 $425 – Choice Seats – Online bag pre-pay – Premium snacks and beverages $165 – Power-Nap Sack • Generated more than 2008 2009 2010 $500M in revenue in 2010 Bag Fees Other A La Carte
  • 35. Focused Operational Performance Improvements On-time Departure Numbers On-time Arrival Numbers 2007 2008 2009 2010 2007 2008 2009 2010 DeltaFocused on:Northwest US Airways US Airways Delta US Airways United United Northwest US Airways United United Continental Northwest US Airways US Airways •Started boarding early Continental Delta Northwest American United Delta Northwest Continental United American Delta Delta Northwest Continental Continental American •Invested in ticket scanners American United American Continental American United Delta Delta •Closing door early US Airways Continental Continental US Airways American American Mishandled Bags Customer Complaints 2007 •Invested in baggage scanners 2008 2009 2010 2007 2008 2009 2010 Northwest Northwest Northwest US Airways Continental Northwest Continental American •Added block time Continental Continental Continental Continental Northwest Continental American Continental United US Airways US Airways Delta American American Northwest US Airways •Invested in GSE in key cities American United United United Delta Delta US Airways United •Reviewed daily and adjusted Delta American American American United United United Delta US Airways Delta Delta US Airways US Airways Delta Note: Figures are through December 2010. Source: U.S. Department of Transportation
  • 36. US Positioning vs. Other Legacy Carriers 2010 Stage Adjusted CASM (excluding fuel and special items) 2010 Stage Adjusted PRASM 13.77¢ 9.58¢ 15% Advantage 13% Disadvantage 8.37¢ 12.20¢ Network US Network US Stage Adjusted to US Airways YTD average stage length of 981 miles; Network includes new United, American, Delta; Low Cost includes AirTran, JetBlue, and Southwest
  • 37. US Airw ays System Facts 2008 2009 2010 4-05 Jet Fuel/Gal $3.18 1.76 2.25 3.30 Employees 34,000 32,381 31,367 Destinations 230 210 201 Daily Flights 3,700 3,256 3,200 US Purchased 1.4 Billion Gallons of Fuel in 2010 A $1 Increase in a Barrel of Oil Costs US $35 million per Year
  • 38. Charlotte Facts 4Q08 4Q09 4Q10 Daily Flights 550 575 624 Employees 5,955 6,030 6,637 Nonstop Destinations 121 126 133 Domestic 104 102 106 International 17 24 27 London Paris/Rio Rome Frankfurt Extensive Caribbean Network Madrid and Dublin in May Sao Paulo in November
  • 39. Cities* with Hubs (Population) 1. NYC 19.1 11. Phoenix 4.4 2. Los Angeles 12.8 12. San Francisco 4.5 3. Chicago 9.6 13. Seattle 3.4 4. Dallas 6.4 14. Minneapolis 3.3 5. Philadelphia 6.0 15. Denver 2.6 6. Houston 5.9 16. Cleveland 2.1 7. Miami 5.5 17. Cincinnati 2.2 8. Washington 5.5 18. Charlotte 1.7 9. Atlanta 5.5 19. Milwaukee 1.6 10. Detroit 4.4 20. Memphis 1.3 21. Salt Lake City 1.1 *1,000,000 people
  • 40. W hat Do These Cities Have in Com m on • Baltimore • Pittsburgh • Portland All Larger in • Kansas City Population than • Las Vegas Charlotte • San Jose Former Hubs • Columbus • St. Louis
  • 42. Announcements/Statements • Introduced electronic boarding passes in Las Vegas, and Charlotte • Adding MAD and DUB in May • Adding Sao Paulo in November • Hiring 500 (recall of furloughed employees) and up to 200 for WS Call Center • Adding F/C to Express Fleet • Ranked #1 in Wichita State/Purdue AQR
  • 43. The Industry Environment • Looking Ahead – 2011 industry capacity anticipated to be up approximately 2.5% – Industry in early rebound stages with robust business travel and recovering leisure travel – Wall Street very concerned about volatile fuel prices, pace of economic recovery, and high unemployment v Wild Card--- Middle East Unrest
  • 44. Summary • US Airways is well positioned and is outperforming relative to the industry: – Top tier operational performance – Reduced capacity – Aggressive cost management – Industry leading financial performance and margin improvement • US Airways will continue to look for ways to: – Enhance the product and optimize assets – Invest and build upon our safety culture • We Continue to Invest in Charlotte
  • 45. Stock Price Performance 2010 Relative Return 120.0% 106.8% $4.84 to $10.01 100.0% 84.5% 80.0% 64.0% 60.0% 41.6% 40.0% 21.3% 20.0% 13.6% 12.8% 10.7% 0.8% 0.0%