1. 1
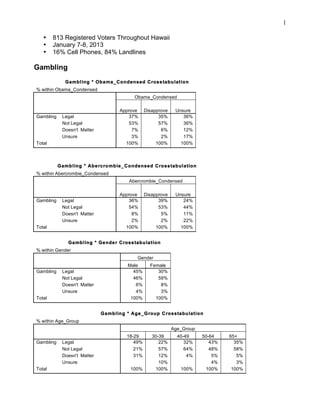
• 813 Registered Voters Throughout Hawaii
• January 7-8, 2013
• 16% Cell Phones, 84% Landlines
Gambling
Gambl ing * Oba ma_Condensed Cross tabu lation
% within Obama_Condensed
Obama_Condensed
Approve Disapprove Unsure
Gambling Legal 37% 35% 36%
Not Legal 53% 57% 36%
Doesn't Matter 7% 6% 12%
Unsure 3% 2% 17%
Total 100% 100% 100%
Gambl ing * Abe rcro mbie_ Condensed Cross tabul ation
% within Abercrombie_Condensed
Abercrombie_Condensed
Approve Disapprove Unsure
Gambling Legal 36% 39% 24%
Not Legal 54% 53% 44%
Doesn't Matter 8% 5% 11%
Unsure 2% 2% 22%
Total 100% 100% 100%
Gambl ing * Gende r Cross tabu lation
% within Gender
Gender
Male Female
Gambling Legal 45% 30%
Not Legal 46% 59%
Doesn't Matter 6% 8%
Unsure 4% 3%
Total 100% 100%
Gambl ing * Age_G roup C rosstabu lation
% within Age_Group
Age_Group
18-29 30-39 40-49 50-64 65+
Gambling Legal 49% 22% 32% 43% 35%
Not Legal 21% 57% 64% 48% 58%
Doesn't Matter 31% 12% 4% 5% 5%
Unsure 10% 4% 3%
Total 100% 100% 100% 100% 100%
2. 2
Gambling * Race_E thncity Cross tabu lation
% within Race_Ethncity
Race_Ethncity
Caucasian Japanese Filipino Hawaiian Chinese Hispanic/Latino Other/Mixed
Gambling Legal 38% 33% 35% 41% 34% 71% 35%
Not Legal 53% 58% 49% 54% 56% 14% 51%
Doesn't Matter 6% 6% 13% 2% 5% 14% 11%
Unsure 2% 4% 3% 4% 5% 3%
Total 100% 100% 100% 100% 100% 100% 100%
Gambl ing * PhoneType Crosstabu lation
% within PhoneType
PhoneType
Both Cell Landline
Gambling Legal 36% 46% 33%
Not Legal 56% 33% 49%
Doesn't Matter 5% 18% 11%
Unsure 3% 3% 7%
Total 100% 100% 100%
Gambl ing * Pol i tics C rosstabu lation
% within Politics
Politics
Liberal/Progressive Moderate Conservative Unsure
Gambling Legal 34% 42% 33% 38%
Not Legal 59% 51% 59% 40%
Doesn't 4% 7% 7% 13%
Matter
Unsure 3% 1% 2% 9%
Total 100% 100% 100% 100%
Gambl ing * Pa rty_ ID Cross tabu lation
% within Party_ID
Party_ID
Democrat Republican Independent Unsure
Gambling Legal 35% 33% 40% 45%
Not Legal 55% 57% 53% 17%
Doesn't Matter 7% 9% 4% 21%
Unsure 3% 2% 2% 17%
Total 100% 100% 100% 100%
3. 3
Gambl ing * Educa tion C rosstabu lation
% within Education
Education
High
No School College Graduate
degree Degree Degree Degree
Gambling Legal 44% 40% 39% 29%
Not Legal 19% 51% 54% 60%
Doesn't Matter 19% 7% 6% 6%
Unsure 19% 3% 1% 6%
Total 100% 100% 100% 100%
Gambl ing * Rela tionship C rosstabu la tion
% within Relationship
Relationship
Married Partner Single Div/Sep Widowed
Gambling Legal 37% 62% 32% 37% 32%
Not Legal 56% 27% 49% 52% 59%
Doesn't Matter 4% 12% 14% 7% 8%
Unsure 3% 5% 5% 1%
Total 100% 100% 100% 100% 100%
Gambl ing * M il ita ry_Fa mi ly C ross tabula tio n
% within Military_Family
Military_Family
Yes No
Gambling Legal 33% 38%
Not Legal 56% 52%
Doesn't Matter 8% 7%
Unsure 3% 3%
Total 100% 100%
Gambl ing * Un ion_Household C ross tabula tion
% within Union_Household
Union_Household
Yes No
Gambling Legal 38% 36%
Not Legal 53% 53%
Doesn't Matter 5% 7%
Unsure 4% 3%
Total 100% 100%
4. 4
Gambl ing * Inco me Cross tabu lation
% within Income
Income
$50,000 $50,000- $100,000
or Less $100,000 or More
Gambling Legal 34% 38% 35%
Not Legal 54% 51% 60%
Doesn't Matter 9% 7% 3%
Unsure 3% 3% 2%
Total 100% 100% 100%
Gambl ing * Vo ted2008 C ross tabula tion
% within Voted2008
Voted2008
No Yes
Gambling Legal 43% 35%
Not Legal 42% 56%
Doesn't Matter 11% 6%
Unsure 5% 4%
Total 100% 100%
Gambl ing * Vo ted2010 C ross tabula tion
% within Voted2010
Voted2010
No Yes
Gambling Legal 44% 35%
Not Legal 46% 55%
Doesn't Matter 5% 7%
Unsure 6% 3%
Total 100% 100%
5. 5
Casino * Obama_ Condensed C ross tabula tion
% within Obama_Condensed
Obama_Condensed
Approve Disapprove Unsure
Casino Support 32% 27% 16%
Oppose 59% 66% 42%
Doesn't Matter 6% 4% 28%
Unsure 3% 2% 14%
Total 100% 100% 100%
Casino * Abe rcro mbie_ Condensed C ross tabula ti on
% within Abercrombie_Condensed
Abercrombie_Condensed
Approve Disapprove Unsure
Casino Support 34% 26% 20%
Oppose 59% 63% 45%
Doesn't Matter 4% 8% 15%
Unsure 2% 3% 20%
Total 100% 100% 100%
Casino * Gende r C ross tabula ti on
% within Gender
Gender
Male Female
Casino Support 35% 25%
Oppose 55% 64%
Doesn't Matter 6% 7%
Unsure 4% 3%
Total 100% 100%
Casino * Age_G roup Cross tabu lation
% within Age_Group
Age_Group
18-29 30-39 40-49 50-64 65+
Casino Support 51% 28% 31% 31% 26%
Oppose 23% 53% 67% 60% 65%
Doesn't Matter 26% 3% 2% 5% 6%
Unsure 15% 4% 2%
Total 100% 100% 100% 100% 100%
6. 6
Casino * Race_E thnci ty C ross tabula tion
% within Race_Ethncity
Race_Ethncity
Caucasian Japanese Filipino Hawaiian Chinese Hispanic/Latino Other/Mixed
Casino Support 36% 15% 40% 28% 31% 38% 27%
Oppose 58% 74% 50% 62% 56% 38% 60%
Doesn't Matter 4% 7% 5% 8% 10% 13% 9%
Unsure 2% 4% 6% 2% 3% 13% 5%
Total 100% 100% 100% 100% 100% 100% 100%
Casino * PhoneType Cross tabu lation
% within PhoneType
PhoneType
Both Cell Landline
Casino Support 26% 51% 39%
Oppose 63% 43% 50%
Doesn't Matter 7% 3% 9%
Unsure 4% 3% 2%
Total 100% 100% 100%
Casino * Pol itics Crosstabu lation
% within Politics
Politics
Liberal/Progressive Moderate Conservative Unsure
Casino Support 31% 33% 25% 29%
Oppose 62% 59% 66% 50%
Doesn't Matter 3% 6% 4% 17%
Unsure 4% 2% 5% 4%
Total 100% 100% 100% 100%
Casino * Party_ ID Cross tabula tion
% within Party_ID
Party_ID
Democrat Republican Independent Unsure
Casino Support 30% 28% 30% 39%
Oppose 60% 68% 62% 14%
Doesn't Matter 7% 2% 7% 25%
Unsure 4% 2% 2% 21%
Total 100% 100% 100% 100%
7. 7
Casino * Education Crosstabu lation
% within Education
Education
High
No School College Graduate
degree Degree Degree Degree
Casino Support 38% 29% 31% 26%
Oppose 44% 60% 59% 64%
Doesn't Matter 8% 7% 6%
Unsure 19% 3% 3% 4%
Total 100% 100% 100% 100%
Casino * Rela tionship C rosstabu lation
% within Relationship
Relationship
Married Partner Single Div/Sep Widowed
Casino Support 29% 54% 26% 36% 21%
Oppose 62% 38% 56% 59% 64%
Doesn't Matter 4% 14% 5% 10%
Unsure 4% 8% 4% 5%
Total 100% 100% 100% 100% 100%
Casino * M il ita ry_Fam ily C ross tabula tion
% within Military_Family
Military_Family
Yes No
Casino Support 26% 30%
Oppose 66% 59%
Doesn't Matter 4% 8%
Unsure 4% 4%
Total 100% 100%
Casino * Union_ Household C rosstabu la tion
% within Union_Household
Union_Household
Yes No
Casino Support 31% 29%
Oppose 61% 60%
Doesn't Matter 6% 7%
Unsure 3% 4%
Total 100% 100%
8. 8
Casino * Inco me C ross tabula ti on
% within Income
Income
$50,000 $50,000- $100,000
or Less $100,000 or More
Casino Support 34% 27% 22%
Oppose 58% 58% 71%
Doesn't Matter 3% 10% 6%
Unsure 4% 4% 1%
Total 100% 100% 100%
Casino * Voted2008 C rosstabu la tion
% within Voted2008
Voted2008
No Yes
Casino Support 38% 27%
Oppose 45% 64%
Doesn't Matter 11% 6%
Unsure 6% 3%
Total 100% 100%
Casino * Voted2010 C rosstabu la tion
% within Voted2010
Voted2010
No Yes
Casino Support 38% 26%
Oppose 47% 64%
Doesn't Matter 6% 7%
Unsure 9% 3%
Total 100% 100%
9. 9
Lotte ry * Oba ma_Condensed Cross tabu lation
% within Obama_Condensed
Obama_Condensed
Approve Disapprove Unsure
Lottery Support 55% 60% 60%
Oppose 35% 32% 19%
Doesn't Matter 6% 3% 10%
Unsure 4% 5% 12%
Total 100% 100% 100%
Lotte ry * Abe rcro mb ie_Condensed Cross tabu lati on
% within Abercrombie_Condensed
Abercrombie_Condensed
Approve Disapprove Unsure
Lottery Support 60% 57% 42%
Oppose 32% 34% 33%
Doesn't Matter 6% 3% 7%
Unsure 2% 6% 18%
Total 100% 100% 100%
Lotte ry * Gende r Cross tabu lation
% within Gender
Gender
Male Female
Lottery Support 65% 52%
Oppose 29% 36%
Doesn't Matter 4% 6%
Unsure 3% 6%
Total 100% 100%
Lotte ry * Age_G roup C rosstabu lation
% within Age_Group
Age_Group
18-29 30-39 40-49 50-64 65+
Lottery Support 64% 55% 58% 66% 51%
Oppose 21% 33% 32% 27% 38%
Doesn't Matter 8% 4% 3% 8%
Unsure 8% 12% 5% 4% 3%
Total 100% 100% 100% 100% 100%
10. 10
Lotte ry * Race_E thncity Cross tabu lation
% within Race_Ethncity
Race_Ethncity
Caucasian Japanese Filipino Hawaiian Chinese Hispanic/Latino Other/Mixed
Lottery Support 59% 58% 59% 63% 51% 75% 53%
Oppose 32% 27% 33% 31% 38% 13% 39%
Doesn't Matter 4% 8% 2% 2% 5% 13% 6%
Unsure 5% 6% 6% 4% 7% 1%
Total 100% 100% 100% 100% 100% 100% 100%
Lotte ry * PhoneType C rosstabu lation
% within PhoneType
PhoneType
Both Cell Landline
Lottery Support 59% 63% 50%
Oppose 33% 27% 34%
Doesn't Matter 4% 4% 11%
Unsure 5% 6% 5%
Total 100% 100% 100%
Lotte ry * Po li tics C rosstabu lation
% within Politics
Politics
Liberal/Progressive Moderate Conservative Unsure
Lottery Support 50% 60% 61% 63%
Oppose 39% 32% 34% 19%
Doesn't Matter 5% 5% 2% 9%
Unsure 6% 4% 3% 9%
Total 100% 100% 100% 100%
Lotte ry * Pa rty_ ID Cross tabu lation
% within Party_ID
Party_ID
Democrat Republican Independent Unsure
Lottery Support 54% 64% 61% 71%
Oppose 35% 32% 31% 7%
Doesn't Matter 6% 1% 5% 4%
Unsure 5% 4% 4% 18%
Total 100% 100% 100% 100%
11. 11
Lotte ry * Educa tion C rosstabu lation
% within Education
Education
High
No School College Graduate
degree Degree Degree Degree
Lottery Support 53% 63% 59% 53%
Oppose 20% 32% 29% 38%
Doesn't Matter 20% 3% 6% 3%
Unsure 7% 2% 6% 6%
Total 100% 100% 100% 100%
Lotte ry * Re lationship C rosstabu la tion
% within Relationship
Relationship
Married Partner Single Div/Sep Widowed
Lottery Support 58% 72% 63% 63% 51%
Oppose 34% 8% 26% 33% 35%
Doesn't Matter 3% 12% 5% 3% 9%
Unsure 5% 8% 7% 5%
Total 100% 100% 100% 100% 100%
Lotte ry * M il ita ry_Fa mi ly C ross tabula tion
% within Military_Family
Military_Family
Yes No
Lottery Support 56% 59%
Oppose 32% 32%
Doesn't Matter 7% 4%
Unsure 5% 5%
Total 100% 100%
Lotte ry * Un ion_Househol d C ross tabula tion
% within Union_Household
Union_Household
Yes No
Lottery Support 62% 58%
Oppose 30% 33%
Doesn't Matter 3% 5%
Unsure 5% 5%
Total 100% 100%
12. 12
Lotte ry * Inco me Cross tabu lation
% within Income
Income
$50,000 $50,000- $100,000
or Less $100,000 or More
Lottery Support 55% 65% 51%
Oppose 34% 24% 43%
Doesn't Matter 7% 2% 3%
Unsure 3% 8% 3%
Total 100% 100% 100%
Lotte ry * Vo ted2008 C ross tabula tion
% within Voted2008
Voted2008
No Yes
Lottery Support 62% 55%
Oppose 31% 35%
Doesn't Matter 2% 5%
Unsure 6% 5%
Total 100% 100%
Lotte ry * Vo ted2010 C ross tabula tion
% within Voted2010
Voted2010
No Yes
Lottery Support 55% 56%
Oppose 34% 35%
Doesn't Matter 1% 5%
Unsure 10% 4%
Total 100% 100%
13. 13
Gambl ing * Casino C ross tabula tion
% within Casino
Casino
Doesn't
Support Oppose Matter Unsure
Gambling Legal 73% 19% 48% 19%
Not Legal 15% 77% 17% 33%
Doesn't Matter 10% 3% 25% 15%
Unsure 2% 2% 10% 33%
Total 100% 100% 100% 100%
Gambl ing * Lotte ry Cross tabula tion
% within Lottery
Lottery
Doesn't
Support Oppose Matter Unsure
Gambling Legal 57% 9% 16%
Not Legal 31% 87% 54% 68%
Doesn't Matter 8% 3% 22% 6%
Unsure 3% 1% 8% 26%
Total 100% 100% 100% 100%
% within Gambling
Gambling
Not Doesn't
Legal Legal Matter Unsure
Casino Support 59% 8% 41% 19%
Oppose 30% 87% 27% 27%
Doesn't Matter 9% 2% 24% 19%
Unsure 2% 2% 8% 35%
Total 100% 100% 100% 100%
Casino * Lotte ry C ross tabula tion
% within Lottery
Lottery
Doesn't
Support Oppose Matter Unsure
Casino Support 45% 8% 24% 3%
Oppose 42% 90% 54% 62%
Doesn't Matter 10% 1% 16%
Unsure 2% 1% 5% 35%
Total 100% 100% 100% 100%
14. 14
Lotte ry * Ga mbling Cross tabula tion
% within Gambling
Gambling
Not Doesn't
Legal Legal Matter Unsure
Lottery Support 89% 34% 66% 48%
Oppose 8% 55% 14% 7%
Doesn't Matter 2% 5% 16% 11%
Unsure 6% 4% 33%
Total 100% 100% 100% 100%
Lotte ry * Cas ino C ross tabula tion
% within Casino
Casino
Doesn't
Support Oppose Matter Unsure
Lottery Support 87% 40% 84% 37%
Oppose 9% 50% 4% 11%
Doesn't Matter 4% 5% 12% 7%
Unsure 0% 5% 44%
Total 100% 100% 100% 100%
15. 15
Civil Unions/Marriage Equality
Civi lUn ion * Obama_Co ndensed C ross tabula tion
% within Obama_Condensed
Obama_Condensed
Approve Disapprove Unsure
CivilUnion Support 60% 24% 31%
Oppose 30% 65% 50%
Doesn't Matter 7% 7% 10%
Unsure 3% 3% 10%
Total 100% 100% 100%
CivilUn ion * Aberc ro mbie_Con densed C ross tabu lation
% within Abercrombie_Condensed
Abercrombie_Condensed
Approve Disapprove Unsure
CivilUnion Support 59% 37% 41%
Oppose 32% 54% 32%
Doesn't Matter 7% 6% 11%
Unsure 3% 3% 16%
Total 100% 100% 100%
Civi lUn ion * Gende r C ross tabula tion
% within Gender
Gender
Male Female
CivilUnion Support 43% 53%
Oppose 46% 38%
Doesn't Matter 7% 6%
Unsure 4% 3%
Total 100% 100%
Civi lUn ion * Age_G roup Cross tabu lation
% within Age_Group
Age_Group
18-29 30-39 40-49 50-64 65+
CivilUnion Support 67% 54% 62% 43% 44%
Oppose 21% 36% 37% 45% 45%
Doesn't Matter 13% 3% 1% 7% 8%
Unsure 7% 5% 3%
Total 100% 100% 100% 100% 100%
16. 16
Civi lUn ion * Race_Ethnc i ty C ross tabula tio n
% within Race_Ethncity
Race_Ethncity
Caucasian Japanese Filipino Hawaiian Chinese Hispanic/Latino Other/Mixed
CivilUnion Support 63% 46% 37% 38% 34% 29% 48%
Oppose 30% 45% 55% 51% 49% 57% 37%
Doesn't Matter 6% 4% 3% 9% 10% 14% 10%
Unsure 1% 5% 5% 2% 7% 5%
Total 100% 100% 100% 100% 100% 100% 100%
Civi lUn ion * PhoneType Cross tabula tion
% within PhoneType
PhoneType
Both Cell Landline
CivilUnion Support 50% 48% 41%
Oppose 41% 42% 41%
Doesn't Matter 6% 9% 11%
Unsure 3% 1% 7%
Total 100% 100% 100%
Civi lUn ion * Pol itics Cross tabu lation
% within Politics
Politics
Liberal/Progressive Moderate Conservative Unsure
CivilUnion Support 80% 55% 18% 35%
Oppose 13% 39% 71% 46%
Doesn't 3% 6% 7% 12%
Matter
Unsure 4% 1% 4% 7%
Total 100% 100% 100% 100%
Civi lUn ion * Party_ID C ross tabula tion
% within Party_ID
Party_ID
Democrat Republican Independent Unsure
CivilUnion Support 67% 24% 36% 48%
Oppose 23% 69% 54% 31%
Doesn't Matter 6% 5% 8% 3%
Unsure 3% 2% 3% 17%
Total 100% 100% 100% 100%
17. 17
Civi lUn ion * Education Cross tabu lation
% within Education
Education
High
No School College Graduate
degree Degree Degree Degree
CivilUnion Support 38% 39% 47% 63%
Oppose 25% 51% 47% 24%
Doesn't Matter 25% 8% 3% 9%
Unsure 13% 2% 4% 4%
Total 100% 100% 100% 100%
Civi lUn ion * Rela tionsh ip C rosstabu lation
% within Relationship
Relationship
Married Partner Single Div/Sep Widowed
CivilUnion Support 48% 56% 54% 42% 49%
Oppose 43% 24% 36% 52% 42%
Doesn't Matter 5% 16% 6% 3% 8%
Unsure 4% 4% 4% 3% 1%
Total 100% 100% 100% 100% 100%
CivilUn ion * Mi l ita ry_Fam ily C rosstab ula tion
% within Military_Family
Military_Family
Yes No
CivilUnion Support 45% 50%
Oppose 44% 41%
Doesn't Matter 6% 6%
Unsure 5% 3%
Total 100% 100%
CivilUn ion * Union_ Household C rosstabu la tion
% within Union_Household
Union_Household
Yes No
CivilUnion Support 51% 48%
Oppose 41% 42%
Doesn't Matter 6% 6%
Unsure 3% 4%
Total 100% 100%
18. 18
Civi lUn ion * Inco me C ross tabula tion
% within Income
Income
$50,000 $50,000- $100,000
or Less $100,000 or More
CivilUnion Support 41% 51% 63%
Oppose 48% 38% 31%
Doesn't Matter 7% 7% 2%
Unsure 3% 4% 4%
Total 100% 100% 100%
Civi lUn ion * Voted2008 C rosstabu la tion
% within Voted2008
Voted2008
No Yes
CivilUnion Support 31% 49%
Oppose 54% 41%
Doesn't Matter 9% 7%
Unsure 6% 3%
Total 100% 100%
Civi lUn ion * Voted2010 C rosstabu la tion
% within Voted2010
Voted2010
No Yes
CivilUnion Support 35% 50%
Oppose 45% 41%
Doesn't Matter 14% 6%
Unsure 6% 3%
Total 100% 100%
19. 19
Marriage * Oba ma_Condensed C rosstabu la tion
% within Obama_Condensed
Obama_Condensed
Approve Disapprove Unsure
Marriage Yes 54% 18% 33%
No 38% 77% 52%
Doesn't Matter 7% 4% 5%
Unsure 2% 1% 10%
Total 100% 100% 100%
Marriage * Abe rc romb ie_Condensed C rosstabu la tion
% within Abercrombie_Condensed
Abercrombie_Condensed
Approve Disapprove Unsure
Marriage Yes 53% 32% 38%
No 41% 60% 43%
Doesn't Matter 6% 5% 7%
Unsure 1% 3% 13%
Total 100% 100% 100%
Marriage * Gende r C rosstabu lation
% within Gender
Gender
Male Female
Marriage Yes 38% 47%
No 56% 43%
Doesn't Matter 4% 7%
Unsure 2% 3%
Total 100% 100%
Marriage * Age_ Group C ross tabula tion
% within Age_Group
Age_Group
18-29 30-39 40-49 50-64 65+
Marriage Yes 67% 58% 59% 37% 35%
No 21% 37% 36% 55% 56%
Doesn't Matter 13% 4% 4% 8%
Unsure 5% 4% 1%
Total 100% 100% 100% 100% 100%
20. 20
Marriage * Race_E thnc ity C rosstabu la tion
% within Race_Ethncity
Race_Ethncity
Caucasian Japanese Filipino Hawaiian Chinese Hispanic/Latino Other/Mixed
Marriage Yes 53% 42% 34% 34% 31% 38% 44%
No 43% 49% 59% 57% 55% 63% 44%
Doesn't Matter 2% 5% 6% 9% 11% 11%
Unsure 2% 4% 1% 3% 1%
Total 100% 100% 100% 100% 100% 100% 100%
Marriage * PhoneType C ross tabula tion
% within PhoneType
PhoneType
Both Cell Landline
Marriage Yes 44% 42% 38%
No 48% 51% 54%
Doesn't Matter 5% 7% 7%
Unsure 3% 2%
Total 100% 100% 100%
Marriage * Po li tics C ross tabula tion
% within Politics
Politics
Liberal/Progressive Moderate Conservative Unsure
Marriage Yes 73% 47% 13% 34%
No 22% 45% 83% 48%
Doesn't Matter 3% 6% 3% 13%
Unsure 3% 2% 1% 5%
Total 100% 100% 100% 100%
Marriage * Pa rty_ID C rosstabu la tion
% within Party_ID
Party_ID
Democrat Republican Independent Unsure
Marriage Yes 61% 18% 31% 48%
No 31% 82% 57% 41%
Doesn't Matter 6% 1% 9%
Unsure 2% 3% 10%
Total 100% 100% 100% 100%
21. 21
Marriage * Educa ti on C ross tabula tion
% within Education
Education
High
No School College Graduate
degree Degree Degree Degree
Marriage Yes 19% 35% 44% 53%
No 50% 56% 52% 38%
Doesn't Matter 31% 7% 4% 4%
Unsure 2% 1% 5%
Total 100% 100% 100% 100%
Marriage * Re lationsh ip C ross tabula tion
% within Relationship
Relationship
Married Partner Single Div/Sep Widowed
Marriage Yes 42% 52% 49% 35% 44%
No 51% 32% 45% 57% 48%
Doesn't Matter 4% 16% 5% 5% 6%
Unsure 3% 2% 3% 1%
Total 100% 100% 100% 100% 100%
Marriage * Mi li tary_Fa mi ly Crosstabu lation
% within Military_Family
Military_Family
Yes No
Marriage Yes 39% 44%
No 54% 48%
Doesn't Matter 5% 5%
Unsure 2% 2%
Total 100% 100%
Marriage * Un ion_Househo ld Cross tabu lation
% within Union_Household
Union_Household
Yes No
Marriage Yes 45% 43%
No 47% 50%
Doesn't Matter 5% 5%
Unsure 3% 2%
Total 100% 100%
22. 22
Marriage * Income C rosstabu lation
% within Income
Income
$50,000 $50,000- $100,000
or Less $100,000 or More
Marriage Yes 34% 48% 55%
No 58% 45% 38%
Doesn't Matter 7% 4% 4%
Unsure 0% 4% 3%
Total 100% 100% 100%
Marriage * Vo ted2008 Cross tabu lation
% within Voted2008
Voted2008
No Yes
Marriage Yes 25% 43%
No 70% 48%
Doesn't Matter 3% 6%
Unsure 2% 3%
Total 100% 100%
Marriage * Vo ted2010 Cross tabu lation
% within Voted2010
Voted2010
No Yes
Marriage Yes 33% 44%
No 58% 48%
Doesn't Matter 5% 6%
Unsure 5% 2%
Total 100% 100%
23. 23
Marriage Decide * Oba ma_Condensed Cross tabu l ation
% within Obama_Condensed
Obama_Condensed
Approve Disapprove Unsure
MarriageDecide Voters 53% 76% 48%
Legislature/Governor 15% 7%
Courts 9% 4% 2%
Federal 15% 11% 19%
Other/Unsure 8% 3% 31%
Total 100% 100% 100%
Marriage Decide * Abe rc romb ie_Condensed Cros stabula tion
% within Abercrombie_Condensed
Abercrombie_Condensed
Approve Disapprove Unsure
MarriageDecide Voters 53% 70% 40%
Legislature/Governor 16% 9% 2%
Courts 10% 4% 11%
Federal 16% 11% 13%
Other/Unsure 6% 6% 35%
Total 100% 100% 100%
Marriage Decide * Gende r Cross tabu lation
% within Gender
Gender
Male Female
MarriageDecide Voters 62% 58%
Legislature/Governor 12% 11%
Courts 6% 8%
Federal 14% 14%
Other/Unsure 7% 9%
Total 100% 100%
Marriage Decide * Age_G roup C rosstabu la tion
% within Age_Group
Age_Group
18-29 30-39 40-49 50-64 65+
MarriageDecide Voters 58% 43% 53% 66% 61%
Legislature/Governor 8% 18% 19% 9% 10%
Courts 5% 10% 11% 5% 6%
Federal 8% 15% 16% 14% 14%
Other/Unsure 21% 13% 1% 5% 9%
Total 100% 100% 100% 100% 100%
24. 24
Marriage Decide * Race_E thnci ty Cross tabu lation
% within Race_Ethncity
Race_Ethncity
Caucasian Japanese Filipino Hawaiian Chinese Hispanic/Latino Other/Mixed
MarriageDecide Voters 60% 59% 59% 60% 64% 71% 62%
Legislature/Governor 11% 16% 14% 11% 7% 14% 9%
Courts 8% 3% 7% 4% 10% 0% 8%
Federal 18% 13% 10% 13% 13% 14% 9%
Other/Unsure 2% 9% 9% 11% 7% 13%
Total 100% 100% 100% 100% 100% 100% 100%
Marriage Decide * PhoneType C rosstabu lation
% within PhoneType
PhoneType
Both Cell Landline
MarriageDecide Voters 62% 56% 49%
Legislature/Governor 13% 7% 7%
Courts 6% 7% 12%
Federal 13% 18% 16%
Other/Unsure 6% 12% 16%
Total 100% 100% 100%
Marriage Decide * Po li tics C rosstabu la tion
% within Politics
Politics
Liberal/Progressive Moderate Conservative Unsure
MarriageDecide Voters 41% 64% 79% 55%
Legislature/Governor 22% 12% 6% 5%
Courts 12% 5% 3% 8%
Federal 15% 13% 9% 18%
Other/Unsure 11% 5% 3% 14%
Total 100% 100% 100% 100%
Marriage Decide * Pa rty_ ID C rosstabu lation
% within Party_ID
Party_ID
Democrat Republican Independent Unsure
MarriageDecide Voters 50% 74% 69% 48%
Legislature/Governor 17% 5% 9%
Courts 11% 3% 3% 3%
Federal 12% 13% 15% 14%
Other/Unsure 9% 4% 3% 34%
Total 100% 100% 100% 100%
25. 25
Marriage Decide * Educa tion C rosstabu la tion
% within Education
Education
High
No School College Graduate
degree Degree Degree Degree
MarriageDecide Voters 41% 63% 65% 51%
Legislature/Governor 18% 7% 8% 24%
Courts 5% 8% 8%
Federal 18% 15% 14% 11%
Other/Unsure 24% 10% 6% 7%
Total 100% 100% 100% 100%
Marriage Decide * Re lationship C ross tabula tion
% within Relationship
Relationship
Married Partner Single Div/Sep Widowed
MarriageDecide Voters 62% 50% 54% 69% 60%
Legislature/Governor 11% 15% 15% 10% 12%
Courts 8% 4% 3% 3% 6%
Federal 12% 19% 16% 14% 13%
Other/Unsure 7% 12% 12% 3% 9%
Total 100% 100% 100% 100% 100%
Marriage Decide * M il itary_Fa mi ly Cross tabula tio n
% within Military_Family
Military_Family
Yes No
MarriageDecide Voters 63% 59%
Legislature/Governor 11% 12%
Courts 6% 7%
Federal 14% 14%
Other/Unsure 7% 8%
Total 100% 100%
Marriage Decide * Un ion_Househo ld C ross tabula tion
% within Union_Household
Union_Household
Yes No
MarriageDecide Voters 56% 62%
Legislature/Governor 14% 11%
Courts 9% 6%
Federal 13% 14%
Other/Unsure 7% 8%
Total 100% 100%
26. 26
Marriage Decide * Inco me Cross tabu lation
% within Income
Income
$50,000 $50,000- $100,000
or Less $100,000 or More
MarriageDecide Voters 55% 65% 57%
Legislature/Governor 14% 11% 14%
Courts 5% 8% 9%
Federal 19% 11% 11%
Other/Unsure 7% 5% 9%
Total 100% 100% 100%
Marriage Decide * Vo ted2008 C ross tabula ti on
% within Voted2008
Voted2008
No Yes
MarriageDecide Voters 72% 58%
Legislature/Governor 5% 13%
Courts 2% 8%
Federal 11% 14%
Other/Unsure 11% 7%
Total 100% 100%
Marriage Decide * Vo ted2010 C ross tabula ti on
% within Voted2010
Voted2010
No Yes
MarriageDecide Voters 61% 58%
Legislature/Governor 10% 12%
Courts 5% 7%
Federal 13% 14%
Other/Unsure 11% 7%
Total 100% 100%
27. 27
Civi lUn ion * Ma rriage Cross tabu lation
% within Marriage
Marriage
Doesn't
Yes No Matter Unsure
CivilUnion Support 95% 11% 29% 25%
Oppose 4% 78% 14% 6%
Doesn't Matter 1% 7% 52% 13%
Unsure 0% 4% 5% 56%
Total 100% 100% 100% 100%
Civi lUn ion * Ma rriageDec ide C ross tabula tion
% within MarriageDecide
MarriageDecide
Voters Legislature/Governor Courts Federal Other/Unsure
CivilUnion Support 38% 71% 62% 63% 43%
Oppose 53% 18% 24% 31% 28%
Doesn't Matter 6% 10% 10% 4% 10%
Unsure 2% 1% 4% 2% 19%
Total 100% 100% 100% 100% 100%
Marriage * C ivi lUn ion Cross tabu lation
% within CivilUnion
CivilUnion
Doesn't
Support Oppose Matter Unsure
Marriage Yes 84% 4% 4% 4%
No 11% 94% 49% 54%
Doesn't Matter 4% 2% 43% 8%
Unsure 1% 0% 4% 35%
Total 100% 100% 100% 100%
Marriage * Marria geDecide C rosstabu la tion
% within MarriageDecide
MarriageDecide
Voters Legislature/Governor Courts Federal Other/Unsure
Marriage Yes 32% 73% 61% 53% 36%
No 61% 24% 31% 39% 39%
Doesn't Matter 5% 1% 8% 6% 14%
Unsure 2% 1% 2% 12%
Total 100% 100% 100% 100% 100%
28. 28
Marriage Decide * C ivilUn ion C ross tabula tion
% within CivilUnion
CivilUnion
Doesn't
Support Oppose Matter Unsure
MarriageDecide Voters 48% 75% 54% 38%
Legislature/Governor 17% 5% 16% 4%
Courts 9% 4% 10% 8%
Federal 18% 10% 8% 8%
Other/Unsure 7% 5% 12% 42%
Total 100% 100% 100% 100%
Marriage Decide * Ma rriage C rosstabu la tion
% within Marriage
Marriage
Doesn't
Yes No Matter Unsure
MarriageDecide Voters 45% 73% 55% 41%
Legislature/Governor 20% 6% 2% 6%
Courts 10% 5% 10%
Federal 17% 11% 14% 12%
Other/Unsure 7% 6% 19% 41%
Total 100% 100% 100% 100%
29. 29
Elections by Mail
VoteByMa il * Obama_Condensed C rosstabu la tion
% within Obama_Condensed
Obama_Condensed
Approve Disapprove Unsure
VoteByMail Yes 52% 40% 26%
No 33% 42% 26%
Doesn't Matter 8% 12% 29%
Unsure 6% 6% 19%
Total 100% 100% 100%
VoteByMa il * Abe rc romb ie_Condensed C rosstab ulation
% within Abercrombie_Condensed
Abercrombie_Condensed
Approve Disapprove Unsure
VoteByMail Yes 54% 42% 35%
No 34% 39% 18%
Doesn't Matter 7% 11% 24%
Unsure 5% 7% 24%
Total 100% 100% 100%
VoteByMa il * Gender C rosstabu la tion
% within Gender
Gender
Male Female
VoteByMail Yes 53% 44%
No 33% 36%
Doesn't Matter 7% 13%
Unsure 6% 8%
Total 100% 100%
% within Age_Group
Age_Group
18-29 30-39 40-49 50-64 65+
VoteByMail Yes 33% 46% 51% 45% 52%
No 41% 32% 37% 38% 32%
Doesn't Matter 18% 8% 8% 10% 10%
Unsure 8% 14% 4% 7% 6%
Total 100% 100% 100% 100% 100%
30. 30
% within Race_Ethncity
Race_Ethncity
Caucasian Japanese Filipino Hawaiian Chinese Hispanic/Latino Other/Mixed
VoteByMail Yes 56% 54% 28% 40% 48% 57% 44%
No 32% 29% 45% 38% 35% 29% 40%
Doesn't Matter 7% 7% 19% 15% 8% 14% 12%
Unsure 5% 10% 8% 8% 8% 4%
Total 100% 100% 100% 100% 100% 100% 100%
VoteByMa il * PhoneType C ross tabula tion
% within PhoneType
PhoneType
Both Cell Landline
VoteByMail Yes 47% 51% 49%
No 34% 42% 32%
Doesn't Matter 11% 6% 7%
Unsure 7% 1% 12%
Total 100% 100% 100%
VoteByMa il * Po litics C ross tabula tio n
% within Politics
Politics
Liberal/Progressive Moderate Conservative Unsure
VoteByMail Yes 54% 47% 47% 40%
No 33% 35% 41% 30%
Doesn't 6% 13% 7% 17%
Matter
Unsure 7% 5% 5% 13%
Total 100% 100% 100% 100%
VoteByMa il * Pa rty_ID C rossta bula tion
% within Party_ID
Party_ID
Democrat Republican Independent Unsure
VoteByMail Yes 53% 44% 48% 17%
No 31% 40% 40% 27%
Doesn't Matter 9% 11% 9% 30%
Unsure 8% 5% 3% 27%
Total 100% 100% 100% 100%
31. 31
VoteByMa il * Educa tion C ross tabula tio n
% within Education
Education
High
No School College Graduate
degree Degree Degree Degree
VoteByMail Yes 50% 47% 46% 50%
No 25% 34% 37% 34%
Doesn't Matter 6% 13% 12% 6%
Unsure 19% 6% 5% 9%
Total 100% 100% 100% 100%
VoteByMa il * Re la tionsh ip Cross tabula tion
% within Relationship
Relationship
Married Partner Single Div/Sep Widowed
VoteByMail Yes 46% 54% 47% 58% 46%
No 37% 31% 32% 29% 37%
Doesn't Matter 11% 12% 10% 10% 8%
Unsure 6% 4% 10% 3% 9%
Total 100% 100% 100% 100% 100%
VoteByMa il * Mi li ta ry_Fam ily C rosstabu lation
% within Military_Family
Military_Family
Yes No
VoteByMail Yes 38% 49%
No 43% 33%
Doesn't Matter 11% 11%
Unsure 8% 7%
Total 100% 100%
VoteByMa il * Un ion_Househo ld Cross tabu lation
% within Union_Household
Union_Household
Yes No
VoteByMail Yes 51% 47%
No 34% 36%
Doesn't Matter 10% 11%
Unsure 5% 7%
Total 100% 100%
32. 32
VoteByMa il * Income C rosstabu la tion
% within Income
Income
$50,000 $50,000- $100,000
or Less $100,000 or More
VoteByMail Yes 41% 48% 56%
No 41% 33% 31%
Doesn't Matter 11% 12% 9%
Unsure 7% 7% 4%
Total 100% 100% 100%
VoteByMa il * Vo ted2008 Cross tabu lation
% within Voted2008
Voted2008
No Yes
VoteByMail Yes 44% 47%
No 36% 35%
Doesn't Matter 15% 10%
Unsure 5% 8%
Total 100% 100%
VoteByMa il * Vo ted2010 Cross tabu lation
% within Voted2010
Voted2010
No Yes
VoteByMail Yes 44% 47%
No 33% 35%
Doesn't Matter 11% 11%
Unsure 11% 6%
Total 100% 100%
33. 33
Budget Deficit
BudgetDe fic it * Obama_Condensed C rosstabu la ti on
% within Obama_Condensed
Obama_Condensed
Approve Disapprove Unsure
BudgetDeficit Excise tax 21% 12% 10%
Retirees 8% 11% 7%
Current employees 23% 35% 14%
Combination 33% 30% 14%
Unsure 15% 12% 55%
Total 100% 100% 100%
BudgetDe fic it * Abe rc romb ie_Condensed C rosstabulation
% within Abercrombie_Condensed
Abercrombie_Condensed
Approve Disapprove Unsure
BudgetDeficit Excise tax 18% 18% 11%
Retirees 10% 8% 4%
Current employees 24% 31% 20%
Combination 35% 29% 20%
Unsure 13% 15% 45%
Total 100% 100% 100%
BudgetDe fic it * Gender C rosstabu la tion
% within Gender
Gender
Male Female
BudgetDeficit Excise tax 15% 20%
Retirees 9% 7%
Current employees 28% 25%
Combination 33% 32%
Unsure 16% 17%
Total 100% 100%
BudgetDe fic it * Age_ Gro up C ross tabula tion
% within Age_Group
Age_Group
18-29 30-39 40-49 50-64 65+
BudgetDeficit Excise tax 8% 20% 24% 16% 18%
Retirees 8% 7% 8% 11%
Current employees 18% 25% 30% 25% 26%
Combination 21% 42% 30% 34% 30%
Unsure 46% 13% 10% 16% 15%
Total 100% 100% 100% 100% 100%
34. 34
BudgetDe fic it * Race_ Ethnc ity C rosstabu la tion
% within Race_Ethncity
Race_Ethncity
Caucasian Japanese Filipino Hawaiian Chinese Hispanic/Latino Other/Mixed
BudgetDeficit Excise tax 17% 19% 10% 11% 21% 13% 27%
Retirees 8% 9% 10% 8% 8% 25% 5%
Current 31% 24% 25% 26% 26% 13% 19%
employees
Combination 36% 31% 24% 28% 38% 38% 29%
Unsure 8% 16% 30% 26% 7% 13% 20%
Total 100% 100% 100% 100% 100% 100% 100%
BudgetDe fic it * PhoneType C ross tabula tion
% within PhoneType
PhoneType
Both Cell Landline
BudgetDeficit Excise tax 18% 16% 16%
Retirees 7% 12% 14%
Current employees 27% 22% 25%
Combination 33% 31% 21%
Unsure 14% 18% 23%
Total 100% 100% 100%
BudgetDe fic it * Po litics C ross tabula tio n
% within Politics
Politics
Liberal/Progressive Moderate Conservative Unsure
BudgetDeficit Excise tax 24% 17% 12% 16%
Retirees 2% 9% 12% 11%
Current 28% 29% 32% 10%
employees
Combination 35% 32% 32% 30%
Unsure 10% 13% 12% 33%
Total 100% 100% 100% 100%
BudgetDe fic it * Pa rty_ID C ross tabula tion
% within Party_ID
Party_ID
Democrat Republican Independent Unsure
BudgetDeficit Excise tax 22% 12% 15% 7%
Retirees 6% 11% 10% 7%
Current 23% 32% 30% 14%
employees
Combination 34% 31% 35% 11%
Unsure 15% 15% 10% 61%
Total 100% 100% 100% 100%
35. 35
BudgetDe fic it * Educa tion C ross tabula ti on
% within Education
Education
High
No School College Graduate
degree Degree Degree Degree
BudgetDeficit Excise tax 18% 18% 15% 21%
Retirees 12% 6% 9% 10%
Current employees 6% 24% 29% 26%
Combination 6% 30% 35% 32%
Unsure 59% 22% 12% 11%
Total 100% 100% 100% 100%
BudgetDe fic it * Re la tionsh ip Cross tabula tion
% within Relationship
Relationship
Married Partner Single Div/Sep Widowed
BudgetDeficit Excise tax 19% 4% 13% 22% 18%
Retirees 6% 12% 9% 7% 18%
Current employees 28% 40% 22% 32% 19%
Combination 34% 20% 35% 30% 27%
Unsure 14% 24% 21% 10% 18%
Total 100% 100% 100% 100% 100%
BudgetDe fic it * Mi li ta ry_Fam ily C rosstabu lation
% within Military_Family
Military_Family
Yes No
BudgetDeficit Excise tax 20% 17%
Retirees 7% 9%
Current employees 26% 26%
Combination 31% 32%
Unsure 16% 15%
Total 100% 100%
BudgetDe fic it * Un ion_Househo ld Cross tabu latio n
% within Union_Household
Union_Household
Yes No
BudgetDeficit Excise tax 28% 13%
Retirees 7% 9%
Current employees 18% 30%
Combination 30% 33%
Unsure 16% 15%
Total 100% 100%
36. 36
BudgetDe fic it * Income C rosstabu la tion
% within Income
Income
$50,000 $50,000- $100,000
or Less $100,000 or More
BudgetDeficit Excise tax 18% 17% 20%
Retirees 10% 6% 9%
Current employees 26% 23% 26%
Combination 27% 39% 35%
Unsure 18% 14% 9%
Total 100% 100% 100%
BudgetDe fic it * Vo ted2008 Cross tabu lation
% within Voted2008
Voted2008
No Yes
BudgetDeficit Excise tax 9% 18%
Retirees 9% 9%
Current employees 22% 28%
Combination 28% 31%
Unsure 31% 14%
Total 100% 100%
BudgetDe fic it * Vo ted2010 Cross tabu lation
% within Voted2010
Voted2010
No Yes
BudgetDeficit Excise tax 10% 18%
Retirees 6% 10%
Current employees 20% 28%
Combination 35% 30%
Unsure 28% 15%
Total 100% 100%
37. 37
PLDC
PLDC * Obama_Condensed C ross tabula tion
% within Obama_Condensed
Obama_Condensed
Approve Disapprove Unsure
PLDC Abolish 27% 34% 10%
Control 38% 30% 17%
Leave alone 11% 14% 7%
Doesn't matter 7% 11% 10%
Unsure 17% 11% 57%
Total 100% 100% 100%
PLDC * Aberc ro mbie_Condensed C ross tabula tio n
% within Abercrombie_Condensed
Abercrombie_Condensed
Approve Disapprove Unsure
PLDC Abolish 22% 38% 13%
Control 41% 30% 19%
Leave alone 14% 10% 6%
Doesn't matter 8% 7% 15%
Unsure 14% 15% 48%
Total 100% 100% 100%
PLDC * Gender C ross tabula tion
% within Gender
Gender
Male Female
PLDC Abolish 36% 22%
Control 31% 39%
Leave alone 13% 10%
Doesn't matter 8% 8%
Unsure 12% 21%
Total 100% 100%
PLDC * Age_G roup C ross tabula tion
% within Age_Group
Age_Group
18-29 30-39 40-49 50-64 65+
PLDC Abolish 41% 25% 23% 28% 28%
Control 8% 20% 39% 38% 40%
Leave alone 15% 10% 17% 10% 11%
Doesn't matter 10% 13% 4% 7% 8%
Unsure 26% 32% 17% 17% 13%
Total 100% 100% 100% 100% 100%
38. 38
PLDC * Race_Ethnc i ty C ross tabula tion
% within Race_Ethncity
Race_Ethncity
Caucasian Japanese Filipino Hawaiian Chinese Hispanic/Latino Other/Mixed
PLDC Abolish 24% 37% 23% 35% 34% 25% 23%
Control 47% 31% 28% 26% 30% 50% 32%
Leave alone 9% 10% 13% 13% 13% 13% 16%
Doesn't matter 7% 6% 14% 7% 7% 7%
Unsure 12% 17% 23% 19% 16% 13% 21%
Total 100% 100% 100% 100% 100% 100% 100%
PLDC * PhoneType C ross tabula ti on
% within PhoneType
PhoneType
Both Cell Landline
PLDC Abolish 28% 32% 28%
Control 38% 28% 28%
Leave alone 10% 19% 18%
Doesn't matter 7% 12% 7%
Unsure 18% 9% 19%
Total 100% 100% 100%
PLDC * Pol itics Cross tabula tion
% within Politics
Politics
Liberal/Progressive Moderate Conservative Unsure
PLDC Abolish 35% 29% 28% 16%
Control 35% 40% 37% 28%
Leave alone 11% 14% 13% 7%
Doesn't matter 5% 5% 7% 14%
Unsure 13% 12% 15% 34%
Total 100% 100% 100% 100%
PLDC * Party_I D C ross tabula tion
% within Party_ID
Party_ID
Democrat Republican Independent Unsure
PLDC Abolish 27% 27% 34% 7%
Control 40% 36% 33% 14%
Leave alone 11% 15% 11% 4%
Doesn't matter 6% 9% 7% 18%
Unsure 16% 13% 14% 57%
Total 100% 100% 100% 100%
39. 39
PLDC * Education Cross tabula tion
% within Education
Education
High
No School College Graduate
degree Degree Degree Degree
PLDC Abolish 6% 25% 31% 30%
Control 24% 36% 37% 38%
Leave alone 24% 12% 11% 11%
Doesn't matter 12% 7% 8% 4%
Unsure 35% 20% 14% 17%
Total 100% 100% 100% 100%
PLDC * Rela tionsh ip Cross tabu lation
% within Relationship
Relationship
Married Partner Single Div/Sep Widowed
PLDC Abolish 28% 35% 33% 18% 27%
Control 37% 12% 27% 52% 41%
Leave alone 12% 38% 11% 7% 6%
Doesn't matter 6% 8% 9% 8% 10%
Unsure 17% 8% 21% 15% 15%
Total 100% 100% 100% 100% 100%
PLDC * Mi li ta ry_Fam ily C rosstabu la tion
% within Military_Family
Military_Family
Yes No
PLDC Abolish 26% 28%
Control 37% 36%
Leave alone 8% 12%
Doesn't matter 12% 6%
Unsure 18% 17%
Total 100% 100%
PLDC * Union_Ho usehold C rosstabu lation
% within Union_Household
Union_Household
Yes No
PLDC Abolish 27% 29%
Control 37% 36%
Leave alone 10% 12%
Doesn't matter 9% 7%
Unsure 18% 16%
Total 100% 100%