Economy... at a glance October 2022
•
0 gostou•4 visualizações

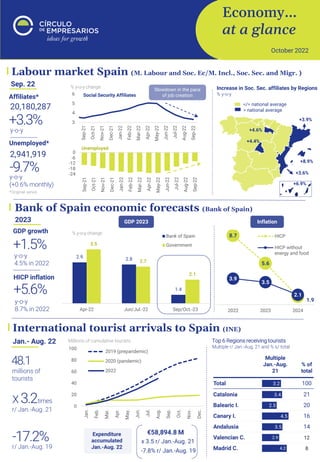
The document provides an economic overview of Spain for September 2022. Some key points: - GDP growth is forecast to be 4.5% in 2022 and 1.5% in 2023, while HICP inflation is forecast to be 8.7% in 2022 and 5.6% in 2023. - The labor market saw a slowdown in job creation but an increase in social security affiliates of 3.3% year-over-year. Unemployment fell 9.7% year-over-year. - International tourist arrivals increased 3.2 times compared to January-August 2021 but spending fell 7.8% compared to January-August 2019, before the pandemic

Recomendados
Mais conteúdo relacionado
Semelhante a Economy... at a glance October 2022
Semelhante a Economy... at a glance October 2022 (20)
Mais de Círculo de Empresarios
Mais de Círculo de Empresarios (20)
Último
Último (20)
Economy... at a glance October 2022
- 1. Economy… at a glance October 2022 2.9 2.8 1.4 3.5 2.7 2.1 Apr-22 Jun/Jul.-22 Sep/Oct.-23 Bank of Spain Government Bank of Spain economic forecasts (Bank of Spain) 3 4 5 6 Sep-21 Oct-21 Nov-21 Dec-21 Jan-22 Feb-22 Mar-22 Apr-22 May-22 Jun-22 Jul-22 Aug-22 Sep-22 Social Security Affiliates -24 -18 -12 -6 0 Sep-21 Oct-21 Nov-21 Dec-21 Jan-22 Feb-22 Mar-22 Apr-22 May-22 Jun-22 Jul-22 Aug-22 Sep-22 Unemployed Labour market Spain (M. Labour and Soc. Ec/M. Incl., Soc. Sec. and Migr. ) Sep. 22 20,180,287 y-o-y +3.3% Affiliates* 2,941,919 y-o-y (+0.6% monthly) -9.7% Unemployed* *Original series % y-o-y change Slowdown in the pace of job creation Increase in Soc. Sec. affiliates by Regions % y-o-y </= national average > national average +6.9% +8.9% +3.6% +3.9% +4.4% +4.6% International tourist arrivals to Spain (INE) millions of tourists X 3.2times Jan.- Aug. 22 48.1 r/ Jan.-Aug. 21 -17.2% r/ Jan.-Aug. 19 Millions of cumulative tourists x 3.5 r/ Jan.-Aug. 21 Expenditure accumulated Jan.-Aug. 22 -7.8% r/ Jan.-Aug. 19 €58,894.8 M Top 6 Regions receiving tourists Multiple r/ Jan.-Aug. 21 and % s/ total 2023 y-o-y 4.5% in 2022 +1.5% GDP growth y-o-y 8.7% in 2022 +5.6% HICP inflation % y-o-y change GDP 2023 8.7 5.6 1.9 3.9 3.5 2.1 2022 2023 2024 HICP HICP without energy and food Inflation 0 20 40 60 80 100 Jan. Feb. Mar. Apr. May. Jun. Jul. Aug. Sep. Oct. Nov. Dec. 2019 (prepandemic) 2020 (pandemic) 2022
- 2. Economy… at a glance, a publication of the “Círculo de Empresarios” produced by its Department of Economy, contains information and opinion from reliable sources. However, the “Círculo de Empresarios” does not guarantee its accuracy and does not take responsibility for any errors or omissions. This document is merely informative. As a result, the “Círculo de Empresarios” is not responsible for any uses that may be made of the publication. The opinions and estimates of the Department can be modified without prior warning. 31 28 33 31 28 2018 2019 2020 2021 2022 60.4 (Jun.21) 62.8 (Nov.21) 59.4 (May.21) 66.6 (Mar.21) 58.1 59.7 55 58.5 49 48.3 47.7 47.8 Spain Italy France Germany Max. Sep-21 Sep-22 Global Digital Competitiveness Index 2022 (IMD) Manufacturing and services PMI Eurozone (Markit) Points (< 50: contraction of economic activity) Sep. 22 r/ max. Jun. 21 -15p. Manufacturing r/ max. Jul. 21 Services -7.6p. Trade in goods and services US (BEA) Points Manufacturing PMI Top 5 (63 economies) 28. Spain ………….. 1. Denmark 2. US 5. Switzerland 3. Sweden 4. Singapore 3 Change r/ 2021 (positions) 1 = 1 1 3 Spain Evolution in the ranking (positions) 54 criteria grouped into 3 factors Technology Knowledge Readiness 27 33 27 Aug. 22 $258,900 M y-o-y +20% Exports $326,300 M y-o-y Imports +13.6% Aug-19 -48,233 Aug-20 -61,115 -71,426 Mar-22 -106.917 -110000 -100000 -90000 -80000 -70000 -60000 -50000 -40000 Aug-19 Nov-19 Feb-20 May-20 Aug-20 Nov-20 Feb-21 May-21 Aug-21 Nov-21 Feb-22 May-22 Aug-22 Million $ Deficit in goods and services Deficit $ -67,400 M -35 -25 -15 -5 5 15 25 35 45 Aug-19 Nov-19 Feb-20 May-20 Aug-20 Nov-20 Feb-21 May-21 Aug-21 Nov-21 Feb-22 May-22 Aug-22 Imports Exports % y-o-y change Trade slowdown 48.4 48.8 45 47 49 51 53 55 57 59 61 63 65 Jan-21 Mar-21 May-21 Jul-21 Sep-21 Nov-21 Jan-22 Mar-22 May-22 Jul-22 Sep-22 Manufacturing Services