Business at a glance... May 2023
•
0 gostou•9 visualizações

Foreign trade Spain Corporate turnover Spain Construction production Eurozone Foreign trade EU Corporatedebt in Asia

Recomendados
Recomendados
Mais conteúdo relacionado
Semelhante a Business at a glance... May 2023
Semelhante a Business at a glance... May 2023 (20)
Mais de Círculo de Empresarios
Mais de Círculo de Empresarios (20)
Último
Último (20)
Business at a glance... May 2023
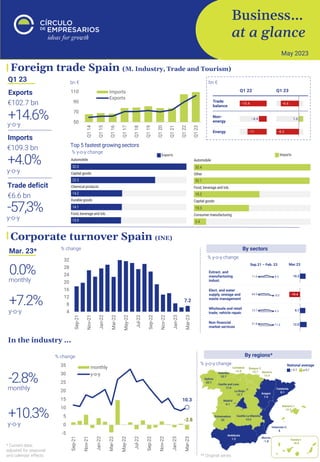
- 1. Business… at a glance May 2023 -2.8 10.3 -5 0 5 10 15 20 25 30 35 Sep-21 Nov-21 Jan-22 Mar-22 May-22 Jul-22 Sep-22 Nov-22 Jan-23 Mar-23 monthly y-o-y Sep.21 – Feb. 23 Mar.23 Foreign trade Spain (M. Industry, Trade and Tourism) Corporate turnover Spain (INE) Mar. 23* monthly 0.0% y-o-y +7.2% Q1 23 Exports €102.7 bn y-o-y +14.6% Imports €109.3 bn y-o-y +4.0% Trade deficit €6.6 bn bn € Top 5 fastest growing sectors -57,3% y-o-y bn € % y-o-y change % change By sectors % y-o-y change In the industry ... * Current data, adjusted for seasonal and calendar effects monthly -2.8% y-o-y +10.3% % change By regions* 7.2 4 8 12 16 20 24 28 32 Sep-21 Nov-21 Jan-22 Mar-22 May-22 Jul-22 Sep-22 Nov-22 Jan-23 Mar-23 50 70 90 110 Q1 14 Q1 15 Q1 16 Q1 17 Q1 18 Q1 19 Q1 20 Q1 21 Q1 22 Q1 23 Imports Exports % y-o-y change ** Original series National average
- 2. Business… at a glance. a publication of the “Círculo de Empresarios” produced by its Department of Economy. contains information and opinion from reliable sources. However. the “Círculo de Empresarios” does not guarantee its accuracy and does not take responsibility for any errors or omissions. This document is merely informative. As a result. the “Círculo de Empresarios” is not responsible for any uses that may be made of the publication. The opinions and estimates of the Department can be modified without prior warning. 16,8 14,0 31,1 28,0 25,8 22,7 18,3 13,3 3,3 22,1 15,8 7,8 6,6 6,3 33,2 29,5 32,6 23,3 20,2 30,2 18,3 56,2 74,8 24,1 17,3 55,4 18,8 27,1 0% 10% 20% 30% 40% 50% 60% 70% 80% 90% 100% World Asia India Thailand China Indonesia Vietnam Malaysia Philipines South Korea Japan Hong Hong Singapore Australia <1 1-4 4 -1.9 -200 -160 -120 -80 -40 0 40 80 Q1 19 Q2 19 Q3 19 Q4 19 Q1 20 Q2 20 Q3 20 Q4 20 Q1 21 Q2 21 Q3 21 Q4 21 Q1 22 Q2 22 Q3 22 Q4 22 Q1 23 Total Energy Construction production Eurozone (Eurostat) Mar. 23 % y-o-y change y-o-y -1.5% Civilengineering y-o-y -2.2% Buildings y-o-y -1.3% % y-o-y change Foreign trade EU (Eurostat) CorporatedebtinAsia(IMF) Q1 23 Exports y-o-y +8.3% Imports y-o-y -3.1% Value bn € €655.7 bn €657.6 bn ▼ trade deficit largely due to ▼ energy prices Trade balance in bn € Debt of vulnerable companies by country % corporate debt according to interest coverage ratio (ICR = interest payment debt covered by profits) Corporate debt in Asia concentrated in companies with low interest coverage ratios ICR <1 → Susceptibility to default 1-4 → Potentially become susceptible to default with ▲ borrowing costs Sep.21 – Feb. 23 Mar.23 850 750 650 550 450 350 Q1 19 Q1 20 Q1 21 Q1 22 Q1 23