Business at a glance... April 2023
•
0 gostou•3 visualizações

Precios exportación/importación industria España Encuesta turismo residentes España Estadísticas de hipotecas sobre viviendas España Clima empresarial Alemania Importaciones de crudo de Rusia en la UE Balanza comercial mensual de bienes EEUU

Recomendados
Recomendados
Mais conteúdo relacionado
Semelhante a Business at a glance... April 2023
Semelhante a Business at a glance... April 2023 (20)
Mais de Círculo de Empresarios
Mais de Círculo de Empresarios (20)
Último
Último (20)
Business at a glance... April 2023
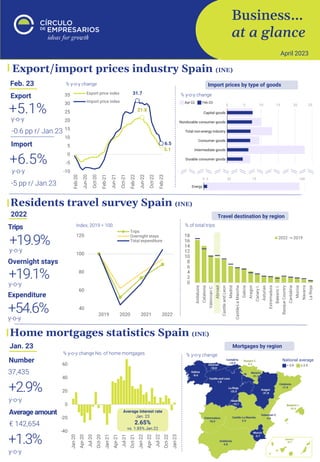
- 1. Business… at a glance April 2023 0 2 4 6 8 10 12 14 16 18 Andalusia Catalonia Valencian C. Abroad Castile and Leon Madrid Castile-La Mancha Galicia Aragon Canary I. Asturias Extremadura Balearic I. Basque Country Cantabria Murcia Navarra La Rioja 2022 2019 21.8 5.1 31.7 6.5 -10 -5 0 5 10 15 20 25 30 35 Feb-20 Jun-20 Oct-20 Feb-21 Jun-21 Oct-21 Feb-22 Jun-22 Oct-22 Feb-23 Export price index Import price index Home mortgages statistics Spain (INE) Jan. 23 % y-o-y change No. of home mortgages y-o-y +2.9% Number 37,435 y-o-y +1.3% Average amount € 142,654 -40 -20 0 20 40 60 Jan-20 Apr-20 Jul-20 Oct-20 Jan-21 Apr-21 Jul-21 Oct-21 Jan-22 Apr-22 Jul-22 Oct-22 Jan-23 Average interest rate Jan. 23 2.65% vs. 1.85% Jan.22 % y-o-y change Mortgages by region Residents travel survey Spain (INE) 2022 Trips y-o-y +19.9% Expenditure y-o-y +54.6% Overnight stays y-o-y +19.1% 40 60 80 100 120 2019 2020 2021 2022 Trips Overnight stays Total expenditure Index, 2019 = 100 Travel destination by region % of total trips Export/import prices industry Spain (INE) Feb. 23 +5.1% y-o-y Export -0.6 pp r/ Jan.23 +6.5% y-o-y Import -5 pp r/ Jan.23 % y-o-y change % y-o-y change Import prices by type of goods National average
- 2. Business… at a glance. a publication of the “Círculo de Empresarios” produced by its Department of Economy. contains information and opinion from reliable sources. However. the “Círculo de Empresarios” does not guarantee its accuracy and does not take responsibility for any errors or omissions. This document is merely informative. As a result. the “Círculo de Empresarios” is not responsible for any uses that may be made of the publication. The opinions and estimates of the Department can be modified without prior warning. Business climate Germany (Ifo Institute) Mar. 23 EU imports of crude oil from Russia (Eurostat) Jan. 23 US monthly trade balance of goods (US Census Bureau) y-o-y -82.8% of total EU crude oil imports (> 25% Jan.22) 4% 8,530.6 Ifo Business Cycle Stoplight 93.3p Ifo Business Climate Index Index, 2015 = 100 70 75 80 85 90 95 100 105 Jan-20 Mar-20 May-20 Jul-20 Sep-20 Nov-20 Jan-21 Mar-21 May-21 Jul-21 Sep-21 Nov-21 Jan-22 Mar-22 May-22 Jul-22 Sep-22 Nov-22 Jan-23 Mar-23 Business Climate Business Situation Business Expectations 95.4p Situation 91.2p Expectations Monthly probability • 66% → expansion (green) • ≤66 - ≥33 → uncertainty (yellow) • < 33% → contraction (red) 0 33 66 99 Jan-20 Mar-20 May-20 Jul-20 Sep-20 Nov-20 Jan-21 Mar-21 May-21 Jul-21 Sep-21 Nov-21 Jan-22 Mar-22 May-22 Jul-22 Sep-22 Nov-22 Jan-23 Mar-23 0 20000 40000 60000 80000 100000 120000 140000 Jan-22 Feb-22 Mar-22 Apr-22 May-22 Jun-22 Jul-22 Aug-22 Sep-22 Oct-22 Nov-22 Dec-22 Jan-23 US Norway Kazakhstan Russia Thousands barrels Top 3 suppliers + Russia thousands barrels Price volatility following the outbreak of war in Ukraine $/barrel, 4 main types of crude oil imported into the EU 98.7 50.7 126 85.4 40 60 80 100 120 140 Jan-22 Feb-22 Mar-22 Apr-22 May-22 Jun-22 Jul-22 Aug-22 Sep-22 Oct-22 Nov-22 Dec-22 Jan-23 Kazakhstan Norway Russia US ≈ 82 Jan.22 Jan.23 Position in supplier ranking Russia 1st → 10th US 4th → 1st Feb. 23 monthly +0.6% y-o-y -13% * Seasonally and calendar adjusted data Deficit $ 91,626 M -106.8 -125.7 -85.8 -98.6 -82.1 -91.6 -130 -125 -120 -115 -110 -105 -100 -95 -90 -85 -80 Jan-22 Feb-22 Mar-22 Apr-22 May-22 Jun-22 Jul-22 Aug-22 Sep-22 Oct-22 Nov-22 Dec-22 Jan-23 Feb-23 Billions of $ By type of product % monthly change Feb.23 Improving