Así está the company... Septiember 2016 Circulo de Empresarios
•
0 gostou•64 visualizações


Recomendados
Recomendados
Mais conteúdo relacionado
Mais procurados
Mais procurados (20)
Destaque
Destaque (13)
Semelhante a Así está the company... Septiember 2016 Circulo de Empresarios
Semelhante a Así está the company... Septiember 2016 Circulo de Empresarios (20)
Mais de Círculo de Empresarios
Mais de Círculo de Empresarios (20)
Último
Último (20)
Así está the company... Septiember 2016 Circulo de Empresarios
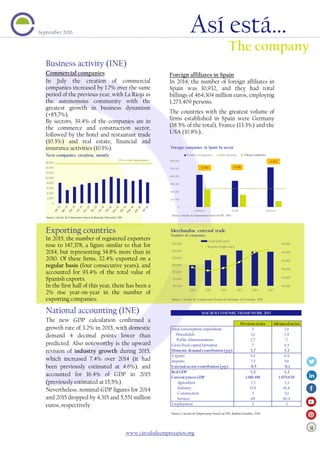
- 1. www.circulodeempresarios.org Business activity (INE) Commercial companies In July the creation of commercial companies increased by 1.7% over the same period of the previous year, with La Rioja as the autonomous community with the greatest growth in business dynamism (+85,7%). By sectors, 39.4% of the companies are in the commerce and construction sector, followed by the hotel and restaurant trade (10.3%) and real estate, financial and insurance activities (10.1%). Exporting countries In 2015, the number of registered exporters rose to 147,378, a figure similar to that for 2014, but representing 34.8% more than in 2010. Of these firms, 32.4% exported on a regular basis (four consecutive years), and accounted for 93.4% of the total value of Spanish exports. In the first half of this year, there has been a 2% rise year-on-year in the number of exporting companies. National accounting (INE) The new GDP calculation confirmed a growth rate of 3.2% in 2015, with domestic demand 4 decimal points lower than predicted. Also noteworthy is the upward revision of industry growth during 2015, which increased 7.4% over 2014 (it had been previously estimated at 4.6%), and accounted for 16.4% of GDP in 2015 (previously estimated at 15,5%). Nevertheless, nominal GDP figures for 2014 and 2015 dropped by 4,315 and 5,551 million euros, respectively. Foreign affiliates in Spain In 2014, the number of foreign affiliates in Spain was 10,932, and they had total billings of 464,304 million euros, employing 1,273,409 persons. The countries with the greatest volume of firms established in Spain were Germany (18.5% of the total), France (13.3%) and the USA (10.8%).. 0 100.000 200.000 300.000 400.000 500.000 600.000 Industry Trade Services Foreign companies in Spain by sector Number of employees Sales turnover Source: Círculo de Empresarios based on INE, 2016 3.090 3.678 4.163 Foreign companies Previous series Advancedseries Final consumption expenditure 3 2,6 Households 3,1 2,9 Public Administrations 2,7 2 Gross fixed capital formation 7 6,5 Domestic demandcontribution (pp) 3,7 3,3 Exports 5,4 4,9 Imports 7,5 5,6 External sector contribution (pp) -0,5 -0,1 Real GDP 3,2 3,2 Current prices GDP 1.081.190 1.075.639 Agriculture 2,3 2,3 Industry 15,5 16,4 Construction 5 5,1 Services 68 66,9 Employment 3 3 MACROECONOMIC FRAMEWORK 2015 0 2.000 4.000 6.000 8.000 10.000 12.000 14.000 16.000 New companies creation, montly Source: Círculo de Empresarios based on Registro Mercantil, 2016 Pre-crisis maximums Así está… 30.000 34.000 38.000 42.000 46.000 50.000 50.000 70.000 90.000 110.000 130.000 150.000 170.000 2010 2011 2012 2013 2014 2015 Merchandise external trade Number of companies Total (left axis) Regular (right axis) Source: Círculo de Empresarios based on Ministry of Economy, 2016 September 2016 The company Source: Círculo de Empresarios based on INE, Bankia Estudios, 2016
- 2. ‘Así está…The company’, a publication of the Círculo de Empresarios produced by its Department of the Economy, contains information and opinion from reliable sources. However the Círculo de Empresarios does not guarantee its accuracy and does not take responsibility for any errors or omissions. This document is merely informative. As a result, the Círculo de Empresarios is not responsible for any uses that may be made of the publication. The opinions and estimates of the Department can be modified without any warning. www.circulodeempresarios.org Real Sector Present situation According to the General Notary Board, in the first six months of 2016 (in seasonally adjusted terms) 42,230 homes were sold in Spain. This represents an increase of 15.9% with respect to the same period of 2015, something principally explained by the creation of jobs, an increase in disposable income, and some more favorable financing conditions. Financing costs Since 2014, credit conditions among companies have improved notably in part due to: The cleanup of the banking system The recovery of solvent demand for credit The financial develeraging ECB monetary easing In addition to this, the gap between large size and small size companies interest rates has reduced almost a half since august-12 (288 bp 119 bp), in line with the Eurozone average. Non performing loans According to the IMF, the non performing loans rate in China is increasing, and is now approximately at 14% (35% of GDP). The eventual cost of a bailout could rise to 30% of the GDP, one of the largest figures in world history. Moreover, massive levels of stimulus in order to prevent a hard landing of the chi- nese economy thus far, will not last. Perspectives In the 2Q of 2016 the annual rate of change in the Home Price Index (INE) was 3.9% higher (6.3% in the 1Q), thus confirming the trend toward price increases that was begun in 2015. Predictions for the second half of the year are positive, although there is expected to be slight moderation in pric- es due to Spain’s political uncertainty and predictions of slower economic growth. Demand indicators Newoperations interest rate (%) 1,99 Newhomes sales(%, YoY) 17,8 Disposable income (%, YoY) 32,2 Supply indicators Approval for newresidential construction(%, monthly) 41,3 Cement consumption(%, monthly) 3 Construction unemployment (%, monthly) -1,7 Real state indicators July or latest data 0 1 2 3 4 5 6 2003 2004 2005 2006 2007 2008 2009 2010 2011 2012 2013 2014 2015 1T-2016 Yuan of credit growth requiered to generate 1 yuan of China GDP growth ¥ Source: Círculo de Empresarios based on Morgan Stanley Research, 2016 -3 -1 1 3 5 7 9 1Q-2014 2Q-2014 3Q-2014 4Q-2014 1Q-2015 2Q-2015 3Q-2015 4Q-2015 1Q-2016 2Q-2016 Annual home sales prices (IPV) General index New homes Second hand homes General index Source: Círculo de Empresarios based on INE, BBVA Research, 2016 -30 -25 -20 -15 -10 -5 0 5 10 15 2012 2013 2014 2015 Jan-May 2016 New credit operations Annual change (%) < 1 million > 1 million Total Source: Círculo de Empresarios based on BBVA-IVIE, 2016 August 2015-16 18% cost Source: Círculo de Empresarios based on BBVA Research, 2016 ECB’s Quantitative Easing * Official data: 2% ** China need 6 yuan credit growth to generate 1 yuan of China GDP growth