
Recomendados
Recomendados
Mais conteúdo relacionado
Mais procurados
Mais procurados (20)
Semelhante a Error detection in census data age reporting
Semelhante a Error detection in census data age reporting (20)
Último
Último (20)
Error detection in census data age reporting
- 1. 1 International Journal of Science, Engineering and Innovative Research Vol. 7, January 2016 ERROR DETECTION IN CENSUS DATA AGE REPORTING Obisesan K.O.1 , Mojoyinola M.O.2 Department of Statistics University of Ibadan, Nigeria (1 obidairo@gmail.com, 2 olumidemubarak@gmail.com) Abstract- Age is an important demographic variable that must be carefully considered in all demographic survey. The objective of this study is to conduct a comprehensive assessment of the age reporting in Census data. The study gave an estimate of age misrepresentation in the Nigeria 2006 Population and Housing Census Data. The data used in this study was obtained from the 2006 Population and Housing Census Priority Table, Volume(III)published by the National Population Commission, Abuja, Nigeria, in April 2010. Age heaping and digit preference were measured using modified Whipple's index and Myers index. Age Sex accuracy was also measured using the United Nation's age-sex accuracy index. The reported Whipple's index for both sexes was 251 indicating presence of age heaping and it also showed age heaping at terminal digit 0 and 5 as 268 and 233 respectively. The Myers index had an overall index of 50.9, 49 for male and 52.82 for female population. The evaluation of Nigeria 2006 Population and Housing Census Data based on the technique applied in this study indicates that the data is of poor quality as a result of the presence of age heaping and digit preference in recorded ages. Therefore modern methods such as a systematic data management system, compulsion to register birth, and standard smoothing techniques are thereby recommended for future data collection. Keywords- Census, Age Heaping , Digit Prefernce. I. INTRODUCTION In the demographic study of a population, age is an important variable used in the description of the population structure and growth rate forecasting. Age data are important in determining basic factors of population dynamics and studying fertility, mortality, and migration. Data on age are essential in population estimates and projections. From age distribution of any population, estimates of school-age population can be made as well as number of voters, entrants in labour force, and in planning of social services for instance, for mother, children, aged e.t.c has to be based on age distribution of the population. The presence of error in this important variable is an obstacle to proper planning and decision making in both governmental and non-governmental agencies, a decision based on inaccurate data will definitely not produce the desired outcome. Age misrepresentation is a common problem in developing countries (Gonzalez et al, 2014).Thereby making its study an essential step to reducing its occurrence. The most common irregularity in age data is the age heaping. Age data frequently display excess frequencies at round or preferred ages, such as even numbers and multiples of 5, leading to age heaping. Age heaping is considered to be a measure of data quality and consistency (Pardeshi, 2010). Bello (2012), while assessing the quality of outpatients’ age data found age heaping to be one of the irregularities in survey reporting of age in Nigeria. II. BACKGROUND OF STUDY Borkotoky and Unisa (2014) examined the quality data on large scale survey data. In their study, age misreporting was observed and it differs by region to region and individual characteristics. They also identified illiteracy, rural residence and poor economic conditions as some of the factors associated with age misreporting. It was concluded in the study that “age misreporting, inconsistency and incomplete response are three sources of error that needed to be considered before drawing conclusion from any survey". In the paper “Error Detection in Outpatients Age Data Using Demographic Techniques" by Bello (2012), where he evaluated the accuracy of age reporting by the outpatients in General Hospital Dutsin-ma, Katsina state, Nigeria. Using demographic techniques, which includes Whipple's Index, Myer's Blended Index and UN Age-sex Accuracy Index. His research showed very rough age data reporting for both male and female outpatients. He found `5' and `0' to be the most preferred digits, and `1' as the most avoided digit for both sexes.
- 2. International Journal of Science, Engineering and Innovative Research, Volume 7, January 2016 2 WWW.IJSEIR.ORG Paper ID: 45734716ISSN: 2412-513X Susuman et.al (2012) assessed the quality of age reported in the Tanzania 2012 population census data by measuring age heaping and digit preference using the Whipple's Index, Myer's index, and Age-Sex Accuracy Index. They recorded a Whipple's Index of 154.43 for both sexes, the male population was found to have a lower Index of about 152.65 while the females had the higher Index of about 156.07. Digit preferences were at `0' and `5' while avoidances were at digit `1' and `3' for both sexes. In a similar study by Pardeshi (2010), the quality of age data collected during a community survey in the district of Yavatmal, Maharashtra, India was assessed. Whipple's Index, Myre's Blended Index, Age Ratio Score and Age Accuracy Index were used in measuring the age heaping and digit preference. The age data collected was found to be of very poor quality. 42% of the population reported incorrect digit and preferences were found at digits `0' and `5'. Also in the study “Age Reporting Behavior, A case study of 1991 and 2000 Population and Housing Census, Malaysia" by Talib et al.(2007). They applied Pyramid chart, Whipple's Index and test differences of the terminal digits to analyse the quality of single years of age population. The study found that misstatements in age reporting were due to digit preference and avoidance in both censuses. Denic et al.(2004) also studied the quality of age data in patients from developing countries. The study used a data of 3874 cancer patients from 72 developing countries, mainly from the Indian subcontinent and the Middle East. The Whipple's Index and Myer's Index were used. Age data quality was found to be low in cancer patients from the Indian subcontinent and Middle Eastern countries, the male citizens of the UAE did not show preference for terminal digits `0' while preference for terminal digits `0' and `5' were found in other populations. Finally, the study concluded that age data quality should be analysed as it may bias results and weaken the power of the study. Prepare Your Paper Before Styling Before you begin to format your paper, first write and save the content as a separate text file. Keep your text and graphic files separate until after the text has been formatted and styled. Do not use hard tabs, and limit use of hard returns to only one return at the end of a paragraph. Do not add any kind of pagination anywhere in the paper. Do not number text heads- the template will do that for you. Finally, complete content and organizational editing before formatting. Please take note of the following items when proofreading spelling and grammar: III. METHODOLOGY This section gives a description of the demographic methods used for measuring the extent of age heaping and digit preference. The methods are Whipple's index and Myers' blended index respectively. Age-sex accuracy index was also calculated. 1. WHIPPLE'S INDEX Age misreporting constitutes one of demography's most frustrating problems" (Ewbank1981:88). To detect it, demographers have developed different methods to assess the quality of age data. Among these methods, age heaping indices have been proposed to detect the degree of preference or avoidance for specific digits in age reporting. The index was invented by the American demographer George C. Whipple (1866 - 1924). Whipple's index is highly sensitive to age heaping on ages ending in 0 and 5. This index applies to single years of age returns between ages 23 and 62 inclusive. It is obtained by summing the number of persons in this age range, and calculating the ratio of reported ages ending in 0 or 5 to one-fifth of the total sample. It varies between 1 (indicating no preference for ages ending by 0 and 5) and 5 (indicative of a complete report on ages ending by 0 and 5): ACKNOWLEDGMENT(HEADING 5) The preferred spelling of the word “acknowledgment” in America is without an “e” after the “g”. Avoid the stilted expression, “One of us (R. B. G.) thanks . . .” Instead, try “R. B. G. thanks”. Later modifications of the W index gave a more precise and synthetic mean to assess the accuracy of single-year age data. W measures only preferences for (or avoidance of) ages ending by 0 and 5 indistinctively. However, opposite effects of digit preferences and avoidances can potentially cancel each other out and affect the original Whipple's index. To remove this constraint, two modifications have been made to the original formulation of W (Roger et al. 1981;Noumbissi 1992).The first change made it possible to distinguish between preferences for ages ending on 0 and those ending in 5 as follows (Roger et al., 1981, p. 148): By summing W0 and W5 and dividing the sum by 2, we return to the original Whipple's index (W) Though this first modification provides a means to distinguish between preferences for ages ending in 0 and those ending in 5, it is nonetheless based on the unrealistic assumption of linearity over a ten-year age range. The second modification, proposed by Noumbissi (1992), returns to a more reasonable assumption of linearity over an age range of five years rather than ten. Based on the same basic principles of the original Whipple's index (linearity and rectangularity over a 5-year age range), the latter modification allows to measure age heaping for all digits. Through the digit-specific modified Whipple's
- 3. International Journal of Science, Engineering and Innovative Research, Volume 7, January 2016 3 WWW.IJSEIR.ORG Paper ID: 45734716ISSN: 2412-513X index (Noumbissi 1992), age heaping could hence being computed distinctively for all ending digits (and not the sole 0 and 5 as in the original Whipple's index). Age heaping can be calculated thus: Age heaping can thus be calculated for all ten digits (0-9). For each digit, the degree of preference or avoidance can be determined as follows: Where Px is the population of completed age x and 5Px the population of the age range (x, x+4). If there is no digit preference or avoidance this “digit-specific modified Whipple's index" is equal to 1. An index above or below 1 signifies, respectively, preference for or avoidance of the digit in question . The index can be summarized through the following categories: Table 1: Value of Whipple's index Highly accurate data <= 105 Fairly accurate data 105 – 109.9 Approximate data 110 – 124.9 Rough data 125 – 174.9 Very rough data >= 175 1. MYRES INDEX Myers Index is usually used to measure degree of preference for each digit and it provides summary index for all terminal digits. The summary index is an estimate of the minimum proportion of persons in the population for whom an age with an incorrect final digit is reported. The theoretical range of the index is from zero to ninety (Hobbs, 2004). It can be used to report errors for all ages 10 – 89 years (Kpedekpo, 1982). The underlined assumption of this method is that in the absence of systematic irregularities in the reporting of age, the blended sum at each terminal digit should be approximately equal to 10% of the total blended population. If the sum at any given digit exceeds 10% of the total blended population, it indicates over selection of ages ending in that digit (digit preference). On the other hand, a negative 30 deviation (or sum that is less than 10% of the total blended population) indicates under-selection of the ages ending in that digits (digit avoidance). If age heaping is non- existent, the index would be approximately 0 (Kpedekpo, 1982). The procedure for computation is as follows: 1. Sum all the population ending in each terminal digit over the whole range for the ages 10 – 89. 2. Sum all the population ending in each terminal digit over the whole range for the ages 20 – 89. 3. Multiply the sums of ages at each terminal digit in (1) above by co-efficient, 1,2,3,4,5,6,7,8,9,10. 4. Multiply the sums of ages at each terminal digit in (2) above by co-efficient 9,8,7,6,5,4,3,2,1,0. 5. Add the product of (3) and (4) above to obtain the blended sum at each terminal digit. 6. Add up the blended sum in (5) above. 7. Find the percentage of the blended sum at each terminal digit to the total of the blended sum. 8. Find the deviation of the percentage distribution from 10. 2. UNITED NATION AGE SEX ACCURACY INDEX. This index which was proposed by the United Nation is used for evaluation of five-year age-sex data. The index is also referred to as Joint Score. It has three components: 1. Average Sex Ratio Score (ASRS) This score is obtained by first calculating the sex ratio at each age group. Successive differences irrespective of sign are added and averaged. 𝐴𝑔𝑒 𝑠𝑝𝑒𝑐𝑖𝑓𝑖𝑐 𝑠𝑒𝑥 𝑟𝑎𝑡𝑖𝑜 = 5𝑃𝑥 𝑚 5𝑃𝑥 𝑓 𝑋 100 (15) 5Pxm = males aged x to x +5 5Pxr = females aged x to x +5 2. Average Male Age Ratio Score (AMRS) For each age group for males, calculate the age ratios computed as 𝐴𝐺𝐸 𝑅𝐴𝑇𝐼𝑂 = 5𝑃𝑥 0.5(5𝑃𝑥+1 + 5𝑃𝑥−1) 𝑋 100 (16) The deviations from unity irrespective of sign are added and averaged (AMRS) 3. Average Female Age Ratio Scores (AFRS) For each age group for females, the age ratios are calculated using the same formulae as for males. The deviations from unity irrespective of sign are added and averaged (AFRS) The index is then computed as UNAI = 3 (S) + (M+ F): Where; S = Average Sex Ratio Difference.
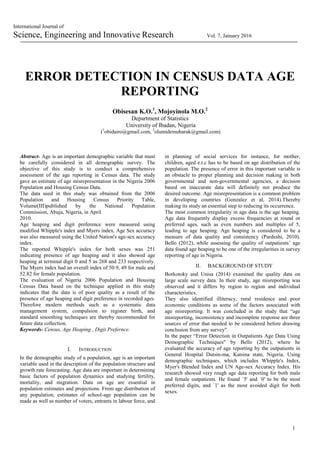
- 4. International Journal of Science, Engineering and Innovative Research, Volume 7, January 2016 4 WWW.IJSEIR.ORG Paper ID: 45734716ISSN: 2412-513X M = Average Male Deviation from 100. F = Average Female Deviation from 100. The reported age-sex data for a given population is presumed to be accurate if the age-sex accuracy index is between 0 and 19.9, inaccurate if the index is between 20 and 39.9, and highly inaccurate if the index is above 40. IV. RESULTS 1. WHIPPLE’S INDEX TABLE 2: WHIPPLE’S INDEX RESULT TERMINAL DIGITS TOTAL MALES FEMALES W0 267.87 265.46 270.36 W1 36.30 37.96 34.55 W2 72.05 73.27 70.76 W3 64.99 66.21 63.79 W4 56.05 57.80 54.34 W5 233.32 227.18 239.32 W6 64.54 67.16 61.99 W7 67.28 67.76 66.81 W8 81.37 79.46 83.31 W9 51.09 52.98 49.17 WI 251 247 255 Table (2) shows the Whipple's Index for Nigeria 2006 population data, it shows age preference for each of the ten terminal digit (0-9) developed by Noumbissi(1992). From the table one can conclude that ages with terminal digits 0, and 5 are very inaccurate. And the overall Whipple's index value of 251 shows the presence of Age heaping for both sexes, the male population has an index of 257 and the female 255 which are both high and qualify the data as very rough. FIGURE 1: NIGERIA WHIPPLES INDEX FOR EACH TERMINAL DIGIT FIGURE 2: MALE WHIPPLE’S INDEX FOR EACH TERMINAL DIGIT. FIGURE 3: FEMALE WHIPPLE’S INDEX FOR EACH TERMINAL DIGIT. 2. MYRES INDEX Note: Terminal digit(1), Sum (10 - 79) (2), Sum (20 - 79) (3), Coefficients(4),Coefficients(5),Blendedsum(6)=(2*4)+(3*5),P ercentage distribution (%)(7),Deviation from 10%(8),Re- marks(9).
- 5. International Journal of Science, Engineering and Innovative Research, Volume 7, January 2016 5 WWW.IJSEIR.ORG Paper ID: 45734716ISSN: 2412-513X Note: Terminal digit(1), Sum (10 - 79) (2), Sum (20 - 79) (3), Coefficients(4),Coefficients(5),Blendedsum(6)=(2*4)+(3*5), Percentage distribution (%)(7),Deviation from 10%(8),Re- marks(9). Note: Terminal digit(1), Sum (10 - 79) (2), Sum (20 - 79) (3), Coefficients(4),Coefficients(5),Blendedsum(6)=(2*4)+(3*5), Percentage distribution (%)(7),Deviation from 10%(8),Re- marks(9). Table (3, 4 & 5) show Myers Blended Index for the whole population, male population and female population respectively, they reveal their respective indices of 50.9, 49 and 52.82. However, ages ending with `1' have the highest avoidance for both male and female population while ages ending with `0' have the highest preference, followed by ages ending with `5' and `8'. Figure 4: MALES MYERS INDEX FOR EACH TERMINAL DIGIT Figure 5: FEMALES MYERS INDEX FOR EACH TERMINAL DIGIT Figure 6: MALES MYERS INDEX FOR EACH TERMINAL DIGIT
- 6. International Journal of Science, Engineering and Innovative Research, Volume 7, January 2016 6 WWW.IJSEIR.ORG Paper ID: 45734716ISSN: 2412-513X 3. UN AGE-SEX ACCURACY INDEX The analysis of the UN Age-sex Accuracy Index shows that the male and female populations have an approximately equal value for the Age ratio, except for age group 70 – 74 and 85+ where that of the male was higher. The population has an average sex ratio value of approximately 9.02 and male and female age ratio of about 19.81 and 21.39 respectively. The UNAI of 68.29 was recorded which according to the proposed scale by the UN qualifies the data as of poor quality. V. RECOMMENDATIONS 1. Increase awareness about birth registration with the National Population Commission. 2. Make birth registration at birth compulsory for parents. 3. Using analytical approaches such as smoothing technique to improve age data. 4. Adoption of accurate Age and Sex data collection model used in developed countries. 5. Age data should be collected with date of birth as this reduces error of digit preference. VI. CONCLUSION In conclusion, all analyses in this study indicate that age-sex reporting in Nigeria 2006 Population and Housing Census Data is erroneous and needs to be properly checked. The next census in Nigeria is reported to take place in the year 2017 thus the need for the implementation of all recommendations in this study. REFERENCES [1] Abd. Latib Talib, Mohd SofiAli, Martini Sahul Hamid and Khamsiah M, Ohd Zin, (2007). “Age reporting behaviour: a case study of 1991 and 2000 population and housing census, Malaysia”. Department of Statistics Malaysia. [2] A. Sathiya Susuman, et al. (2012) “An assessment of the age reporting in Tanzania population census 2012”. Journal of Social Sciences Research Vol. 8, No. 2. [3] Bello Y. (2012). “Error detection in outpatients age data using demographic techniques”. International journal of Pure and Applied Science and Technology. 10(1): 27 – 36. [4] Borkotoky K, Unisa S (2014).” Indicators to examine the quality of large scale survey data:an example through district level household and facility survey”. journal.pone.0090113. [5] Denic, S., Khatib, F. & Saadi, H. (2004). “Quality of age data in patients from developing countries”. Journal of Public Health, 26(2):168- 171. [6] Ewbank, D.C. (1981). ``Age misreporting and age-selective underenumeration: sources, patterns, and consequences for demographic analysis”. Washington: NationalAcademy Press, Committee on Population and Demography. [7] Gonzalez J. F., Attanasio L. & Trang Ha J. (2014). ``An assessment of the age reporting in the IPUMS-I Microdata”. Paper submitted for presentation at the 2014 Annual Meeting of the Population Association of America. [8] Hobbs, F. B. (2004). Age and sex composition. In Siegel, J.S., & Swanson, D.A., (Eds). The methods and materials of demography (2nd Ed., pp 125 { 173). San Diego, California: Elsevier Academic Press. [9] Kpedekpo G.M.K. (1982). Essentials of Demographic Analysis for Africa. Hernerman Educational Books Inc., New Hemisphere. [10] Noumbissi, A. 1992. “Modofied whipples index : an application to the Cameroon, Sweden amd Belgium data” “ L'indice de Whipple modified : une application aux donnees du Cameroun, de la Su_ede et de la Belgique”. Population 47 (4) : 1038-1041. [11] Pardeshi, G.S. (2010). ``Age heaping and accuracy of age data collected during a community survey in the Yavatmal district, Maharashtra”. Indian Journal of Community Medicine, 35(3): 391-395. [12] Roger, G., Waltisperger D., Corbille-Guitton C. 1981. ``Structure by sex and age in africa”. African demography group, Paris. “Les structures par sexe et age en Afrique. Paris : Groupe de Demographie Africaine, IDP- INED-INSEE MINCOOPORSTOM. [13] United Nation Age-sex Accuracy test for census age distributions tabulated in five yearand ten year groups. Population Bulletin of United Nations. 2:59 - 79.