Corporate Reporting Analysis: Cable & Wireless / UK Fixed line
•
1 gostou•1,420 visualizações

Group project carrying out accounting and corporate reporting analysis on ailing fixed line operator Cable & Wireless Worldwide. November 2011

Recomendados
Mais conteúdo relacionado
Mais procurados
Mais procurados (20)
Destaque
Destaque (6)
Semelhante a Corporate Reporting Analysis: Cable & Wireless / UK Fixed line
Semelhante a Corporate Reporting Analysis: Cable & Wireless / UK Fixed line (20)
Mais de Chris Corbishley
Mais de Chris Corbishley (7)
Último
Último (20)
Corporate Reporting Analysis: Cable & Wireless / UK Fixed line
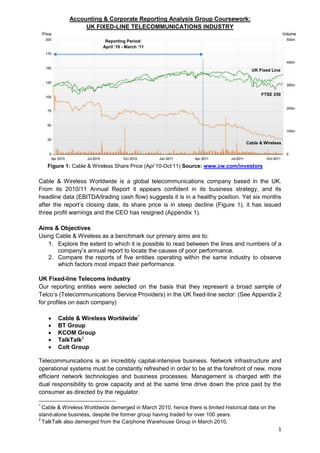
- 1. Accounting & Corporate Reporting Analysis Group Coursework: UK FIXED-LINE TELECOMMUNICATIONS INDUSTRY Reporting Period: April ’10 - March ‘11 UK Fixed Line FTSE 250 Cable & Wireless Figure 1: Cable & Wireless Share Price (Apr’10-Oct’11) Source: www.cw.com/investors Cable & Wireless Worldwide is a global telecommunications company based in the UK. From its 2010/11 Annual Report it appears confident in its business strategy, and its headline data (EBITDA/trading cash flow) suggests it is in a healthy position. Yet six months after the report’s closing date, its share price is in steep decline (Figure 1), it has issued three profit warnings and the CEO has resigned (Appendix 1). Aims & Objectives Using Cable & Wireless as a benchmark our primary aims are to: 1. Explore the extent to which it is possible to read between the lines and numbers of a company’s annual report to locate the causes of poor performance. 2. Compare the reports of five entities operating within the same industry to observe which factors most impact their performance. UK Fixed-line Telecoms Industry Our reporting entities were selected on the basis that they represent a broad sample of Telco’s (Telecommunications Service Providers) in the UK fixed-line sector: (See Appendix 2 for profiles on each company) Cable & Wireless Worldwide1 BT Group KCOM Group TalkTalk2 Colt Group Telecommunications is an incredibly capital-intensive business. Network infrastructure and operational systems must be constantly refreshed in order to be at the forefront of new, more efficient network technologies and business processes. Management is charged with the dual responsibility to grow capacity and at the same time drive down the price paid by the consumer as directed by the regulator. 1 Cable & Wireless Worldwide demerged in March 2010, hence there is limited historical data on the stand-alone business, despite the former group having traded for over 100 years. 2 TalkTalk also demerged from the Carphone Warehouse Group in March 2010. 1
- 2. The fundamental criterion for a Telco’s success is its ability to generate sufficient free cash flow from operations and raise additional external capital to reinvest back into the business. Hence why EBITDA and free cash flow so often feature as key metrics in the headline data of our annual reports. In this study we will explore the free cash flows of five entities, considering (1) their ability to generate cash from operations, (2) the extent of gearing and the returns from leveraging external capital, and (3) how they reinvest capital back into their business. In doing so, we hope to understand the contrasting business models and growth strategies in the UK fixedline sector and determine the areas where Cable & Wireless might be going wrong. Comparing Strategies From the narrative in our annual reports, we can observe the strategic aims of each entity as well as some broader market trends affecting the industry as a whole. Key points are summarised in the table below:34567 3 BT Group plc, Annual Report & Form 20-F 2011 (Chairman’s message) p.3 Cable&Wireless Worlwide, 2010/11 Annual Report (Our Strategy) p.2 5 Colt Group S.A., 2010 Annual Report (Vision, Mission, Strategy) p.1 6 KCOM Group PLC, Annual Report and Accounts 2010/11 (Our Vision) p.5 7 TalkTalk Telecom Group PLC, Annual Report (Chief Executive’s Review) p.6-9 4 2
- 3. From the above there is a consensus view on the need for continuous investment in network technology and efficiency or ‘business process’ improvements i.e. drive down costs and exploit new opportunities in better differentiated product-services in order to offset the declining revenues from regulated (voice network) services. 1) Top-Level Performance Analysis By contrasting and comparing various ratios we can begin to compare the overall performance of the five companies. Starting with earnings before interest, tax, depreciation and amortisation (EBITDA) as a percentage of revenue, we observe that each company has seen a slight improvement from the previous year. This graph tells us very little in isolation, except that BT is leading the industry in its ability to generate gross margin and that Cable & Wireless is in a similar position compared to its peer competitors. This is the start of the investigation process. We will now consider the distribution of earnings i.e. where the cash generated by the business is employed by working down the cash flow statements and hence, calculate the ‘free’ cash that remains. Each entity defines ‘free cash flow’ differently, thus in order to make a comparison it is not possible to use the stand-alone figure from the reports. The following charts represent our own definition which we call ‘discretionary cash flow’ i.e. EBITDA less interest and tax, dividends, working capital, CAPEX, pensions and exceptional items; to observe the extent to which the company is able to finance its various activities by cash generated internally. Distribution of EBITDA in 2011 (See Appendix 4 for notes and figures) 3
- 4. 4
- 5. A full breakdown of where cash is being spent allows us to visualise the companies’ cash flow and work out the percentage of what is left to be distributed at the management’s discretion: to keep money in the bank, reduce debt or reinvest back into the business. In C&WW’s case, it is negative hence they have increased their liabilities to pay dividends. This is not immediately obvious from the balance sheet as it shows a decrease in liabilities overall (following a heavy pension pay-out in 2010), but an increase in the amount of loans and obligations under finance leases in both current and long-term liabilities (Appendix 5). 2) Gearing and Return on Capital Employed It is not only the ability to generate cash internally that is important for financing growth, but also the Telco’s ability to raise new capital through its shareholders and the banking stakeholders. Management must balance dividend payments and internally-funded CAPEX spending, whereby paying competitive and sustainable dividends to shareholders encourages further investment in the company by maintaining a steady, growing share price. This then provides an environment to leverage this equity to raise capital from the banks and keep the company expanding, thus taking the pressure off the shareholders for new capital. Gearing shows the extent to which a firm’s capital structure relies on borrowed funds in comparison to shareholder’s funds.8 It is not necessarily a quality mark against the company but more an indication of the management’s investment strategy. KCOM, TalkTalk and most especially BT are highly geared, suggesting that a large proportion of their capital is derived from borrowed funds. This could be seen as negative in the sense that they have high debt and potentially high interest rates to pay. However, in the case of BT and KCOM, each with a proportionately large asset base and a guaranteed (regulated) market in their respective business operations (see history in Appendix 3), there is little risk to the banks of a default hence interest rates would be comparatively low. 8 rd Mclaney & Atrill – ‘Accounting: An Introduction’ (Pearson 3 Edition, 2005) p.230 Gearing = long-term liabilities / share capital + reserves + long term liabilities x100 5
- 6. If we now consider the return on the capital employed (ROCE),9 BT and KCOM show a more efficient use of capital, due to advantages within the core business model (discussed below). But in 2010 C&WW were less efficient than their peers. Following restructuring they have made a substantial improvement, but still they lag behind their competitors. * Cable&Wireless: no values for the previous financial year due to demerger in March 2010. ** BT has negative equity in 2009/10 due to ‘recognition of actuarial losses on retirement benefit obligations’. *** TalkTalk provides no values for previous year due to its demerger from the Carphone Warehouse Group. ROSF (above) illustrates the net benefits to the shareholders as a result of the decisions taken by management and their ability to gear the company effectively. As a brief aside, it is very clear from the ROSF comparison that BT and KCOM, both former incumbent Telcos provide the best return for shareholders, whilst newer entrants are struggling to maintain their position in the industry. Such concentration of investment capital in the former incumbents is reminiscent of the old monopoly situation in the 1980s, which must be a concern for OFCOM as it is their goal to maintain competition in the sector. A possible cause for operational inefficiencies within Cable&Wireless can be seen in note 17 of their annual report which sets out the costs of assets and the depreciation applied historically (Appendix 5). The largest asset is Plant & Equipment (£855m out of a total of £983m). The original purchase price of these assets was £5376m. The historical depreciation of £4525m would indicate that these assets are over 15 years old,10 suggesting C&WW is managing a rapidly aging asset base, hence its high and increasing operating costs and low gross margin in the ‘legacy’ voice network. 3) Capital Expenditure If we now consider the CAPEX breakdown (see below), management may need to revisit their decision to only invest 2% in network improvements if they are to reduce the sensitivity of the company to reductions in voice revenue. The charts below indicate that the bulk of Cable & Wireless’ CAPEX is either in new business activities (31%) or growing its ‘managed services’ (customer contracts: 57%) i.e. activities where it is essentially using its CAPEX to serve its customers’ own capital requirements. Profit margins for these activities look good at (61%) and (73%) respectively, but the EBITDA to CAPEX ratio is disproportionate, considering revenues from their core business i.e. its voice, indicating that C&WW is out of its depth in these new areas of activity thus failing to deliver shareholders’ expectations. 2010/11 Revenue GM % Revenue IP and Data 999 610 61% Applications and Hosting 263 191 73% Voice and Legacy 995 264 27% Total 2257 1065 47% 9 ROCE = net profit before interest and taxation / share capital + reserves + long-term liabilities x100 Calculated as the depreciation to date divided by the yearly write-off and depreciation rate, less new CAPEX: £4525m / (£266m + £266m - £232m), Cable & Wireless Annual Report 2010/11 p.80 10 6
- 7. 2009/10 Revenue GM % Revenue 978 605 62% 240 174 73% 1047 296 28% 2265 1075 47% The above figures for C&WW,11 and those produced from its competitors’ reports in Appendix 10 suggest revenues and gross margin from traditional voice services are decreasing. The 2011 Ofcom report (Appendix 8) also supports this. C&WW as a consequence of this trend states in their annual report that it is exiting its historical ‘core’ business and moving ‘towards the cloud’, thus no longer investing in lower costs structures as a means of enhancing its EBITDA. The strategy seems sensible, yet recent turmoil suggests the transition has been made prematurely and at the expense of essential investment in their core network which delivers these higher-value ‘cloud’ services. CAPEX Breakdown 201112 - Cable & Wireless invests just 10% in maintaining its network infrastructure, and 2% in cost-reduction (efficiency) measures. 31% goes to new capability assets in ‘cloud’ (Applications & Hosting) - BT spreads its activities across a variety of services. However it continues to invest heavily in its ‘platforms and networks’. Access (23%) representing the new UK high-speed broadband (fibre) network. - Colt’s core network activity is in providing ‘data services’ to businesses in which it invests 60% 11 12 Cable & Wireless Annual Report 2010/11 p.31 See Appendix 11 for corresponding data. - KCOM and TalkTalk comprise a single voice and broadband network in which they clearly invest heavily. 7
- 8. Despite limitations in the amount of comparable data provided in the annual reports, the above comparison still shows how out of step Cable & Wireless is with its peers, all of which are staying true to their core area of competence by investing in network infrastructure, hence the loss of confidence by shareholders and the subsequent collapse in share price. Conclusion Cable & Wireless is a well-established and asset-rich company, which when compared to its peers is clearly underperforming. Analysts have been slow in recognising structural problems in C&WW as it took three profit warnings to alert the market, yet there is a case to be made that these issues were present in its first report as a newly formed entity. This recent restructuring of two of our five entities (CW&W/TalkTalk) made a comprehensive analysis difficult due to a lack of historical data. However, we can conclude that close comparison reveals that the sector is generally in good health, with former incumbent telcos: BT and KCOM clearly dominating (an issue for the regulator and a topic for further study). Therefore, the problems of C&WW can be attributed to structural weaknesses in the management’s strategy, namely their plans to offset the decline in traditional voice revenues by investing in next generation services without sufficient investment in their core network. With hindsight, a better strategy may have been for C&WW to reinvest in its core business to reduce its overheads and improve margins on its voice network before migrating to new ‘cloud’ services. In carrying out the report we reached the following conclusions about effective corporate reporting analysis: 1. To get an accurate picture of a company’s state of health it is necessary to read the notes in the pages at the back of the annual report first. 2. A broad understanding of the industry is required to analyse and compare company reports operating in the sector. 3. Despite recognised accounting standards there are still inconsistencies in the way reports are presented and therefore the numbers behind the ratios need to be understood and sometimes redefined. 8
- 9. APPENDIX APPENDIX 1: Cable & Wireless in the press The Financial Times reporting on Cable & Wireless’ performance following the annual report. Source FT.com: (Interactive timeline) http://www.ft.com/cms/s/0/9fffeb4a-a188-11e0baa8-00144feabdc0.html#axzz1cuxUOaeM June 28th 2011 “Jim Marsh, Chief Executive of Cable & Wireless Worldwide, resigns after poor sales force it to issue its third profit warning in 15 months and halve its dividend for 2011-12. He is replaced by John Pluthero, chairman”. June 21st 2011 “Cable & Wireless Worldwide's annual report reveals that the company has decided to curb executive pay in 2011-12. It will scrap plans for a new scheme providing potentially large share awards to top managers, and will reduce stock issuance to them under another plan”. May 20th 2011 “Bosses at Cable & Wireless Worldwide are set to miss out on final payments from their controversial long-term incentive plan, the FT reports. The fifth and final year of the plan is not expected to provide any cash payments due to poor share price performance”. March 31st 2011 “After the news that Tim Weller, Cable & Wireless' Finance Director is to leave the company, The Times claims this follows the board's rejection of his advice to lower its profit guidance before a positive trading statement in February. This statement was followed by a profit warning two weeks later”. March 24th 2011 “Shares in Cable & Wireless Worldwide fall by more than 14 per cent after it issues its second profit warning in less than a year. Jim Marsh, chief executive, insists he will not resign”. July 20th 2010 “Cable & Wireless Worldwide warns of a "very significant slowdown" in UK public sector contracts, triggering a 17 per cent drop in its shares. It blames a drying up of one-off telecoms projects, such as extra bandwidth and site moves”. March 2010 Demerger of Cable & Wireless Worldwide from Cable & Wireless Plc 9
- 10. APPENDIX 2: Company Profiles ENTITY DESCRIPTION Cable & A global telecommunications company, based in the UK which specializes in Wireless providing communication networks and services to large corporations, Worldwide governments, carrier customers and resellers. Its services include managed Voice, Data and IP-based services and applications in UK and internationally. BT Group BT is one of the world’s leading communications services companies, operating in the UK and 170 countries worldwide. Its core activities are the provision of fixed telephony lines and calls (retail and wholesale), broadband, mobile and TV products/services to consumers and SMEs as well as managed networked IT services for multinational corporations, domestic businesses and government organisations. TalkTalk Group TalkTalk is the ‘value for money’ provider of fixed line broadband and voice telephony services to consumers and business users. Serving over 4.8 million customers in the UK they have grown their business to compete with BT. It is split into TalkTalk, AOL Broadband and TalkTalk Business. The company demerged from Carphone Warehouse Group in March 2010. KCOM Group KCOM could be described as a BT in miniature, providing almost identical services through its four ‘brands’ KC, Kcom, Eclipse and Smart 421, it has a virtual monopoly of the Hull and East Yorkshire region, also providing voice and broadband services to consumers and SMEs in other parts of the UK. It is comparatively small, therefore more agile and has been quick to invest in high-speed broadband and next generation services. COLT Group* COLT, ‘City of London Telecom’ (est. 1996) is based in the UK but operates mainly in Europe. It specialises in voice, data, and integrated IT-managed services for businesses of various sizes. It operates with pan-European assets, and aims to become the leading information delivery platform. * Colt’s annual report is for the calendar year 2010 and states its currency in Euros. **Virgin Media and Sky are both big players in the UK telecoms industry. They were not considered in this report on the basis that fixed- line is not the core of their business. APPENDIX 3: A Brief History of the Telecoms Industry13 BT was formed in 1982 when HMG privatised the former Post Office telecommunications activity. The Conservative administration recognised that there was a need for increased competition in the telecommunications sector and the cost to ‘digitise’ the UK network would be beyond the UK Treasury’s ability to finance. In parallel to the privatisation of BT, OFTEL (the precursor to OFCOM) was established and granted an operators license to Cable & Wireless who established Mercury Communications as a competitor to BT’s retail business. This arrangement became known as the “duopoly” and continued until 1994 when the Telecommunications Act caused HMG to open the UK market to more competition, where OFTEL set the rules for fairness. KCOM, (formerly Kingston Telecommunications) was under the ownership of the City of Hull. Being the only part of the UK Telecoms network not directly owned by the state and under the jurisdiction of the Post-Office prior to 1982, it was part-privatised and became KCOM plc. 13 Summary of articles found here: http://www.btplc.com/thegroup/btshistory/1984onwards/1984.htm 10
- 11. APPENDIX 4: Reference for EBITDA breakdown charts C&W EBITDA 100.0% Capex 54.1% Dividends paid 19.5% Working Capital 11.3% Interest and taxation 10.4% Exceptional items* 10.4% Pension 3.4% Cash Flow -9.0% *Exceptional items, Movement in exceptional provisions, LTIP Payment Source: Cable&Wireless Worldwide, ‘2010/11 Annual Report’ p.34 £m 442 239 86 50 46 46 15 -40 BT EBITDA 100% Capex 46.6% Dividends paid 9.8% Interest and taxation* 20.7% Cash-Flow 22.9% *Interest paid - Interest received + Income taxes paid Source: BT Group plc, ‘Annual Report & Form 20-F 2011’ p.50, p.103 £m 5,557 2,590 543 1,153 1,271 COLT EBITDA Capex 100.0% 70.2% 9.1% 5.7% 0.5% Exceptional items Working Capital Interest and taxation Cash Flow Source: Colt Group S.A., ‘2010 Annual Report’ p.19, p.61 TALK TALK EBITDA Capex 14.5% 100.0% 33.3% Exceptional items* 17.9% Interest and taxation 5.8% Dividends paid 4.5% Working Capital 3.0% Cash Flow 19.1% *Exceptional items-One company, demerger Source: TalkTalk Telecom Group PLC, ‘Annual Report’ p.17 €m 330.2 231.8 30.1 18.7 1.8 47.8 €m 276 110 59 19 15 10 63 NOTE: KCOM did not provide sufficient data in their annual report to show a useful breakdown of EBITDA. 11
- 12. APPENDIX 5: C&WW Balance Sheet and Note 25 Cable & Wireless Balance Sheet (Annual Report 2010/11) p.62 Cable & Wireless Notes to Financial Statements (Annual Report 2010/11) p.84 12
- 13. APPENDIX 6: Cable & Wireless Depreciation on assets (p.80 Annual Report) APPENDIX 7: Asset turnover i.e. Sales / Average Total Assets (Units: times) 13
- 14. APPENDIX 8: Extract from OFCOM report on decline of voice revenues14 14 Ofcom UK Communications Market Report 2011 p. 278 14
- 15. APPENDIX 9: % revenues by product/service set See Appendix 10 (below) for workings of the percentages in these pie charts. 15
- 16. APPENDIX 10: % change of revenues per product/service BT 2011 2010 DELTA Products and services £m £m ICT and managed networks 6,632 Broadband and convergence %PROD/REV £m % DELTA/REV 6,574 58 0.3% 33.0% 2,767 2,677 90 0.4% 13.8% Calls and lines 5,595 6,225 -630 -3.1% 27.9% Transit 1,518 1,758 -240 -1.2% 7.6% Conveyance, interconnect circuits, WLR, global carrier and other wholesale 1,471 1,451 20 0.1% 7.3% Other products and services 2,093 2,226 -133 -0.7% 10.4% Revenue 20,076 20,911 -835 -4.2% 100.0% %PROD/REV Source: BT Group plc, ‘Annual Report & Form 20-F 2011’ p.108 TALK TALK 2011 2010 DELTA Products and services £m £m £m % DELTA/REV Broadband 1,247 1,086 161 9.1% 70.7% Non-broadband 189 273 -84 -4.8% 10.7% Corporate 329 327 2 0.1% 18.6% Revenue 1,765 1,686 79 Source: TalkTalk Telecom Group PLC, ‘Annual Report’ p.56 4.5% 100.0% C&WW 2011 2010 DELTA %PROD/REV Products and services £m £m £m % DELTA/REV IP and data 999 978 21 0.9% 44.3% Hosting and applications 263 240 23 1.0% 11.7% Traditional voice and legacy 995 1,047 -52 -2.3% 44.1% Revenue 2,257 2,265 -8 -0.4% 100.0% %PROD/REV Source: Cable&Wireless Worlwide, ‘2010/11 Annual Report’ p.30 COLT 2010 2009 DELTA Products and services £m £m £m % DELTA/REV Carrier Voice 194.2 212.4 -18 -1.1% 12.3% Corporate and Reseller Voice 415.7 459.1 -43 -2.7% 26.3% Managed Services 172.6 156.1 17 1.0% 10.9% Data 801.1 794.9 6 0.4% 50.6% Revenue 1583.6 1622.5 Source: Colt Group S.A., ‘2010 Annual Report’ p.67 -39 -2.5% 100.0% KCOM 2011 2010 DELTA £'000 £'000 £m % DELTA/REV %PROD/REV Products and services KC & Eclipse 118,162 122,070 -3,908 -1.0% 29.9% Kcom & Smart421 276,472 289,858 -13,386 -3.4% 69.9% PLC 778 872 -94 0.0% 0.2% Revenue 395,412 412,800 -17,388 -4.4% Source: KCOM Group PLC, ‘Annual Report and Accounts 2010/11’ p.56 100.0% 16
- 17. APPENDIX 11: References and Figures for CAPEX Breakdown BT 2011 2010 Capital expenditure £m £m Platforms & networks 1,145.0 1,135 44.2% Customer related 599.0 560 23.1% Access 591.0 566 22.8% Regulatory & Compliance, Support functions 255.0 Source: BT Group plc, ‘Annual Report & Form 20-F 2011’ p.55 % 9.8% TALK TALK 2011 2010 Capital expenditure £m £m Acquisition of intangible assets 27 35 24.5% Acquisition of property, plant and equipment 83 67 75.5% Total capital expenditure 110 Source: TalkTalk Telecom Group PLC, ‘Annual Report’ p.48 % 102 COLT 2010 2009 Capital expenditure £m £m Data 140.7 135.8 60.7% Managed Services revenues 41.7 32.7 18.0% Other 49.4 47.8 21.3% Total capital expenditure 231.8 Source: Colt Group S.A., ‘2010 Annual Report’ p.21 C&WW Customer contracts % 216.3 2010/11(£285m) 2009/10 (£268m) 57% 52% New capability assets 31% Maintenance of own properties and network 10% assets Cost reduction assets 2% Source: Cable&Wireless Worlwide, ‘2010/11 Annual Report’ p.34 31% 10% 7% KCOM 2011 2010 % Purchase of property, plant and equipment 10,920 14,567 78.3% Purchase of intangible assets 3,028 3,011 21.7% Addition to investments 17 Total capital expenditure 13,948 17,595 Source: KCOM Group PLC, ‘Annual Report and Accounts 2010/11’ p.50 17
- 18. APPENDIX 12: Ratio Formulae and Workings CABLE & WIRELESS Ratios Values 2011 (,000) Values 2010 (,000) Results 2011 Results 2010 ROSF Net Profit After Tax / Equity 209 / 1,556 1 / 1,371 13.4% 0.07% ROCE PROFITABILITY RATIOS Formulae Operating Profit / Capital Employed 140 / (1,556 + 493) -59 / (1,371 + 550) 6.8% -3% Operating Margin Profit Operating Profit / Sales 153 / 2,257 -59 / 2265 6.7% -2.6% Gross Margin Profit Gross Sales 1,065 / 2,257 (2,265 - 1,190) / 2,265 47% 47% Profit / Gearing (Leverage) LT liabilities / (Equity + LT Liabilities) 493 / (1,556 + 493) 550 / 1,371 + 550 24% 28% Interest Cover Operating Profit / Interest Payable 153 / 30 -59 / 36 5.1 1.8 Acid Test Current Assets Inventories / Current Liabilities (596 + 266) / 1,008 (691 + 226) / 1,094 0.9 0.8 Current Ratio Current Assets / Current Liabilities 909 / 1,008 934 / 1094 0.9 0.9 Sales Revenue per Employee Sales Employees 6,361 / 2,257,000,000 6,575 / 2,265,000,000 354,818 (£) 344,487 (£) Sales Revenue to Capital Employed (Asset Turnover) SOLVENCY RATIOS Sales / Capital Employed 2,257 / (1,556 + 493) 2265 / (1,371 + 550) 1.1 1.2 Results 2010 Results 2009 5.2% 9.6% LIQUIDITY ANALYSIS INDUSTRY SPECIFIC (ASSET EFFICIENCY ANALYSIS) / COLT Ratios Values 2010 (,000) Values 2009 (,000) ROSF Net Profit After Tax / Equity 71.2 / 1,371.2 121.6 1,273.2 ROCE Operating Profit / Capital Employed 50.5 / 1,395.3 86.3 / 1,299.7 3.6% 6.6% Operating Profit Margin Operating Profit / Sales 50.5 / 1,583.8 86.3 / 1,622.5 3.2% 5.3% Gross Margin PROFITABILITY RATIOS Formulae Gross Sales 461.1 / 1,583.6 459.9 1,622.5 29.1% 28% Profit Profit / / / LIQUIDITY ANALYSIS Gearing (Leverage) LT liabilities / (Equity + LT Liabilities) 24.1 / (24.1 + 1371.2) 26.5 / (1,273.2 + 26.5) 1.5% 2% Interest Cover SOLVENCY RATIOS Operating Profit / Interest Payable 50.5 / 4.9 86.3 / 9.0 10.3 9.6 566.6 / 610.4 568.3 / 584.2 566.6 / 610.4 568.3 / 584.2 0.9 0.9 Acid Test Current Ratio INDUSTRY SPECIFIC Current Assets Inventories / Current Liabilities Current Assets / Current Liabilities 0.9 0.9 Sales Revenue per Employee Sales / Employees 1,583,600,000 / 4,825 1,622,500,000 / 4,777 328,207. 3 (£) 339,648.3 (£) Sales Revenue to Capital Employed (Asset Turnover) Sales / Capital Employed 1,583.6 / (2,005.7 - 610.4) 1,622.5 (1,883.9 584.2) 1.1 1.3 / – 18
- 19. BT GROUP Ratios Results 2011 Results 2010 Net Profit After Tax / Equity 1,504 / 1,951 1,029 / 2,626 77.09% -39.18% Operating Profit / Capital Employed 2,578 16,509 / 2,123 / ( -2626 + 20,886) 15.62% 11.63% Operating Profit Margin Operating Profit / Sales 2,578 20,076 / 2,123 / 20,859 12.84% 10.18% Gross Margin Gross Profit / Sales n/a n/a n/a n/a Gearing (Leverage) LT liabilities / (Equity + LT Liabilities) 14,558 16,509 20,886 / 18,260 88.2% 114.4% Interest Cover Operating Profit / Interest Payable 2,578/3,203 2,123 / 3,113 0.8 0.7 Acid Test LIQUIDITY ANALYSIS Values 2010 (,000) ROCE SOLVENCY RATIOS Values 2011 (,000) ROSF PROFITABILITY RATIOS Formulae Current Assets Inventories / Current Liabilities 3,810 / 7,031 6,285 - 107 / 10,420 0.5 0.6 3,931 / 7,031 6,285 / 10,420 0.6 0.6 Sales / Employees 20,076,000,0 00 / 94,600 20,859,000,000 / 101,700 212,219.9 (£) 205,103.2 (£) Sales / Employed 20,076 (1,951 14,558) 20,859 / (2,626 + 20,886) 1.2 0.9 Profit Current Ratio INDUSTRY SPECIFIC (ASSET EFFICIENCY ANALYSIS) Sales Revenue per Employee Sales Revenue to Capital Employed (Asset Turnover) Current Assets / Current Liabilities Capital / / + TALK TALK GROUP Ratios PROFITABILITY RATIOS Formulae Values 2011 (,000) Values 2010 (,000) Results 2011 Results 2010 ROSF Net Profit After Tax / Equity 35 / 415 -3M / 392M 8.4% -0.76% Operating Profit / Capital Employed 75 / 415 + 409 15 / (392 + 508) 9.1% 1.78% ROCE Operating Margin Operating Profit / Sales 75 / 1765 16 / 1686 4.3% 0.95% Gross Margin SOLVENCY RATIOS Profit Profit Gross Sales 888/1765 848 / 1686 50.31% 50.3% (508 + 392) 49.6% 56.4% Gearing (Leverage) Interest Cover LIQUIDITY ANALYSIS Acid Test Current Ratio INDUSTRY SPECIFIC (ASSET EFFICIENCY ANALYSIS) Profit / LT liabilities / (Equity + LT Liabilities) 409 415 Operating Profit / Interest Payable 75 /18 16 / 11 4.2 1.5 (161 – 3) / 474 186 - 2 / 490 0.33 0.375 161 / 474 186M/ 490 0.34 0.38 1765 / 4077 1686 / 4572 432,916.3 6 (£) 368,766.4 (£) 1765 / +409) 1686 / 392 + 508 Current Assets Inventories / Current Liabilities Current Assets / Current Liabilities Sales Revenue per Employee Sales / Employees Sales Revenue to Capital Employed (Asset Turnover) Sales / Capital Employed / 409+ (415 2.14 1.9 19
- 20. KCOM GROUP Ratios Values 2010 (,000) Results 2011 Results 2010 ROSF Net Profit After Tax / Equity 22,621 / 73,194 17,693 / 35,757 30.9% 49.5 % Operating Profit / Capital Employed 40,294 170,204 / 26,550 / 35757 + 191,035 23.7% 11.7% Operating Profit Margin Operating Profit / Sales 26,550 / 412,800 10.2% 6.4% Gross Profit / Sales 40,294 395,412 n/a / Gross Margin SOLVENCY RATIOS Values 2011 (,000) ROCE PROFITABILITY RATIOS Formulae n/a n/a n/a 97,010 170,204 / 191,035 / 35,757 57.0% 84.2% 40294/7393 26,550 / 7,368 5.4% 3.6% 0.5% 0.6% 7,328 / 151,546 (94,425 – 3,608) / 144,678 0.5% 0.7% 219,500 (£) 197,100 (£) 2.3 1.8 Profit LT liabilities / (Equity + LT Liabilities) Interest Cover LIQUIDITY ANALYSIS Gearing (Leverage) Operating Profit / Interest Payable Acid Test Current Ratio INDUSTRY SPECIFIC (ASSET EFFICIENCY ANALYSIS) Current Assets - Inventories / Current Liabilities Current Assets / Current Liabilities 794,78 151,546 Sales Revenue per Employee Sales Employees 395,412 / 1,801 412,800 / 2,094 Sales Revenue to Capital Employed (Asset Turnover) Sales / Capital Employed 395,412 (73,194 97,010) 412,800 (35,757 191,035) / / 94,425 / 144,678 / + / + 20
- 21. Bibliography & Links rd Mclaney & Atrill – ‘Accounting: An Introduction’ (Pearson 3 Edition, 2005) Ofcom UK Communications Market Report 2011 http://stakeholders.ofcom.org.uk/binaries/research/cmr/cmr11/UK_Doc_Section_5.pdf FT.com http://www.ft.com/companies/telecoms ANNUAL REPORTS BT Group plc, Annual Report & Form 20-F 2011 http://www.btplc.com/Sharesandperformance/Annualreportandreview/pdf/BTGroupAnnualReport2011 .pdf Cable&Wireless Worlwide, 2010/11 Annual Report http://www.cw.com/assets/content/investors/reports/2011/ar-2011-full.pdf Colt Group S.A., 2010 Annual Report http://colt.online-ar2010.com/images/stories/PDFs/Colt_2010_AnnualReport.pdf KCOM Group PLC, Annual Report and Accounts 2010/11 http://www.kcomplc.com/docs/news-pdf/annual-reports/annual-report-2010-2011.pdf TalkTalk Telecom Group PLC, Annual Report http://m2.ttxm.co.uk/sites/www.talktalkgroup.com/pdf/corporate/TalkTalk_AR11_Web-Ready.pdf 21