SlideShare uma empresa Scribd logo
1 de 6
Baixar para ler offline
A.L. Wagner Appraisal Group
                                                                                 Presents
                                               THE CHICAGOLAND QUARTERLY HOUSING REPORT
                                          The Analysis of Absorption Rates and Percentage of Change in Inventory Level
                                                               Single Family Detached Residences
                                                                  July 1, 2010 to June 30, 2011


Sponsored by:
Alvin "Chip" Wagner III, SRA, SCRP
A. L. Wagner Appraisal Group, Inc.                                                           Specializing in Relocation, Litigation & Lending Appraisals
1807 Washington Street, Suite 110, Naperville, IL 60565                                      Serving the Chicagoland Area since 1970
(630) 416-6556 ~ www.wagnerappraisal.com ~ chip@rac.net                                      Offices in Naperville, Plainfield, Chicago, Flossmoor


                                                                 July 1, 2011 Statistics                                              July 1, 2010 Statistics
                                                                Under    Under # of Sales                                                                           12 mo SP
                             MLS                 Average       Contract Contract  Last       Average    MONTHS             MONTHS       Percent         Average       Percent
Town                         Area   Actives      List Price     (Ctg.)   (Pend) 12 mos.     Sale Price  SUPPLY             SUPPLY       Change         Sale Price     Change
Addison                       101        201   $     283,286         35      11      167 $      186,718  11.32              8.60         31.63%      $    208,814    -10.58%
Algonquin                     102        256   $     283,203         46        7     195 $      230,214  12.39              12.30         0.72%      $    254,512      -9.55%
Alsip                         658         84   $     181,532         14        5       87 $     128,395  9.51               10.39        -8.44%      $    150,869    -14.90%
Antioch                         2        276   $     298,554         37        5     201 $      183,757  13.63              11.83        15.18%      $    196,398      -6.44%
Arlington Heights               5        362   $     415,111         76      12      404 $      349,803  8.83               9.63         -8.28%      $    359,249      -2.63%
Aurora - DuPage County        507        162   $     327,895         56      13      245 $      268,792  6.19               6.34         -2.40%      $    270,958      -0.80%
Aurora - Kane County          507        616   $     137,056        230      92      943 $       99,580  5.84               7.13        -18.08%      $    117,699    -15.39%
Aurora - Will, Kendall Cty    507         85   $     255,888         34        1     110 $      219,112  7.03               7.23         -2.68%      $    232,996      -5.96%
Barrington Area                10        585   $ 1,056,695           70      15      379 $      552,881  15.13              16.74        -9.63%      $    567,486      -2.57%
Bartlett                      104        238   $     308,557         45        8     227 $      262,286  10.20              11.92       -14.40%      $    275,851      -4.92%
Batavia                       510        189   $     347,955         48      10      197 $      284,199  8.89               9.67         -7.99%      $    298,312      -4.73%
Beecher                       401         64   $     264,242           8       1       27 $     185,723  21.33              25.03       -14.76%      $    187,381      -0.88%
Bellwood                     2104        130   $     107,349         37      18      166 $       76,408  7.06               4.81         46.76%      $     86,642    -11.81%
Bensenville                   106        110   $     243,276         27      17      105 $      164,261  8.86               7.86         12.65%      $    166,504      -1.35%
Berwyn                        402        252   $     160,707         79      44      297 $      130,846  7.20               4.92         46.38%      $    140,308      -6.74%
Bloomingdale                  108        116   $     440,944         17        4       82 $     311,937  13.51              11.77        14.79%      $    330,652      -5.66%

       Data Source: MRED LLC                               (C) Copyright 2011, A. L. Wagner Appraisal Group, Inc.
       Midwest Real Estate Data, LLC                          (630) 416-6556 ~ www.WagnerAppraisal.com                                                        Page 1
July 1, 2011 Statistics                                     July 1, 2010 Statistics
                                                               Under    Under # of Sales                                                              12 mo SP
                            MLS                 Average       Contract Contract  Last       Average    MONTHS      MONTHS    Percent      Average       Percent
Town                        Area   Actives      List Price     (Ctg.)   (Pend) 12 mos.     Sale Price  SUPPLY      SUPPLY    Change      Sale Price     Change
Blue Island                  406         82   $     101,120         14      14        85 $      67,470  8.71        10.51    -17.17%   $     90,532    -25.47%
Bolingbrook                  440        408   $     219,654        130      33      446 $      183,890  8.04        7.20      11.71%   $    191,757      -4.10%
Bridgeview                   455         68   $     209,459         12        8       52 $     155,529  11.33       7.14      58.75%   $    177,632    -12.44%
Broadview                    155         50   $     136,712           4       9       49 $      96,360  9.68        7.01      38.03%   $    105,949      -9.05%
Brookfield                   513        109   $     243,260         20        5     117 $      185,217  9.21        6.19      48.77%   $    216,367    -14.40%
Buffalo Grove                 89        162   $     379,043         56        6     211 $      321,887  7.12        6.66       6.95%   $    365,115    -11.84%
Burbank                      454        178   $     200,375         43      18      190 $      156,736  8.51        7.60      11.91%   $    185,362    -15.44%
Burnham                      633         24   $      94,194           2       5       23 $      36,518  9.60        4.54     111.43%   $     47,089    -22.45%
Burr Ridge                   522        172   $ 1,297,339           19        6     107 $      780,839  15.64       21.05    -25.73%   $    795,101      -1.79%
Calumet City                 409        271   $      84,994         34      42      246 $       54,017  10.10       7.01      44.03%   $     63,121    -14.42%
Calumet Park                 643         36   $      91,023           6     14        42 $      46,853  6.97        5.78      20.60%   $     51,901      -9.73%
Carol Stream                 188        154   $     240,099         30        6     133 $      212,716  10.93       10.26      6.60%   $    230,630      -7.77%
Carpentersville              110        221   $     163,870         82      34      318 $      111,709  6.11        8.29     -26.26%   $    118,628      -5.83%
Cary                          13        249   $     272,188         40      12      124 $      232,835  16.98       11.74     44.62%   $    232,460       0.16%
Channahon                    410         93   $     231,190         22        8       90 $     203,087  9.30        11.19    -16.86%   $    203,293      -0.10%
Chicago Heights              411        190   $      97,441         14      18      177 $       61,761  10.91       7.26      50.20%   $     61,488       0.44%
Chicago Ridge                415         31   $     186,454           8       3       37 $     137,280  7.75        12.00    -35.42%   $    174,288    -21.23%
Cicero                       650        221   $     107,039         65      44      314 $       85,127  6.27        4.62      35.73%   $     93,474      -8.93%
Clarendon Hills              514         80   $     710,416         16        3       71 $     677,337  10.67       7.57      40.84%   $    538,421     25.80%
Country Club Hills           478        132   $     120,648         31      19      182 $       96,347  6.83        5.42      26.08%   $     94,870       1.56%
Countryside                  527         27   $     399,693           3       0       25 $     259,220  11.57       10.13     14.29%   $    255,397       1.50%
Crestwood                    446         41   $     208,475           6       2       25 $     169,332  14.91       14.33      4.02%   $    186,256      -9.09%
Crete                        417        171   $     228,922         21      14      110 $      146,921  14.15       10.71     32.08%   $    156,048      -5.85%
Crystal Lake (& Lakewood)     14        463   $     323,533        123      17      431 $      242,508  9.73        10.50     -7.29%   $    242,266       0.10%
Darien                       562         95   $     389,394         21        2     101 $      299,713  9.19        10.10     -8.97%   $    314,150      -4.60%
Deerfield                     15        132   $     645,031         32      10      157 $      476,053  7.96        10.40    -23.46%   $    515,252      -7.61%
Des Plaines                   16        303   $     317,501         68      20      332 $      230,138  8.66        9.46      -8.44%   $    235,470      -2.26%
Dolton                       419        200   $      78,152         33      37      199 $       46,017  8.92        5.19      71.82%   $     49,447      -6.94%
Downers Grove                515        353   $     457,347         73      14      327 $      366,768  10.23       10.88     -5.98%   $    361,729       1.39%
Elgin                        123        821   $     222,729        217      74      778 $      153,894  9.22        8.93       3.20%   $    169,705      -9.32%
Elk Grove Village              7        146   $     291,033         25        8     124 $      242,832  11.16       10.12     10.28%   $    258,006      -5.88%
Elmhurst                     126        307   $     502,175         93        5     339 $      407,132  8.43        8.69      -3.03%   $    423,983      -3.97%
Elmwood Park                 635        122   $     252,928         42      16      136 $      181,785  7.55        8.15      -7.42%   $    201,455      -9.76%
Evanston                     201        244   $     659,213         62      23      344 $      480,173  6.83        6.64       2.82%   $    466,302       2.97%
Evergreen Park               642        154   $     175,869         33      11      139 $      132,333  10.10       8.60      17.46%   $    165,581    -20.08%
Flossmoor                    422        135   $     326,720         16        8     102 $      237,725  12.86       10.79     19.14%   $    221,654       7.25%


       Data Source: MRED LLC                              (C) Copyright 2011, A. L. Wagner Appraisal Group, Inc.
       Midwest Real Estate Data, LLC                         (630) 416-6556 ~ www.WagnerAppraisal.com                                           Page 2
July 1, 2011 Statistics                                     July 1, 2010 Statistics
                                                              Under    Under # of Sales                                                              12 mo SP
                           MLS                 Average       Contract Contract  Last       Average    MONTHS      MONTHS    Percent      Average       Percent
Town                       Area   Actives      List Price     (Ctg.)   (Pend) 12 mos.     Sale Price  SUPPLY      SUPPLY    Change      Sale Price     Change
Forest Park                 130         63   $     217,099         10        4       35 $     206,750  15.43       10.00     54.29%   $    234,577    -11.86%
Fox Lake                     20         79   $     286,881         12        4       56 $     170,424  13.17       16.12    -18.32%   $    153,802     10.81%
Fox River Grove              21         49   $     254,250         13        2       50 $     207,960  9.05        17.70    -48.89%   $    228,144      -8.85%
Frankfort                   423        262   $     440,496         33        5     171 $      334,100  15.04       11.70     28.62%   $    336,407      -0.69%
Franklin Park               131        129   $     168,986         39      14      140 $      138,005  8.02        6.00      33.68%   $    144,873      -4.74%
Geneva                      134        253   $     400,719         55        3     250 $      338,457  9.86        7.76      26.98%   $    344,307      -1.70%
Glen Ellyn                  137        249   $     520,462         61      11      325 $      422,343  7.53        9.62     -21.75%   $    425,122      -0.65%
Glencoe                      22        108   $ 1,632,669           17        8     126 $ 1,080,568     8.58        12.38    -30.64%   $ 1,058,964        2.04%
Glendale Heights            139        128   $     182,889         47      15      159 $      139,631  6.95        5.42      28.35%   $    157,658    -11.43%
Glenview                     25        345   $     707,632         74      24      359 $      583,962  9.06        9.74      -7.03%   $    593,103      -1.54%
Glenwood                    425         64   $     128,924           8       8       51 $     102,086  11.46       4.11     179.22%   $    106,005      -3.70%
Gurnee                       31        240   $     298,150         49        7     202 $      253,732  11.16       10.36      7.77%   $    274,292      -7.50%
Hanover Park                103        125   $     176,539         38      21      155 $      133,128  7.01        6.86       2.11%   $    161,990    -17.82%
Harvey                      426        128   $      56,148         12      25      150 $       21,714  8.21        6.73      22.08%   $     22,648      -4.12%
Harwood Heights             656         43   $     304,898           9       4       59 $     236,692  7.17        13.15    -45.52%   $    259,632      -8.84%
Hazel Crest                 429         84   $     105,739         22      12      132 $       59,200  6.07        6.64      -8.61%   $     74,712    -20.76%
Hickory Hills               457         81   $     249,669         15        1       52 $     177,582  14.29       10.00     42.94%   $    216,061    -17.81%
Highland Park                35        300   $ 1,023,780           61      19      248 $      564,499  10.98       10.64      3.19%   $    612,314      -7.81%
Hillside                    162         56   $     127,930         13        7       64 $     118,089  8.00        7.89       1.39%   $    135,448    -12.82%
Hinkley                     520         20   $     200,435           2       0       14 $     140,236  15.00       18.40    -18.48%   $    158,979    -11.79%
Hinsdale                    521        274   $ 1,294,447           28        5     244 $ 1,012,623     11.87       9.41      26.16%   $    936,239       8.16%
Hoffman Estates             194        199   $     305,705         59        8     223 $      261,133  8.23        7.60       8.40%   $    285,557      -8.55%
Homer Glen                  500        220   $     447,598         34        4     115 $      329,154  17.25       15.55     10.94%   $    346,979      -5.14%
Homewood                    430        128   $     159,492         30        9     146 $      135,482  8.30        6.10      36.09%   $    148,224      -8.60%
Indian Head Park            531         13   $     468,069           3       0       11 $     510,736  11.14       15.27    -27.04%   $    503,367       1.46%
Inverness                  7167        118   $     789,171           8       4       57 $     646,095  20.52       17.84     15.05%   $    630,566       2.46%
Itasca                      143         56   $     437,630           4       3       36 $     292,713  15.63       10.84     44.19%   $    328,875    -11.00%
Joliet                      499        733   $     146,346        144      69      738 $      113,478  9.25        7.80      18.61%   $    125,619      -9.67%
Justice                     458         37   $     189,594           5       5       33 $     160,426  10.33       9.55       8.11%   $    148,876       7.76%
Kenilworth                   43         38   $ 1,907,945             7       4       35 $ 1,675,536    9.91        14.10    -29.69%   $ 1,380,334      21.39%
LaGrange Park               526         70   $     337,714         17        3       86 $     321,220  7.92        7.25       9.38%   $    346,835      -7.39%
LaGrange                    525         99   $     551,611         27        1     123 $      467,598  7.87        7.53       4.55%   $    428,933       9.01%
Lake Bluff                   44        110   $     933,701           6       4       91 $     635,032  13.07       12.58      3.87%   $    606,256       4.75%
Lake Forest                  45        326   $ 1,787,244           33      19      193 $ 1,124,137     15.97       16.90     -5.50%   $ 1,014,022      10.86%
Lake In The Hills           156        189   $     253,050         45        6     216 $      188,996  8.49        7.18      18.25%   $    215,671    -12.37%
Lake Villa & Lindenhurst     46        271   $     287,725         58      17      256 $      218,785  9.82        9.85      -0.28%   $    229,577      -4.70%


       Data Source: MRED LLC                             (C) Copyright 2011, A. L. Wagner Appraisal Group, Inc.
       Midwest Real Estate Data, LLC                        (630) 416-6556 ~ www.WagnerAppraisal.com                                           Page 3
July 1, 2011 Statistics                                     July 1, 2010 Statistics
                                                               Under    Under # of Sales                                                              12 mo SP
                            MLS                 Average       Contract Contract  Last       Average    MONTHS      MONTHS    Percent      Average       Percent
Town                        Area   Actives      List Price     (Ctg.)   (Pend) 12 mos.     Sale Price  SUPPLY      SUPPLY    Change      Sale Price     Change
Lansing                      438        282   $     123,927         20      31       196 $      88,644  13.70       11.59     18.23%   $    102,731    -13.71%
Lemont                       439        199   $     449,740         15        6      111 $     403,279  18.09       14.22     27.25%   $    358,506     12.49%
Libertyville & Green Oaks     48        305   $     647,436         58        8      212 $     468,931  13.17       12.08      8.94%   $    461,860       1.53%
Lincolnshire                  69         81   $     665,021         14        6       80 $     530,048  9.72        12.00    -19.00%   $    589,062    -10.02%
Lincolnwood                  645        107   $     555,045         28      11       114 $     390,886  8.39        9.31      -9.90%   $    386,036       1.26%
Lisle                        532        139   $     378,110         24        2       98 $     339,163  13.45       13.48     -0.19%   $    340,694      -0.45%
Lockport                     495        262   $     250,320         41        8      190 $     196,653  13.15       9.52      38.18%   $    198,788      -1.07%
Lombard                      148        258   $     282,541         70        7      259 $     235,128  9.21        10.14     -9.11%   $    246,711      -4.69%
Lynwood                     5411         66   $     197,767         10      13        43 $     140,038  12.00       10.57     13.51%   $    169,491    -17.38%
Lyons                        534         49   $     158,188           5       3       53 $     119,320  9.64        6.31      52.78%   $    127,695      -6.56%
Markham                     4426        104   $      81,826         14      23       123 $      44,598  7.80        6.30      23.81%   $     48,815      -8.64%
Matteson                     443        151   $     193,671         30      23       156 $     142,407  8.67        5.84      48.39%   $    158,112      -9.93%
Maywood                      153        134   $     101,100         23      36       169 $      63,269  7.05        6.80       3.74%   $     67,767      -6.64%
Medinah                      157         23   $     392,634           2       0       22 $     340,500  11.50       10.67      7.81%   $    278,831     22.12%
Melrose Park                 160         86   $     186,374         19        8       99 $     133,865  8.19        6.64      23.38%   $    127,801       4.74%
McHenry                       50        571   $     255,322        115      25       385 $     177,116  13.05       13.83     -5.60%   $    180,253      -1.74%
Minooka                      447         94   $     309,737         24      10        85 $     178,719  9.48        13.08    -27.54%   $    185,050      -3.42%
Midlothian                   445         96   $     142,319           9     13        73 $     105,334  12.13       7.44      62.95%   $    137,440    -23.36%
Mokena                       448        153   $     421,397         20        7      107 $     307,365  13.70       12.84      6.72%   $    318,303      -3.44%
Monee                        449         86   $     356,468         12        7       63 $     203,591  12.59       9.88      27.45%   $    214,969      -5.29%
Montgomery                   538        199   $     178,805         64      15       209 $     147,750  8.29        5.76      43.95%   $    161,997      -8.79%
Morton Grove                  53        133   $     352,035         42        9      164 $     267,999  7.42        7.05       5.26%   $    279,004      -3.94%
Mt. Prospect                  56        239   $     336,922         35        9      268 $     276,889  9.19        7.17      28.23%   $    295,549      -6.31%
Mundelein                     60        299   $     301,207         61      15       232 $     221,480  11.65       11.22      3.78%   $    248,098    -10.73%
Naperville                   540        927   $     560,652        200      24     1,102 $     436,313  8.39        7.87       6.58%   $    434,456       0.43%
New Lenox                    451        222   $     319,717         30        4      161 $     245,700  13.66       11.10     23.08%   $    261,417      -6.01%
Niles                        648        129   $     344,656         20        8      143 $     257,121  9.05        7.80      16.06%   $    282,739      -9.06%
Norridge                     634         95   $     323,852         23        4       90 $     252,620  9.74        6.59      47.89%   $    285,421    -11.49%
North Aurora                 542        125   $     269,279         24        5      119 $     232,180  10.14       8.15      24.29%   $    242,673      -4.32%
North Chicago                 64         81   $      79,231         13      12        63 $      43,108  11.05       9.10      21.33%   $     51,646    -16.53%
North Riverside              547         51   $     218,337         10        0       36 $     189,708  13.30       8.71      52.82%   $    219,151    -13.44%
Northbrook                    62        236   $     720,175         72      20       285 $     500,596  7.51        9.30     -19.19%   $    525,209      -4.69%
Northfield                  7193         64   $     861,305           6       3       48 $     843,886  13.47       15.21    -11.44%   $    726,343     16.18%
Northlake                    164         67   $     160,065         16        9       87 $     110,749  7.18        4.78      50.06%   $    129,431    -14.43%
Oak Brook                    523        127   $ 1,543,205             2       2       63 $     884,636  22.75       20.74      9.66%   $ 1,069,920     -17.32%
Oak Forest                   452        153   $     204,917         22      14       128 $     169,153  11.20       6.26      78.75%   $    177,843      -4.89%


       Data Source: MRED LLC                              (C) Copyright 2011, A. L. Wagner Appraisal Group, Inc.
       Midwest Real Estate Data, LLC                         (630) 416-6556 ~ www.WagnerAppraisal.com                                           Page 4
July 1, 2011 Statistics                                     July 1, 2010 Statistics
                                                              Under    Under # of Sales                                                              12 mo SP
                           MLS                 Average       Contract Contract  Last       Average    MONTHS      MONTHS    Percent      Average       Percent
Town                       Area   Actives      List Price     (Ctg.)   (Pend) 12 mos.     Sale Price  SUPPLY      SUPPLY    Change      Sale Price     Change
Oak Lawn                    453        262   $     221,413         54      26      263 $      180,943  9.17        7.32      25.30%   $    203,356    -11.02%
Oak Park                    302        170   $     493,847         51      19      295 $      396,268  5.59        6.14      -8.95%   $    409,432      -3.22%
Olympia Fields              461         53   $     223,760           8       5       47 $     196,172  10.60       9.71       9.21%   $    203,693      -3.69%
Orland Park                 462        308   $     498,282         61      14      241 $      343,865  11.70       9.91      18.07%   $    344,456      -0.17%
Oswego                      543        257   $     277,970         95      10      266 $      251,679  8.31        7.99       4.04%   $    253,608      -0.76%
Palatine                     67        302   $     407,282         54        2     257 $      331,070  11.58       9.77      18.47%   $    364,564      -9.19%
Palos Heights               463         84   $     449,382           9       5       78 $     281,470  10.96       11.72     -6.55%   $    280,520       0.34%
Palos Hills                 465         61   $     312,968         10        4       51 $     204,294  11.26       7.52      49.75%   $    233,094    -12.36%
Palos Park                  464         75   $     849,579           3       1       39 $     365,379  20.93       15.87     31.88%   $    367,280      -0.52%
Park Forest                 466        209   $      74,982         28      26      169 $       50,426  11.25       6.63      69.59%   $     59,032    -14.58%
Park Ridge                   68        241   $     531,079         62      14      256 $      420,743  8.71        8.94      -2.55%   $    430,452      -2.26%
Peotone                     468         45   $     285,625           5       2       25 $     187,072  16.88       12.00     40.63%   $    172,576       8.40%
Plainfield                  544        662   $     292,039        180      46      835 $      225,792  7.49        7.62      -1.74%   $    231,601      -2.51%
Posen                       469         34   $     103,196           4       4       47 $      70,917  7.42        6.86       8.18%   $     91,665    -22.63%
Prospect Heights             70         71   $     463,644           8       4       46 $     284,875  14.69       10.82     35.77%   $    352,904    -19.28%
Richton Park                471         79   $     138,697         17        9     100 $      103,691  7.52        5.57      35.04%   $    110,171      -5.88%
River Forest                305         82   $     838,628         15        1       79 $     629,825  10.36       11.76    -11.90%   $    675,574      -6.77%
River Grove                 171         52   $     192,092         14        3       57 $     160,782  8.43        6.45      30.70%   $    178,008      -9.68%
Riverdale                   627         87   $      66,584         10      17        72 $      29,569  10.55       6.79      55.32%   $     33,673    -12.19%
Riverside                   546        102   $     479,494         10        2       51 $     379,532  19.43       11.37     70.90%   $    422,029    -10.07%
Rolling Meadows               8         94   $     273,013         16        4       82 $     229,651  11.06       6.33      74.61%   $    243,675      -5.76%
Romeoville                  494        205   $     163,128         83      25      229 $      141,563  7.30        4.37      66.93%   $    149,790      -5.49%
Roselle & Keeneyville       172        102   $     340,571         30        7     125 $      252,682  7.56        10.04    -24.73%   $    272,017      -7.11%
Round Lake                   73        403   $     139,822        130      33      466 $      110,128  7.69        6.09      26.33%   $    122,350      -9.99%
Sauk Village                414         67   $      82,078         12      17      120 $       39,669  5.40        5.07       6.46%   $     40,864      -2.92%
Schaumburg                  193        228   $     350,840         52      11      217 $      280,480  9.77        9.07       7.73%   $    314,248    -10.75%
Shorewood                   496        117   $     270,137         21      11      123 $      231,730  9.06        9.53      -4.92%   $    253,985      -8.76%
Skokie                       76        239   $     344,878         69      17      303 $      256,114  7.37        6.01      22.60%   $    296,616    -13.65%
South Elgin                 177        115   $     283,542         33        9     145 $      227,700  7.38        8.60     -14.20%   $    235,549      -3.33%
South Holland               473        197   $     130,409         31      25      219 $      103,077  8.60        6.14      40.11%   $     99,831       3.25%
St. Charles                 174        535   $     580,122        102      13      469 $      370,929  10.99       11.66     -5.70%   $    379,439      -2.24%
Steger                      475         78   $     144,654         13        6       53 $      74,307  13.00       8.63      50.65%   $     91,933    -19.17%
Stickney                    404         67   $     168,162         10      12        61 $     129,146  9.69        5.74      68.78%   $    157,452    -17.98%
Streamwood                  107        210   $     214,144         73      22      270 $      156,152  6.90        7.24      -4.66%   $    175,664    -11.11%
Sugar Grove                 554         82   $     343,334         17        1       84 $     255,742  9.65        11.57    -16.60%   $    298,083    -14.20%
Summit                      501         54   $     133,813           8       7       31 $      86,181  14.09       9.76      44.29%   $    107,122    -19.55%


       Data Source: MRED LLC                             (C) Copyright 2011, A. L. Wagner Appraisal Group, Inc.
       Midwest Real Estate Data, LLC                        (630) 416-6556 ~ www.WagnerAppraisal.com                                           Page 5
July 1, 2011 Statistics                                                July 1, 2010 Statistics
                                                                        Under    Under # of Sales                                                                            12 mo SP
                                     MLS                 Average       Contract Contract  Last       Average    MONTHS             MONTHS         Percent      Average         Percent
Town                                 Area   Actives      List Price     (Ctg.)   (Pend) 12 mos.     Sale Price  SUPPLY             SUPPLY         Change      Sale Price       Change
Thornton                              476         13   $      92,537           1       1       14 $      70,230  9.75               8.87            9.93%   $     85,198      -17.57%
Tinley Park                           477        235   $     283,453         30      14      196 $      242,358  11.75              8.27           42.03%   $    256,238        -5.42%
University Park                      5466         42   $     105,236           5       7       39 $      83,412  9.88               5.48           80.29%   $     75,835         9.99%
Vernon Hills                           61        110   $     454,230         26        7     105 $      399,696  9.57               10.49          -8.81%   $    442,209        -9.61%
Villa Park                            186        138   $     206,313         30        6     151 $      184,401  8.86               7.30           21.39%   $    214,732      -14.13%
Warrenville                           555         67   $     348,241         15        4       63 $     232,694  9.80               8.70           12.66%   $    240,633        -3.30%
Waukegan & Park City                   85        369   $     107,047         81      50      379 $       75,029  8.68               6.25           39.03%   $     84,145      -10.83%
Wayne                                 184         50   $     852,031           3       1       14 $     589,714  33.33              20.44          63.04%   $    533,120       10.62%
West Chicago                          185        223   $     288,599         55      19      212 $      171,921  9.36               10.73         -12.78%   $    205,179      -16.21%
Westchester                           154        147   $     228,722         29      13      123 $      175,319  10.69              8.52           25.41%   $    212,287      -17.41%
Western Springs                       558         92   $     707,336         18        3     105 $      526,629  8.76               9.47           -7.47%   $    549,578        -4.18%
Westmont                              559        120   $     357,120         21        9       94 $     281,542  11.61              8.59           35.15%   $    319,767      -11.95%
Wheaton                               187        364   $     488,883         83      10      375 $      365,043  9.33               9.89           -5.66%   $    366,725        -0.46%
Wheeling                               90        123   $     220,327         44        4     107 $      189,933  9.52               6.94           37.28%   $    205,764        -7.69%
Willow Springs                        480         47   $     345,745           7       1       21 $     247,567  19.45              28.00         -30.54%   $    417,417      -40.69%
Willowbrook                           516         67   $     629,724           8       1       33 $     424,420  19.14              11.38          68.23%   $    402,267         5.51%
Wilmette                               91        166   $     910,845         34      30      245 $      771,101  6.45               6.46           -0.23%   $    789,807        -2.37%
Winfield                              190         99   $     370,570         16        4       61 $     316,669  14.67              15.18          -3.36%   $    349,415        -9.37%
Winnetka                               93        182   $ 1,835,549           27      25      200 $ 1,362,806     8.67               10.23         -15.26%   $ 1,309,557          4.07%
Wood Dale                             191        101   $     289,620         20        5       77 $     208,506  11.88              12.36          -3.89%   $    234,142      -10.95%
Woodridge                             517        136   $     317,422         18        5     141 $      263,601  9.95               8.71           14.25%   $    274,357        -3.92%
Woodstock & Greenwood                  98        306   $     328,401         37      11      179 $      185,236  16.18              13.77          17.44%   $    209,786      -11.70%
Worth                                 482         59   $     184,723         11        4       61 $     145,293  9.32               7.38           26.15%   $    158,305        -8.22%
Yorkville                             560        182   $     310,614         42      10      231 $      221,276  7.72               10.17         -24.15%   $    231,349        -4.35%
Zion                                   99        187   $     128,121         44      27      199 $       87,191  8.31               8.61           -3.46%   $     93,763        -7.01%

City of CHICAGO                      8000     5,782 $       342,123       1,278     848       7,382 $      223,877      7.30          6.62        10.15% $        225,772          -0.84%
TOTALS (all areas in report):        8099    37,887 $       381,031       8,047   3,139      38,830 $      265,192      9.09          8.31         9.34% $        264,705           0.18%

ALL AREAS                            ALL     42,543 $       373,757       8,810   3,404      42,385 $      260,321      9.35          8.57          9.07% $       260,353          -0.01%
(including areas not listed above)

Under Contract/Pending sales included in Sales Calculation. A balanced market typically has a 3.00 to 4.00 months supply. Less than that is undersupplied, more is oversupplied.
Average Sales Price changes may be exaggerated if significant amount of New Construction is reported in the MLS.
Average Sales Price noted from previous year to current year should not be construed as Appreciation - it is percent of change of average sales price.


          Data Source: MRED LLC                                    (C) Copyright 2011, A. L. Wagner Appraisal Group, Inc.
          Midwest Real Estate Data, LLC                               (630) 416-6556 ~ www.WagnerAppraisal.com                                                          Page 6

Mais conteúdo relacionado

Mais procurados

Houston marketreport sep12_sf
Houston marketreport sep12_sfHouston marketreport sep12_sf
Houston marketreport sep12_sfToni Moss
 
The US Housing Market - Housing Supply & Demand
The US Housing Market - Housing Supply & DemandThe US Housing Market - Housing Supply & Demand
The US Housing Market - Housing Supply & DemandAltos Research
 
J.S. Die & Mold - Operations Review 2006-12-21
J.S. Die & Mold - Operations Review 2006-12-21J.S. Die & Mold - Operations Review 2006-12-21
J.S. Die & Mold - Operations Review 2006-12-21Bob Sloma
 
August 2011 Market Pulse - Detached Homes
August 2011 Market Pulse - Detached HomesAugust 2011 Market Pulse - Detached Homes
August 2011 Market Pulse - Detached Homeschipwags
 
The importance of being diligent graphic booklet (n.6 wg trading)
The importance of being diligent   graphic booklet (n.6 wg trading)The importance of being diligent   graphic booklet (n.6 wg trading)
The importance of being diligent graphic booklet (n.6 wg trading)susvolans
 
Top 100 Retail Brands
Top 100 Retail BrandsTop 100 Retail Brands
Top 100 Retail BrandsSumit Roy
 
Dallas Market Update January 2008
Dallas Market Update January 2008Dallas Market Update January 2008
Dallas Market Update January 2008Dee Patience
 
2011 presentation jay butler
2011 presentation jay butler2011 presentation jay butler
2011 presentation jay butlerFidelityPhoenix
 
10 Ways to Use Life Insurance in Philanthropic Planning
10 Ways to Use Life Insurance in Philanthropic Planning10 Ways to Use Life Insurance in Philanthropic Planning
10 Ways to Use Life Insurance in Philanthropic Planningtbonhag
 
H W 2010 01 De
H W 2010 01 DeH W 2010 01 De
H W 2010 01 Dechipwags
 

Mais procurados (20)

Houston marketreport sep12_sf
Houston marketreport sep12_sfHouston marketreport sep12_sf
Houston marketreport sep12_sf
 
The US Housing Market - Housing Supply & Demand
The US Housing Market - Housing Supply & DemandThe US Housing Market - Housing Supply & Demand
The US Housing Market - Housing Supply & Demand
 
Taller 13
Taller 13Taller 13
Taller 13
 
Coldwell Banker C&C Properties Sales Dec 2010
Coldwell Banker C&C Properties Sales Dec 2010Coldwell Banker C&C Properties Sales Dec 2010
Coldwell Banker C&C Properties Sales Dec 2010
 
J.S. Die & Mold - Operations Review 2006-12-21
J.S. Die & Mold - Operations Review 2006-12-21J.S. Die & Mold - Operations Review 2006-12-21
J.S. Die & Mold - Operations Review 2006-12-21
 
August 2011 Market Pulse - Detached Homes
August 2011 Market Pulse - Detached HomesAugust 2011 Market Pulse - Detached Homes
August 2011 Market Pulse - Detached Homes
 
The importance of being diligent graphic booklet (n.6 wg trading)
The importance of being diligent   graphic booklet (n.6 wg trading)The importance of being diligent   graphic booklet (n.6 wg trading)
The importance of being diligent graphic booklet (n.6 wg trading)
 
Houston Market Report August 2010
Houston Market Report August 2010Houston Market Report August 2010
Houston Market Report August 2010
 
Houston Market Report April 2010
Houston Market Report April 2010Houston Market Report April 2010
Houston Market Report April 2010
 
Top 100 Retail Brands
Top 100 Retail BrandsTop 100 Retail Brands
Top 100 Retail Brands
 
Dallas Market Update January 2008
Dallas Market Update January 2008Dallas Market Update January 2008
Dallas Market Update January 2008
 
Lake Elsinore EWDC 2-21-13
Lake Elsinore EWDC 2-21-13Lake Elsinore EWDC 2-21-13
Lake Elsinore EWDC 2-21-13
 
Houston Market Report February 2010
Houston Market Report February 2010Houston Market Report February 2010
Houston Market Report February 2010
 
Jan Tmo
Jan TmoJan Tmo
Jan Tmo
 
2011 presentation jay butler
2011 presentation jay butler2011 presentation jay butler
2011 presentation jay butler
 
Tmo Feb
Tmo FebTmo Feb
Tmo Feb
 
10 Ways to Use Life Insurance in Philanthropic Planning
10 Ways to Use Life Insurance in Philanthropic Planning10 Ways to Use Life Insurance in Philanthropic Planning
10 Ways to Use Life Insurance in Philanthropic Planning
 
H W 2010 01 De
H W 2010 01 DeH W 2010 01 De
H W 2010 01 De
 
Forecast
ForecastForecast
Forecast
 
Overview report to City of Temecula/Affiliate event 2/22/12
Overview report to City of Temecula/Affiliate event 2/22/12Overview report to City of Temecula/Affiliate event 2/22/12
Overview report to City of Temecula/Affiliate event 2/22/12
 

Semelhante a Chicagoland Quarterly Supply/Demand Report - 7/1/2011

Rebgv stats package%2_c_october_2011_%282%29
Rebgv stats package%2_c_october_2011_%282%29Rebgv stats package%2_c_october_2011_%282%29
Rebgv stats package%2_c_october_2011_%282%29vancouverhomesteam
 
October 2011 REBGV Stats Mike Stewart
October 2011 REBGV Stats Mike StewartOctober 2011 REBGV Stats Mike Stewart
October 2011 REBGV Stats Mike StewartMike Stewart
 
Rebgv stats package%2_c_october_2011_%282%29
Rebgv stats package%2_c_october_2011_%282%29Rebgv stats package%2_c_october_2011_%282%29
Rebgv stats package%2_c_october_2011_%282%29vancouverhomesteam
 
Vancouver real estate stats package, December 2011
Vancouver real estate stats package, December 2011Vancouver real estate stats package, December 2011
Vancouver real estate stats package, December 2011Matt Collinge
 
REBGV Stats for December 2011 Courtesy Mike Stewart Vancouver Realtor
REBGV Stats for December 2011 Courtesy Mike Stewart Vancouver RealtorREBGV Stats for December 2011 Courtesy Mike Stewart Vancouver Realtor
REBGV Stats for December 2011 Courtesy Mike Stewart Vancouver RealtorMike Stewart
 
Vancouver real estate stats package, june 2011
Vancouver real estate stats package, june 2011Vancouver real estate stats package, june 2011
Vancouver real estate stats package, june 2011Matt Collinge
 
Vancouver real estate stats package September 2011
Vancouver real estate stats package September 2011Vancouver real estate stats package September 2011
Vancouver real estate stats package September 2011Matt Collinge
 
REBGV Stats for Sept 2011 Mike Stewart
REBGV Stats for Sept 2011 Mike StewartREBGV Stats for Sept 2011 Mike Stewart
REBGV Stats for Sept 2011 Mike StewartMike Stewart
 
November 2011-rebgv-stats-adam scalena
November 2011-rebgv-stats-adam scalenaNovember 2011-rebgv-stats-adam scalena
November 2011-rebgv-stats-adam scalenavancouverhomesteam
 
Vancouver real estate rebgv stats package january 2011
Vancouver real estate rebgv stats package january 2011Vancouver real estate rebgv stats package january 2011
Vancouver real estate rebgv stats package january 2011Matt Collinge
 
H W 2010 07 De
H W 2010 07 DeH W 2010 07 De
H W 2010 07 Dechipwags
 
Nov 1st 2011 Vreb Statistics
Nov 1st 2011 Vreb StatisticsNov 1st 2011 Vreb Statistics
Nov 1st 2011 Vreb StatisticsTara Lynn
 
March 2099 Stats Real Estate Board Of Greater Vancouver
March 2099 Stats Real Estate Board Of Greater VancouverMarch 2099 Stats Real Estate Board Of Greater Vancouver
March 2099 Stats Real Estate Board Of Greater VancouverChristopher R Anderson
 
Chicagoland Monthly Maket Pulse -Feb 2010 Detached
Chicagoland Monthly Maket Pulse -Feb 2010 DetachedChicagoland Monthly Maket Pulse -Feb 2010 Detached
Chicagoland Monthly Maket Pulse -Feb 2010 Detachedchipwags
 
Wag Report 2009 11 De
Wag Report 2009 11 DeWag Report 2009 11 De
Wag Report 2009 11 Dechipwags
 

Semelhante a Chicagoland Quarterly Supply/Demand Report - 7/1/2011 (20)

Rebgv stats package%2_c_october_2011_%282%29
Rebgv stats package%2_c_october_2011_%282%29Rebgv stats package%2_c_october_2011_%282%29
Rebgv stats package%2_c_october_2011_%282%29
 
Stats Oct 11
Stats Oct 11Stats Oct 11
Stats Oct 11
 
October 2011 REBGV Stats Mike Stewart
October 2011 REBGV Stats Mike StewartOctober 2011 REBGV Stats Mike Stewart
October 2011 REBGV Stats Mike Stewart
 
Rebgv stats package%2_c_october_2011_%282%29
Rebgv stats package%2_c_october_2011_%282%29Rebgv stats package%2_c_october_2011_%282%29
Rebgv stats package%2_c_october_2011_%282%29
 
Vancouver real estate stats package, December 2011
Vancouver real estate stats package, December 2011Vancouver real estate stats package, December 2011
Vancouver real estate stats package, December 2011
 
REBGV Stats for December 2011 Courtesy Mike Stewart Vancouver Realtor
REBGV Stats for December 2011 Courtesy Mike Stewart Vancouver RealtorREBGV Stats for December 2011 Courtesy Mike Stewart Vancouver Realtor
REBGV Stats for December 2011 Courtesy Mike Stewart Vancouver Realtor
 
Vancouver real estate stats package, june 2011
Vancouver real estate stats package, june 2011Vancouver real estate stats package, june 2011
Vancouver real estate stats package, june 2011
 
Vancouver real estate stats package September 2011
Vancouver real estate stats package September 2011Vancouver real estate stats package September 2011
Vancouver real estate stats package September 2011
 
September 2011 REBGV
September 2011 REBGV September 2011 REBGV
September 2011 REBGV
 
REBGV Stats for Sept 2011 Mike Stewart
REBGV Stats for Sept 2011 Mike StewartREBGV Stats for Sept 2011 Mike Stewart
REBGV Stats for Sept 2011 Mike Stewart
 
November 2011-rebgv-stats-adam scalena
November 2011-rebgv-stats-adam scalenaNovember 2011-rebgv-stats-adam scalena
November 2011-rebgv-stats-adam scalena
 
Vancouver real estate rebgv stats package january 2011
Vancouver real estate rebgv stats package january 2011Vancouver real estate rebgv stats package january 2011
Vancouver real estate rebgv stats package january 2011
 
H W 2010 07 De
H W 2010 07 DeH W 2010 07 De
H W 2010 07 De
 
Nov 1st 2011 Vreb Statistics
Nov 1st 2011 Vreb StatisticsNov 1st 2011 Vreb Statistics
Nov 1st 2011 Vreb Statistics
 
March 2099 Stats Real Estate Board Of Greater Vancouver
March 2099 Stats Real Estate Board Of Greater VancouverMarch 2099 Stats Real Estate Board Of Greater Vancouver
March 2099 Stats Real Estate Board Of Greater Vancouver
 
Chicagoland Monthly Maket Pulse -Feb 2010 Detached
Chicagoland Monthly Maket Pulse -Feb 2010 DetachedChicagoland Monthly Maket Pulse -Feb 2010 Detached
Chicagoland Monthly Maket Pulse -Feb 2010 Detached
 
Houston Market Report March 2010
Houston Market Report March 2010Houston Market Report March 2010
Houston Market Report March 2010
 
Wag Report 2009 11 De
Wag Report 2009 11 DeWag Report 2009 11 De
Wag Report 2009 11 De
 
Houston Market Report July 2010
Houston Market Report July 2010Houston Market Report July 2010
Houston Market Report July 2010
 
Rebgv june 2012 stats
Rebgv june 2012 statsRebgv june 2012 stats
Rebgv june 2012 stats
 

Mais de chipwags

H W 2011 10 At
H W 2011 10 AtH W 2011 10 At
H W 2011 10 Atchipwags
 
August 2011 Market Pulse - Attached Homes
August 2011 Market Pulse - Attached HomesAugust 2011 Market Pulse - Attached Homes
August 2011 Market Pulse - Attached Homeschipwags
 
E Newsletter7 2010
E Newsletter7 2010E Newsletter7 2010
E Newsletter7 2010chipwags
 
H W 2010 07 At
H W 2010 07 AtH W 2010 07 At
H W 2010 07 Atchipwags
 
Chicagoland Monthly Maket Pulse -Feb 2010 Attached
Chicagoland Monthly Maket Pulse -Feb 2010 AttachedChicagoland Monthly Maket Pulse -Feb 2010 Attached
Chicagoland Monthly Maket Pulse -Feb 2010 Attachedchipwags
 
H W 2010 01 At
H W 2010 01 AtH W 2010 01 At
H W 2010 01 Atchipwags
 
Appraisal Foundation Presentation 2007
Appraisal Foundation Presentation 2007Appraisal Foundation Presentation 2007
Appraisal Foundation Presentation 2007chipwags
 

Mais de chipwags (7)

H W 2011 10 At
H W 2011 10 AtH W 2011 10 At
H W 2011 10 At
 
August 2011 Market Pulse - Attached Homes
August 2011 Market Pulse - Attached HomesAugust 2011 Market Pulse - Attached Homes
August 2011 Market Pulse - Attached Homes
 
E Newsletter7 2010
E Newsletter7 2010E Newsletter7 2010
E Newsletter7 2010
 
H W 2010 07 At
H W 2010 07 AtH W 2010 07 At
H W 2010 07 At
 
Chicagoland Monthly Maket Pulse -Feb 2010 Attached
Chicagoland Monthly Maket Pulse -Feb 2010 AttachedChicagoland Monthly Maket Pulse -Feb 2010 Attached
Chicagoland Monthly Maket Pulse -Feb 2010 Attached
 
H W 2010 01 At
H W 2010 01 AtH W 2010 01 At
H W 2010 01 At
 
Appraisal Foundation Presentation 2007
Appraisal Foundation Presentation 2007Appraisal Foundation Presentation 2007
Appraisal Foundation Presentation 2007
 

Último

Monthly Social Media Update April 2024 pptx.pptx
Monthly Social Media Update April 2024 pptx.pptxMonthly Social Media Update April 2024 pptx.pptx
Monthly Social Media Update April 2024 pptx.pptxAndy Lambert
 
Cracking the Cultural Competence Code.pptx
Cracking the Cultural Competence Code.pptxCracking the Cultural Competence Code.pptx
Cracking the Cultural Competence Code.pptxWorkforce Group
 
Eluru Call Girls Service ☎ ️93326-06886 ❤️‍🔥 Enjoy 24/7 Escort Service
Eluru Call Girls Service ☎ ️93326-06886 ❤️‍🔥 Enjoy 24/7 Escort ServiceEluru Call Girls Service ☎ ️93326-06886 ❤️‍🔥 Enjoy 24/7 Escort Service
Eluru Call Girls Service ☎ ️93326-06886 ❤️‍🔥 Enjoy 24/7 Escort ServiceDamini Dixit
 
Value Proposition canvas- Customer needs and pains
Value Proposition canvas- Customer needs and painsValue Proposition canvas- Customer needs and pains
Value Proposition canvas- Customer needs and painsP&CO
 
Call Girls In DLf Gurgaon ➥99902@11544 ( Best price)100% Genuine Escort In 24...
Call Girls In DLf Gurgaon ➥99902@11544 ( Best price)100% Genuine Escort In 24...Call Girls In DLf Gurgaon ➥99902@11544 ( Best price)100% Genuine Escort In 24...
Call Girls In DLf Gurgaon ➥99902@11544 ( Best price)100% Genuine Escort In 24...lizamodels9
 
FULL ENJOY Call Girls In Majnu Ka Tilla, Delhi Contact Us 8377877756
FULL ENJOY Call Girls In Majnu Ka Tilla, Delhi Contact Us 8377877756FULL ENJOY Call Girls In Majnu Ka Tilla, Delhi Contact Us 8377877756
FULL ENJOY Call Girls In Majnu Ka Tilla, Delhi Contact Us 8377877756dollysharma2066
 
Call Girls Service In Old Town Dubai ((0551707352)) Old Town Dubai Call Girl ...
Call Girls Service In Old Town Dubai ((0551707352)) Old Town Dubai Call Girl ...Call Girls Service In Old Town Dubai ((0551707352)) Old Town Dubai Call Girl ...
Call Girls Service In Old Town Dubai ((0551707352)) Old Town Dubai Call Girl ...allensay1
 
Uneak White's Personal Brand Exploration Presentation
Uneak White's Personal Brand Exploration PresentationUneak White's Personal Brand Exploration Presentation
Uneak White's Personal Brand Exploration Presentationuneakwhite
 
The Path to Product Excellence: Avoiding Common Pitfalls and Enhancing Commun...
The Path to Product Excellence: Avoiding Common Pitfalls and Enhancing Commun...The Path to Product Excellence: Avoiding Common Pitfalls and Enhancing Commun...
The Path to Product Excellence: Avoiding Common Pitfalls and Enhancing Commun...Aggregage
 
Russian Call Girls In Gurgaon ❤️8448577510 ⊹Best Escorts Service In 24/7 Delh...
Russian Call Girls In Gurgaon ❤️8448577510 ⊹Best Escorts Service In 24/7 Delh...Russian Call Girls In Gurgaon ❤️8448577510 ⊹Best Escorts Service In 24/7 Delh...
Russian Call Girls In Gurgaon ❤️8448577510 ⊹Best Escorts Service In 24/7 Delh...lizamodels9
 
Call Girls From Pari Chowk Greater Noida ❤️8448577510 ⊹Best Escorts Service I...
Call Girls From Pari Chowk Greater Noida ❤️8448577510 ⊹Best Escorts Service I...Call Girls From Pari Chowk Greater Noida ❤️8448577510 ⊹Best Escorts Service I...
Call Girls From Pari Chowk Greater Noida ❤️8448577510 ⊹Best Escorts Service I...lizamodels9
 
Katrina Personal Brand Project and portfolio 1
Katrina Personal Brand Project and portfolio 1Katrina Personal Brand Project and portfolio 1
Katrina Personal Brand Project and portfolio 1kcpayne
 
Mysore Call Girls 8617370543 WhatsApp Number 24x7 Best Services
Mysore Call Girls 8617370543 WhatsApp Number 24x7 Best ServicesMysore Call Girls 8617370543 WhatsApp Number 24x7 Best Services
Mysore Call Girls 8617370543 WhatsApp Number 24x7 Best ServicesDipal Arora
 
Call Girls Kengeri Satellite Town Just Call 👗 7737669865 👗 Top Class Call Gir...
Call Girls Kengeri Satellite Town Just Call 👗 7737669865 👗 Top Class Call Gir...Call Girls Kengeri Satellite Town Just Call 👗 7737669865 👗 Top Class Call Gir...
Call Girls Kengeri Satellite Town Just Call 👗 7737669865 👗 Top Class Call Gir...amitlee9823
 
Falcon Invoice Discounting: The best investment platform in india for investors
Falcon Invoice Discounting: The best investment platform in india for investorsFalcon Invoice Discounting: The best investment platform in india for investors
Falcon Invoice Discounting: The best investment platform in india for investorsFalcon Invoice Discounting
 
Phases of Negotiation .pptx
 Phases of Negotiation .pptx Phases of Negotiation .pptx
Phases of Negotiation .pptxnandhinijagan9867
 
It will be International Nurses' Day on 12 May
It will be International Nurses' Day on 12 MayIt will be International Nurses' Day on 12 May
It will be International Nurses' Day on 12 MayNZSG
 
Quick Doctor In Kuwait +2773`7758`557 Kuwait Doha Qatar Dubai Abu Dhabi Sharj...
Quick Doctor In Kuwait +2773`7758`557 Kuwait Doha Qatar Dubai Abu Dhabi Sharj...Quick Doctor In Kuwait +2773`7758`557 Kuwait Doha Qatar Dubai Abu Dhabi Sharj...
Quick Doctor In Kuwait +2773`7758`557 Kuwait Doha Qatar Dubai Abu Dhabi Sharj...daisycvs
 

Último (20)

Monthly Social Media Update April 2024 pptx.pptx
Monthly Social Media Update April 2024 pptx.pptxMonthly Social Media Update April 2024 pptx.pptx
Monthly Social Media Update April 2024 pptx.pptx
 
Cracking the Cultural Competence Code.pptx
Cracking the Cultural Competence Code.pptxCracking the Cultural Competence Code.pptx
Cracking the Cultural Competence Code.pptx
 
Eluru Call Girls Service ☎ ️93326-06886 ❤️‍🔥 Enjoy 24/7 Escort Service
Eluru Call Girls Service ☎ ️93326-06886 ❤️‍🔥 Enjoy 24/7 Escort ServiceEluru Call Girls Service ☎ ️93326-06886 ❤️‍🔥 Enjoy 24/7 Escort Service
Eluru Call Girls Service ☎ ️93326-06886 ❤️‍🔥 Enjoy 24/7 Escort Service
 
Value Proposition canvas- Customer needs and pains
Value Proposition canvas- Customer needs and painsValue Proposition canvas- Customer needs and pains
Value Proposition canvas- Customer needs and pains
 
Call Girls In DLf Gurgaon ➥99902@11544 ( Best price)100% Genuine Escort In 24...
Call Girls In DLf Gurgaon ➥99902@11544 ( Best price)100% Genuine Escort In 24...Call Girls In DLf Gurgaon ➥99902@11544 ( Best price)100% Genuine Escort In 24...
Call Girls In DLf Gurgaon ➥99902@11544 ( Best price)100% Genuine Escort In 24...
 
FULL ENJOY Call Girls In Majnu Ka Tilla, Delhi Contact Us 8377877756
FULL ENJOY Call Girls In Majnu Ka Tilla, Delhi Contact Us 8377877756FULL ENJOY Call Girls In Majnu Ka Tilla, Delhi Contact Us 8377877756
FULL ENJOY Call Girls In Majnu Ka Tilla, Delhi Contact Us 8377877756
 
Call Girls Service In Old Town Dubai ((0551707352)) Old Town Dubai Call Girl ...
Call Girls Service In Old Town Dubai ((0551707352)) Old Town Dubai Call Girl ...Call Girls Service In Old Town Dubai ((0551707352)) Old Town Dubai Call Girl ...
Call Girls Service In Old Town Dubai ((0551707352)) Old Town Dubai Call Girl ...
 
Uneak White's Personal Brand Exploration Presentation
Uneak White's Personal Brand Exploration PresentationUneak White's Personal Brand Exploration Presentation
Uneak White's Personal Brand Exploration Presentation
 
The Path to Product Excellence: Avoiding Common Pitfalls and Enhancing Commun...
The Path to Product Excellence: Avoiding Common Pitfalls and Enhancing Commun...The Path to Product Excellence: Avoiding Common Pitfalls and Enhancing Commun...
The Path to Product Excellence: Avoiding Common Pitfalls and Enhancing Commun...
 
Russian Call Girls In Gurgaon ❤️8448577510 ⊹Best Escorts Service In 24/7 Delh...
Russian Call Girls In Gurgaon ❤️8448577510 ⊹Best Escorts Service In 24/7 Delh...Russian Call Girls In Gurgaon ❤️8448577510 ⊹Best Escorts Service In 24/7 Delh...
Russian Call Girls In Gurgaon ❤️8448577510 ⊹Best Escorts Service In 24/7 Delh...
 
Call Girls From Pari Chowk Greater Noida ❤️8448577510 ⊹Best Escorts Service I...
Call Girls From Pari Chowk Greater Noida ❤️8448577510 ⊹Best Escorts Service I...Call Girls From Pari Chowk Greater Noida ❤️8448577510 ⊹Best Escorts Service I...
Call Girls From Pari Chowk Greater Noida ❤️8448577510 ⊹Best Escorts Service I...
 
(Anamika) VIP Call Girls Napur Call Now 8617697112 Napur Escorts 24x7
(Anamika) VIP Call Girls Napur Call Now 8617697112 Napur Escorts 24x7(Anamika) VIP Call Girls Napur Call Now 8617697112 Napur Escorts 24x7
(Anamika) VIP Call Girls Napur Call Now 8617697112 Napur Escorts 24x7
 
Katrina Personal Brand Project and portfolio 1
Katrina Personal Brand Project and portfolio 1Katrina Personal Brand Project and portfolio 1
Katrina Personal Brand Project and portfolio 1
 
Mysore Call Girls 8617370543 WhatsApp Number 24x7 Best Services
Mysore Call Girls 8617370543 WhatsApp Number 24x7 Best ServicesMysore Call Girls 8617370543 WhatsApp Number 24x7 Best Services
Mysore Call Girls 8617370543 WhatsApp Number 24x7 Best Services
 
Call Girls Kengeri Satellite Town Just Call 👗 7737669865 👗 Top Class Call Gir...
Call Girls Kengeri Satellite Town Just Call 👗 7737669865 👗 Top Class Call Gir...Call Girls Kengeri Satellite Town Just Call 👗 7737669865 👗 Top Class Call Gir...
Call Girls Kengeri Satellite Town Just Call 👗 7737669865 👗 Top Class Call Gir...
 
Falcon Invoice Discounting: The best investment platform in india for investors
Falcon Invoice Discounting: The best investment platform in india for investorsFalcon Invoice Discounting: The best investment platform in india for investors
Falcon Invoice Discounting: The best investment platform in india for investors
 
unwanted pregnancy Kit [+918133066128] Abortion Pills IN Dubai UAE Abudhabi
unwanted pregnancy Kit [+918133066128] Abortion Pills IN Dubai UAE Abudhabiunwanted pregnancy Kit [+918133066128] Abortion Pills IN Dubai UAE Abudhabi
unwanted pregnancy Kit [+918133066128] Abortion Pills IN Dubai UAE Abudhabi
 
Phases of Negotiation .pptx
 Phases of Negotiation .pptx Phases of Negotiation .pptx
Phases of Negotiation .pptx
 
It will be International Nurses' Day on 12 May
It will be International Nurses' Day on 12 MayIt will be International Nurses' Day on 12 May
It will be International Nurses' Day on 12 May
 
Quick Doctor In Kuwait +2773`7758`557 Kuwait Doha Qatar Dubai Abu Dhabi Sharj...
Quick Doctor In Kuwait +2773`7758`557 Kuwait Doha Qatar Dubai Abu Dhabi Sharj...Quick Doctor In Kuwait +2773`7758`557 Kuwait Doha Qatar Dubai Abu Dhabi Sharj...
Quick Doctor In Kuwait +2773`7758`557 Kuwait Doha Qatar Dubai Abu Dhabi Sharj...
 

Chicagoland Quarterly Supply/Demand Report - 7/1/2011

  • 1. A.L. Wagner Appraisal Group Presents THE CHICAGOLAND QUARTERLY HOUSING REPORT The Analysis of Absorption Rates and Percentage of Change in Inventory Level Single Family Detached Residences July 1, 2010 to June 30, 2011 Sponsored by: Alvin "Chip" Wagner III, SRA, SCRP A. L. Wagner Appraisal Group, Inc. Specializing in Relocation, Litigation & Lending Appraisals 1807 Washington Street, Suite 110, Naperville, IL 60565 Serving the Chicagoland Area since 1970 (630) 416-6556 ~ www.wagnerappraisal.com ~ chip@rac.net Offices in Naperville, Plainfield, Chicago, Flossmoor July 1, 2011 Statistics July 1, 2010 Statistics Under Under # of Sales 12 mo SP MLS Average Contract Contract Last Average MONTHS MONTHS Percent Average Percent Town Area Actives List Price (Ctg.) (Pend) 12 mos. Sale Price SUPPLY SUPPLY Change Sale Price Change Addison 101 201 $ 283,286 35 11 167 $ 186,718 11.32 8.60 31.63% $ 208,814 -10.58% Algonquin 102 256 $ 283,203 46 7 195 $ 230,214 12.39 12.30 0.72% $ 254,512 -9.55% Alsip 658 84 $ 181,532 14 5 87 $ 128,395 9.51 10.39 -8.44% $ 150,869 -14.90% Antioch 2 276 $ 298,554 37 5 201 $ 183,757 13.63 11.83 15.18% $ 196,398 -6.44% Arlington Heights 5 362 $ 415,111 76 12 404 $ 349,803 8.83 9.63 -8.28% $ 359,249 -2.63% Aurora - DuPage County 507 162 $ 327,895 56 13 245 $ 268,792 6.19 6.34 -2.40% $ 270,958 -0.80% Aurora - Kane County 507 616 $ 137,056 230 92 943 $ 99,580 5.84 7.13 -18.08% $ 117,699 -15.39% Aurora - Will, Kendall Cty 507 85 $ 255,888 34 1 110 $ 219,112 7.03 7.23 -2.68% $ 232,996 -5.96% Barrington Area 10 585 $ 1,056,695 70 15 379 $ 552,881 15.13 16.74 -9.63% $ 567,486 -2.57% Bartlett 104 238 $ 308,557 45 8 227 $ 262,286 10.20 11.92 -14.40% $ 275,851 -4.92% Batavia 510 189 $ 347,955 48 10 197 $ 284,199 8.89 9.67 -7.99% $ 298,312 -4.73% Beecher 401 64 $ 264,242 8 1 27 $ 185,723 21.33 25.03 -14.76% $ 187,381 -0.88% Bellwood 2104 130 $ 107,349 37 18 166 $ 76,408 7.06 4.81 46.76% $ 86,642 -11.81% Bensenville 106 110 $ 243,276 27 17 105 $ 164,261 8.86 7.86 12.65% $ 166,504 -1.35% Berwyn 402 252 $ 160,707 79 44 297 $ 130,846 7.20 4.92 46.38% $ 140,308 -6.74% Bloomingdale 108 116 $ 440,944 17 4 82 $ 311,937 13.51 11.77 14.79% $ 330,652 -5.66% Data Source: MRED LLC (C) Copyright 2011, A. L. Wagner Appraisal Group, Inc. Midwest Real Estate Data, LLC (630) 416-6556 ~ www.WagnerAppraisal.com Page 1
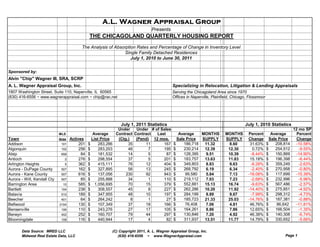
  • 2. July 1, 2011 Statistics July 1, 2010 Statistics Under Under # of Sales 12 mo SP MLS Average Contract Contract Last Average MONTHS MONTHS Percent Average Percent Town Area Actives List Price (Ctg.) (Pend) 12 mos. Sale Price SUPPLY SUPPLY Change Sale Price Change Blue Island 406 82 $ 101,120 14 14 85 $ 67,470 8.71 10.51 -17.17% $ 90,532 -25.47% Bolingbrook 440 408 $ 219,654 130 33 446 $ 183,890 8.04 7.20 11.71% $ 191,757 -4.10% Bridgeview 455 68 $ 209,459 12 8 52 $ 155,529 11.33 7.14 58.75% $ 177,632 -12.44% Broadview 155 50 $ 136,712 4 9 49 $ 96,360 9.68 7.01 38.03% $ 105,949 -9.05% Brookfield 513 109 $ 243,260 20 5 117 $ 185,217 9.21 6.19 48.77% $ 216,367 -14.40% Buffalo Grove 89 162 $ 379,043 56 6 211 $ 321,887 7.12 6.66 6.95% $ 365,115 -11.84% Burbank 454 178 $ 200,375 43 18 190 $ 156,736 8.51 7.60 11.91% $ 185,362 -15.44% Burnham 633 24 $ 94,194 2 5 23 $ 36,518 9.60 4.54 111.43% $ 47,089 -22.45% Burr Ridge 522 172 $ 1,297,339 19 6 107 $ 780,839 15.64 21.05 -25.73% $ 795,101 -1.79% Calumet City 409 271 $ 84,994 34 42 246 $ 54,017 10.10 7.01 44.03% $ 63,121 -14.42% Calumet Park 643 36 $ 91,023 6 14 42 $ 46,853 6.97 5.78 20.60% $ 51,901 -9.73% Carol Stream 188 154 $ 240,099 30 6 133 $ 212,716 10.93 10.26 6.60% $ 230,630 -7.77% Carpentersville 110 221 $ 163,870 82 34 318 $ 111,709 6.11 8.29 -26.26% $ 118,628 -5.83% Cary 13 249 $ 272,188 40 12 124 $ 232,835 16.98 11.74 44.62% $ 232,460 0.16% Channahon 410 93 $ 231,190 22 8 90 $ 203,087 9.30 11.19 -16.86% $ 203,293 -0.10% Chicago Heights 411 190 $ 97,441 14 18 177 $ 61,761 10.91 7.26 50.20% $ 61,488 0.44% Chicago Ridge 415 31 $ 186,454 8 3 37 $ 137,280 7.75 12.00 -35.42% $ 174,288 -21.23% Cicero 650 221 $ 107,039 65 44 314 $ 85,127 6.27 4.62 35.73% $ 93,474 -8.93% Clarendon Hills 514 80 $ 710,416 16 3 71 $ 677,337 10.67 7.57 40.84% $ 538,421 25.80% Country Club Hills 478 132 $ 120,648 31 19 182 $ 96,347 6.83 5.42 26.08% $ 94,870 1.56% Countryside 527 27 $ 399,693 3 0 25 $ 259,220 11.57 10.13 14.29% $ 255,397 1.50% Crestwood 446 41 $ 208,475 6 2 25 $ 169,332 14.91 14.33 4.02% $ 186,256 -9.09% Crete 417 171 $ 228,922 21 14 110 $ 146,921 14.15 10.71 32.08% $ 156,048 -5.85% Crystal Lake (& Lakewood) 14 463 $ 323,533 123 17 431 $ 242,508 9.73 10.50 -7.29% $ 242,266 0.10% Darien 562 95 $ 389,394 21 2 101 $ 299,713 9.19 10.10 -8.97% $ 314,150 -4.60% Deerfield 15 132 $ 645,031 32 10 157 $ 476,053 7.96 10.40 -23.46% $ 515,252 -7.61% Des Plaines 16 303 $ 317,501 68 20 332 $ 230,138 8.66 9.46 -8.44% $ 235,470 -2.26% Dolton 419 200 $ 78,152 33 37 199 $ 46,017 8.92 5.19 71.82% $ 49,447 -6.94% Downers Grove 515 353 $ 457,347 73 14 327 $ 366,768 10.23 10.88 -5.98% $ 361,729 1.39% Elgin 123 821 $ 222,729 217 74 778 $ 153,894 9.22 8.93 3.20% $ 169,705 -9.32% Elk Grove Village 7 146 $ 291,033 25 8 124 $ 242,832 11.16 10.12 10.28% $ 258,006 -5.88% Elmhurst 126 307 $ 502,175 93 5 339 $ 407,132 8.43 8.69 -3.03% $ 423,983 -3.97% Elmwood Park 635 122 $ 252,928 42 16 136 $ 181,785 7.55 8.15 -7.42% $ 201,455 -9.76% Evanston 201 244 $ 659,213 62 23 344 $ 480,173 6.83 6.64 2.82% $ 466,302 2.97% Evergreen Park 642 154 $ 175,869 33 11 139 $ 132,333 10.10 8.60 17.46% $ 165,581 -20.08% Flossmoor 422 135 $ 326,720 16 8 102 $ 237,725 12.86 10.79 19.14% $ 221,654 7.25% Data Source: MRED LLC (C) Copyright 2011, A. L. Wagner Appraisal Group, Inc. Midwest Real Estate Data, LLC (630) 416-6556 ~ www.WagnerAppraisal.com Page 2
  • 3. July 1, 2011 Statistics July 1, 2010 Statistics Under Under # of Sales 12 mo SP MLS Average Contract Contract Last Average MONTHS MONTHS Percent Average Percent Town Area Actives List Price (Ctg.) (Pend) 12 mos. Sale Price SUPPLY SUPPLY Change Sale Price Change Forest Park 130 63 $ 217,099 10 4 35 $ 206,750 15.43 10.00 54.29% $ 234,577 -11.86% Fox Lake 20 79 $ 286,881 12 4 56 $ 170,424 13.17 16.12 -18.32% $ 153,802 10.81% Fox River Grove 21 49 $ 254,250 13 2 50 $ 207,960 9.05 17.70 -48.89% $ 228,144 -8.85% Frankfort 423 262 $ 440,496 33 5 171 $ 334,100 15.04 11.70 28.62% $ 336,407 -0.69% Franklin Park 131 129 $ 168,986 39 14 140 $ 138,005 8.02 6.00 33.68% $ 144,873 -4.74% Geneva 134 253 $ 400,719 55 3 250 $ 338,457 9.86 7.76 26.98% $ 344,307 -1.70% Glen Ellyn 137 249 $ 520,462 61 11 325 $ 422,343 7.53 9.62 -21.75% $ 425,122 -0.65% Glencoe 22 108 $ 1,632,669 17 8 126 $ 1,080,568 8.58 12.38 -30.64% $ 1,058,964 2.04% Glendale Heights 139 128 $ 182,889 47 15 159 $ 139,631 6.95 5.42 28.35% $ 157,658 -11.43% Glenview 25 345 $ 707,632 74 24 359 $ 583,962 9.06 9.74 -7.03% $ 593,103 -1.54% Glenwood 425 64 $ 128,924 8 8 51 $ 102,086 11.46 4.11 179.22% $ 106,005 -3.70% Gurnee 31 240 $ 298,150 49 7 202 $ 253,732 11.16 10.36 7.77% $ 274,292 -7.50% Hanover Park 103 125 $ 176,539 38 21 155 $ 133,128 7.01 6.86 2.11% $ 161,990 -17.82% Harvey 426 128 $ 56,148 12 25 150 $ 21,714 8.21 6.73 22.08% $ 22,648 -4.12% Harwood Heights 656 43 $ 304,898 9 4 59 $ 236,692 7.17 13.15 -45.52% $ 259,632 -8.84% Hazel Crest 429 84 $ 105,739 22 12 132 $ 59,200 6.07 6.64 -8.61% $ 74,712 -20.76% Hickory Hills 457 81 $ 249,669 15 1 52 $ 177,582 14.29 10.00 42.94% $ 216,061 -17.81% Highland Park 35 300 $ 1,023,780 61 19 248 $ 564,499 10.98 10.64 3.19% $ 612,314 -7.81% Hillside 162 56 $ 127,930 13 7 64 $ 118,089 8.00 7.89 1.39% $ 135,448 -12.82% Hinkley 520 20 $ 200,435 2 0 14 $ 140,236 15.00 18.40 -18.48% $ 158,979 -11.79% Hinsdale 521 274 $ 1,294,447 28 5 244 $ 1,012,623 11.87 9.41 26.16% $ 936,239 8.16% Hoffman Estates 194 199 $ 305,705 59 8 223 $ 261,133 8.23 7.60 8.40% $ 285,557 -8.55% Homer Glen 500 220 $ 447,598 34 4 115 $ 329,154 17.25 15.55 10.94% $ 346,979 -5.14% Homewood 430 128 $ 159,492 30 9 146 $ 135,482 8.30 6.10 36.09% $ 148,224 -8.60% Indian Head Park 531 13 $ 468,069 3 0 11 $ 510,736 11.14 15.27 -27.04% $ 503,367 1.46% Inverness 7167 118 $ 789,171 8 4 57 $ 646,095 20.52 17.84 15.05% $ 630,566 2.46% Itasca 143 56 $ 437,630 4 3 36 $ 292,713 15.63 10.84 44.19% $ 328,875 -11.00% Joliet 499 733 $ 146,346 144 69 738 $ 113,478 9.25 7.80 18.61% $ 125,619 -9.67% Justice 458 37 $ 189,594 5 5 33 $ 160,426 10.33 9.55 8.11% $ 148,876 7.76% Kenilworth 43 38 $ 1,907,945 7 4 35 $ 1,675,536 9.91 14.10 -29.69% $ 1,380,334 21.39% LaGrange Park 526 70 $ 337,714 17 3 86 $ 321,220 7.92 7.25 9.38% $ 346,835 -7.39% LaGrange 525 99 $ 551,611 27 1 123 $ 467,598 7.87 7.53 4.55% $ 428,933 9.01% Lake Bluff 44 110 $ 933,701 6 4 91 $ 635,032 13.07 12.58 3.87% $ 606,256 4.75% Lake Forest 45 326 $ 1,787,244 33 19 193 $ 1,124,137 15.97 16.90 -5.50% $ 1,014,022 10.86% Lake In The Hills 156 189 $ 253,050 45 6 216 $ 188,996 8.49 7.18 18.25% $ 215,671 -12.37% Lake Villa & Lindenhurst 46 271 $ 287,725 58 17 256 $ 218,785 9.82 9.85 -0.28% $ 229,577 -4.70% Data Source: MRED LLC (C) Copyright 2011, A. L. Wagner Appraisal Group, Inc. Midwest Real Estate Data, LLC (630) 416-6556 ~ www.WagnerAppraisal.com Page 3
  • 4. July 1, 2011 Statistics July 1, 2010 Statistics Under Under # of Sales 12 mo SP MLS Average Contract Contract Last Average MONTHS MONTHS Percent Average Percent Town Area Actives List Price (Ctg.) (Pend) 12 mos. Sale Price SUPPLY SUPPLY Change Sale Price Change Lansing 438 282 $ 123,927 20 31 196 $ 88,644 13.70 11.59 18.23% $ 102,731 -13.71% Lemont 439 199 $ 449,740 15 6 111 $ 403,279 18.09 14.22 27.25% $ 358,506 12.49% Libertyville & Green Oaks 48 305 $ 647,436 58 8 212 $ 468,931 13.17 12.08 8.94% $ 461,860 1.53% Lincolnshire 69 81 $ 665,021 14 6 80 $ 530,048 9.72 12.00 -19.00% $ 589,062 -10.02% Lincolnwood 645 107 $ 555,045 28 11 114 $ 390,886 8.39 9.31 -9.90% $ 386,036 1.26% Lisle 532 139 $ 378,110 24 2 98 $ 339,163 13.45 13.48 -0.19% $ 340,694 -0.45% Lockport 495 262 $ 250,320 41 8 190 $ 196,653 13.15 9.52 38.18% $ 198,788 -1.07% Lombard 148 258 $ 282,541 70 7 259 $ 235,128 9.21 10.14 -9.11% $ 246,711 -4.69% Lynwood 5411 66 $ 197,767 10 13 43 $ 140,038 12.00 10.57 13.51% $ 169,491 -17.38% Lyons 534 49 $ 158,188 5 3 53 $ 119,320 9.64 6.31 52.78% $ 127,695 -6.56% Markham 4426 104 $ 81,826 14 23 123 $ 44,598 7.80 6.30 23.81% $ 48,815 -8.64% Matteson 443 151 $ 193,671 30 23 156 $ 142,407 8.67 5.84 48.39% $ 158,112 -9.93% Maywood 153 134 $ 101,100 23 36 169 $ 63,269 7.05 6.80 3.74% $ 67,767 -6.64% Medinah 157 23 $ 392,634 2 0 22 $ 340,500 11.50 10.67 7.81% $ 278,831 22.12% Melrose Park 160 86 $ 186,374 19 8 99 $ 133,865 8.19 6.64 23.38% $ 127,801 4.74% McHenry 50 571 $ 255,322 115 25 385 $ 177,116 13.05 13.83 -5.60% $ 180,253 -1.74% Minooka 447 94 $ 309,737 24 10 85 $ 178,719 9.48 13.08 -27.54% $ 185,050 -3.42% Midlothian 445 96 $ 142,319 9 13 73 $ 105,334 12.13 7.44 62.95% $ 137,440 -23.36% Mokena 448 153 $ 421,397 20 7 107 $ 307,365 13.70 12.84 6.72% $ 318,303 -3.44% Monee 449 86 $ 356,468 12 7 63 $ 203,591 12.59 9.88 27.45% $ 214,969 -5.29% Montgomery 538 199 $ 178,805 64 15 209 $ 147,750 8.29 5.76 43.95% $ 161,997 -8.79% Morton Grove 53 133 $ 352,035 42 9 164 $ 267,999 7.42 7.05 5.26% $ 279,004 -3.94% Mt. Prospect 56 239 $ 336,922 35 9 268 $ 276,889 9.19 7.17 28.23% $ 295,549 -6.31% Mundelein 60 299 $ 301,207 61 15 232 $ 221,480 11.65 11.22 3.78% $ 248,098 -10.73% Naperville 540 927 $ 560,652 200 24 1,102 $ 436,313 8.39 7.87 6.58% $ 434,456 0.43% New Lenox 451 222 $ 319,717 30 4 161 $ 245,700 13.66 11.10 23.08% $ 261,417 -6.01% Niles 648 129 $ 344,656 20 8 143 $ 257,121 9.05 7.80 16.06% $ 282,739 -9.06% Norridge 634 95 $ 323,852 23 4 90 $ 252,620 9.74 6.59 47.89% $ 285,421 -11.49% North Aurora 542 125 $ 269,279 24 5 119 $ 232,180 10.14 8.15 24.29% $ 242,673 -4.32% North Chicago 64 81 $ 79,231 13 12 63 $ 43,108 11.05 9.10 21.33% $ 51,646 -16.53% North Riverside 547 51 $ 218,337 10 0 36 $ 189,708 13.30 8.71 52.82% $ 219,151 -13.44% Northbrook 62 236 $ 720,175 72 20 285 $ 500,596 7.51 9.30 -19.19% $ 525,209 -4.69% Northfield 7193 64 $ 861,305 6 3 48 $ 843,886 13.47 15.21 -11.44% $ 726,343 16.18% Northlake 164 67 $ 160,065 16 9 87 $ 110,749 7.18 4.78 50.06% $ 129,431 -14.43% Oak Brook 523 127 $ 1,543,205 2 2 63 $ 884,636 22.75 20.74 9.66% $ 1,069,920 -17.32% Oak Forest 452 153 $ 204,917 22 14 128 $ 169,153 11.20 6.26 78.75% $ 177,843 -4.89% Data Source: MRED LLC (C) Copyright 2011, A. L. Wagner Appraisal Group, Inc. Midwest Real Estate Data, LLC (630) 416-6556 ~ www.WagnerAppraisal.com Page 4
  • 5. July 1, 2011 Statistics July 1, 2010 Statistics Under Under # of Sales 12 mo SP MLS Average Contract Contract Last Average MONTHS MONTHS Percent Average Percent Town Area Actives List Price (Ctg.) (Pend) 12 mos. Sale Price SUPPLY SUPPLY Change Sale Price Change Oak Lawn 453 262 $ 221,413 54 26 263 $ 180,943 9.17 7.32 25.30% $ 203,356 -11.02% Oak Park 302 170 $ 493,847 51 19 295 $ 396,268 5.59 6.14 -8.95% $ 409,432 -3.22% Olympia Fields 461 53 $ 223,760 8 5 47 $ 196,172 10.60 9.71 9.21% $ 203,693 -3.69% Orland Park 462 308 $ 498,282 61 14 241 $ 343,865 11.70 9.91 18.07% $ 344,456 -0.17% Oswego 543 257 $ 277,970 95 10 266 $ 251,679 8.31 7.99 4.04% $ 253,608 -0.76% Palatine 67 302 $ 407,282 54 2 257 $ 331,070 11.58 9.77 18.47% $ 364,564 -9.19% Palos Heights 463 84 $ 449,382 9 5 78 $ 281,470 10.96 11.72 -6.55% $ 280,520 0.34% Palos Hills 465 61 $ 312,968 10 4 51 $ 204,294 11.26 7.52 49.75% $ 233,094 -12.36% Palos Park 464 75 $ 849,579 3 1 39 $ 365,379 20.93 15.87 31.88% $ 367,280 -0.52% Park Forest 466 209 $ 74,982 28 26 169 $ 50,426 11.25 6.63 69.59% $ 59,032 -14.58% Park Ridge 68 241 $ 531,079 62 14 256 $ 420,743 8.71 8.94 -2.55% $ 430,452 -2.26% Peotone 468 45 $ 285,625 5 2 25 $ 187,072 16.88 12.00 40.63% $ 172,576 8.40% Plainfield 544 662 $ 292,039 180 46 835 $ 225,792 7.49 7.62 -1.74% $ 231,601 -2.51% Posen 469 34 $ 103,196 4 4 47 $ 70,917 7.42 6.86 8.18% $ 91,665 -22.63% Prospect Heights 70 71 $ 463,644 8 4 46 $ 284,875 14.69 10.82 35.77% $ 352,904 -19.28% Richton Park 471 79 $ 138,697 17 9 100 $ 103,691 7.52 5.57 35.04% $ 110,171 -5.88% River Forest 305 82 $ 838,628 15 1 79 $ 629,825 10.36 11.76 -11.90% $ 675,574 -6.77% River Grove 171 52 $ 192,092 14 3 57 $ 160,782 8.43 6.45 30.70% $ 178,008 -9.68% Riverdale 627 87 $ 66,584 10 17 72 $ 29,569 10.55 6.79 55.32% $ 33,673 -12.19% Riverside 546 102 $ 479,494 10 2 51 $ 379,532 19.43 11.37 70.90% $ 422,029 -10.07% Rolling Meadows 8 94 $ 273,013 16 4 82 $ 229,651 11.06 6.33 74.61% $ 243,675 -5.76% Romeoville 494 205 $ 163,128 83 25 229 $ 141,563 7.30 4.37 66.93% $ 149,790 -5.49% Roselle & Keeneyville 172 102 $ 340,571 30 7 125 $ 252,682 7.56 10.04 -24.73% $ 272,017 -7.11% Round Lake 73 403 $ 139,822 130 33 466 $ 110,128 7.69 6.09 26.33% $ 122,350 -9.99% Sauk Village 414 67 $ 82,078 12 17 120 $ 39,669 5.40 5.07 6.46% $ 40,864 -2.92% Schaumburg 193 228 $ 350,840 52 11 217 $ 280,480 9.77 9.07 7.73% $ 314,248 -10.75% Shorewood 496 117 $ 270,137 21 11 123 $ 231,730 9.06 9.53 -4.92% $ 253,985 -8.76% Skokie 76 239 $ 344,878 69 17 303 $ 256,114 7.37 6.01 22.60% $ 296,616 -13.65% South Elgin 177 115 $ 283,542 33 9 145 $ 227,700 7.38 8.60 -14.20% $ 235,549 -3.33% South Holland 473 197 $ 130,409 31 25 219 $ 103,077 8.60 6.14 40.11% $ 99,831 3.25% St. Charles 174 535 $ 580,122 102 13 469 $ 370,929 10.99 11.66 -5.70% $ 379,439 -2.24% Steger 475 78 $ 144,654 13 6 53 $ 74,307 13.00 8.63 50.65% $ 91,933 -19.17% Stickney 404 67 $ 168,162 10 12 61 $ 129,146 9.69 5.74 68.78% $ 157,452 -17.98% Streamwood 107 210 $ 214,144 73 22 270 $ 156,152 6.90 7.24 -4.66% $ 175,664 -11.11% Sugar Grove 554 82 $ 343,334 17 1 84 $ 255,742 9.65 11.57 -16.60% $ 298,083 -14.20% Summit 501 54 $ 133,813 8 7 31 $ 86,181 14.09 9.76 44.29% $ 107,122 -19.55% Data Source: MRED LLC (C) Copyright 2011, A. L. Wagner Appraisal Group, Inc. Midwest Real Estate Data, LLC (630) 416-6556 ~ www.WagnerAppraisal.com Page 5
  • 6. July 1, 2011 Statistics July 1, 2010 Statistics Under Under # of Sales 12 mo SP MLS Average Contract Contract Last Average MONTHS MONTHS Percent Average Percent Town Area Actives List Price (Ctg.) (Pend) 12 mos. Sale Price SUPPLY SUPPLY Change Sale Price Change Thornton 476 13 $ 92,537 1 1 14 $ 70,230 9.75 8.87 9.93% $ 85,198 -17.57% Tinley Park 477 235 $ 283,453 30 14 196 $ 242,358 11.75 8.27 42.03% $ 256,238 -5.42% University Park 5466 42 $ 105,236 5 7 39 $ 83,412 9.88 5.48 80.29% $ 75,835 9.99% Vernon Hills 61 110 $ 454,230 26 7 105 $ 399,696 9.57 10.49 -8.81% $ 442,209 -9.61% Villa Park 186 138 $ 206,313 30 6 151 $ 184,401 8.86 7.30 21.39% $ 214,732 -14.13% Warrenville 555 67 $ 348,241 15 4 63 $ 232,694 9.80 8.70 12.66% $ 240,633 -3.30% Waukegan & Park City 85 369 $ 107,047 81 50 379 $ 75,029 8.68 6.25 39.03% $ 84,145 -10.83% Wayne 184 50 $ 852,031 3 1 14 $ 589,714 33.33 20.44 63.04% $ 533,120 10.62% West Chicago 185 223 $ 288,599 55 19 212 $ 171,921 9.36 10.73 -12.78% $ 205,179 -16.21% Westchester 154 147 $ 228,722 29 13 123 $ 175,319 10.69 8.52 25.41% $ 212,287 -17.41% Western Springs 558 92 $ 707,336 18 3 105 $ 526,629 8.76 9.47 -7.47% $ 549,578 -4.18% Westmont 559 120 $ 357,120 21 9 94 $ 281,542 11.61 8.59 35.15% $ 319,767 -11.95% Wheaton 187 364 $ 488,883 83 10 375 $ 365,043 9.33 9.89 -5.66% $ 366,725 -0.46% Wheeling 90 123 $ 220,327 44 4 107 $ 189,933 9.52 6.94 37.28% $ 205,764 -7.69% Willow Springs 480 47 $ 345,745 7 1 21 $ 247,567 19.45 28.00 -30.54% $ 417,417 -40.69% Willowbrook 516 67 $ 629,724 8 1 33 $ 424,420 19.14 11.38 68.23% $ 402,267 5.51% Wilmette 91 166 $ 910,845 34 30 245 $ 771,101 6.45 6.46 -0.23% $ 789,807 -2.37% Winfield 190 99 $ 370,570 16 4 61 $ 316,669 14.67 15.18 -3.36% $ 349,415 -9.37% Winnetka 93 182 $ 1,835,549 27 25 200 $ 1,362,806 8.67 10.23 -15.26% $ 1,309,557 4.07% Wood Dale 191 101 $ 289,620 20 5 77 $ 208,506 11.88 12.36 -3.89% $ 234,142 -10.95% Woodridge 517 136 $ 317,422 18 5 141 $ 263,601 9.95 8.71 14.25% $ 274,357 -3.92% Woodstock & Greenwood 98 306 $ 328,401 37 11 179 $ 185,236 16.18 13.77 17.44% $ 209,786 -11.70% Worth 482 59 $ 184,723 11 4 61 $ 145,293 9.32 7.38 26.15% $ 158,305 -8.22% Yorkville 560 182 $ 310,614 42 10 231 $ 221,276 7.72 10.17 -24.15% $ 231,349 -4.35% Zion 99 187 $ 128,121 44 27 199 $ 87,191 8.31 8.61 -3.46% $ 93,763 -7.01% City of CHICAGO 8000 5,782 $ 342,123 1,278 848 7,382 $ 223,877 7.30 6.62 10.15% $ 225,772 -0.84% TOTALS (all areas in report): 8099 37,887 $ 381,031 8,047 3,139 38,830 $ 265,192 9.09 8.31 9.34% $ 264,705 0.18% ALL AREAS ALL 42,543 $ 373,757 8,810 3,404 42,385 $ 260,321 9.35 8.57 9.07% $ 260,353 -0.01% (including areas not listed above) Under Contract/Pending sales included in Sales Calculation. A balanced market typically has a 3.00 to 4.00 months supply. Less than that is undersupplied, more is oversupplied. Average Sales Price changes may be exaggerated if significant amount of New Construction is reported in the MLS. Average Sales Price noted from previous year to current year should not be construed as Appreciation - it is percent of change of average sales price. Data Source: MRED LLC (C) Copyright 2011, A. L. Wagner Appraisal Group, Inc. Midwest Real Estate Data, LLC (630) 416-6556 ~ www.WagnerAppraisal.com Page 6