
Recomendados
Recomendados
Mais conteúdo relacionado
Semelhante a The Economics of Immigration A Story of Substitutes and Com.docx
Semelhante a The Economics of Immigration A Story of Substitutes and Com.docx (15)
Mais de cherry686017
Mais de cherry686017 (20)
Último
Último (20)
The Economics of Immigration A Story of Substitutes and Com.docx
- 1. The Economics of Immigration: A Story of Substitutes and Complements May 2014 An informative and accessible economic essay with a classroom application. Includes the full version of the Page One Economics Newsletter, plus questions for students and an answer key for classroom use. Common Core Standards (see page 12) Scott A. Wolla Economic Education Group of the Federal Reserve Bank of St. Louis © 2014, Federal Reserve Bank of St. Louis. www.stlouisfed.org/education Permission is granted to reprint or photocopy this lesson in its entirety for educational purposes, so long as this copyright notice is included on all copies. PAGE ONE Economics CLASSROOM EDITIONthe back story on front page economics http://www.stlouisfed.org/education PAGE ONE Economics
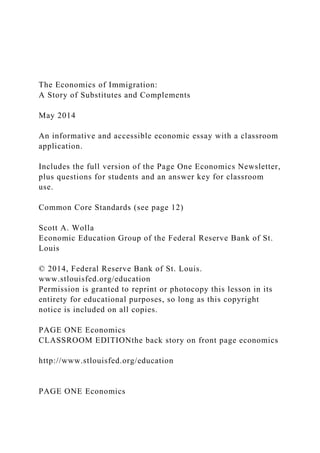
- 2. America is a nation of immigrants. Currently, immigrants make up about 13 percent of the overall population, which means about 40 million people living in the United States are foreign born.1 Indeed, nearly all Americans have an immigration story in their family history. Yet, despite their history and a culture of immigration, Americans have mixed feelings about whether the country should keep its welcome mat out on the doorstep. A 2014 Gallup poll reports 72 percent of Americans believe immigration is a good thing, but 36 percent would like to see the level of immigration decrease.2 Economists, who focus on economic costs and benefits, are generally more supportive of immigration than the general public. The Economics of Immigration: A Story of Substitutes and Complements Scott A. Wolla, Senior Economic Education Specialist “Give me your tired, your poor, your huddled masses yearning to breathe free.”—Emma Lazarus NEWSLETTERthe back story on front page economics May � 2014 NOTE: The share of the labor force that is foreign born has increased over time. Although the share dropped during the most recent recession (15.1 percent in February 2009), the share had increased to 16.3 percent as of March 2014. The gray bar indicates the 2007- 09 recession as determined by the National Bureau of Economic Research.
- 3. SOURCE: FRED (http://research.stlouisfed.org/fred2/graph/?g=wrF). Percentage of U.S. Labor Force That Is Foreign Born 1 http://research.stlouisfed.org/fred2/graph/?g=wrF Federal Reserve Bank of St. Louis 2PAGE ONE Economics NEWSLETTER The Economics of Immigration In many ways, the arguments about the economics of immigration are similar to those about the economics of international trade. Economists typically reason that voluntary trade is mutu- ally beneficial—if it were not, the trade partners would not pursue trade. Economists therefore generally support free and open trade of goods and services across national borders. In a similar way, economists think of immigration as mutually beneficial “trade” between immigrants and their employers. And as with trade, both the immigrant workers and their employers generally benefit. Not surprisingly, economists generally support free and open immigration. Immigration increases labor resources, which increase the productive capacity of the econ- omy. Currently, foreign-born workers make up 16.3 percent of the labor force (see the chart). Stated differently, the increase in labor resources increases the economy’s ability to produce
- 4. goods and services. But how does immigration affect the average American? Once the costs and benefits are weighed, economists estimate the annual economic gains to the native-born population to be between 0.1 and 0.3 percent of gross domestic product,3 which might not seem like a sizable gain but is significant when extended over a lifetime. Some of these benefits take the form of lower labor costs for employers, lower prices for consumers, and increased employ- ment opportunities for some workers. However, while the economy in general might be better off, there are negative externalities, or cases in which third parties are negatively affected. In the case of immigration, the concerns about negative effects are usually expressed by native-born workers and taxpayers. These concerns are explained below. Immigrant Workers: Substitutes or Complements? One of the most important distinctions between workers is their skill level: Some workers are more skilled than others. This is true of both native-born and immigrant workers. But in addition to having skills that differentiate immigrant workers from each other, the skills of immigrant workers also differ from those of the native-born labor force. Immigrant workers are overrepresented at the extremes of the skills spectrum— there are many at the low-skilled end of the spectrum and many at the high-skilled end. On the low-skilled end, 27 percent of foreign-born workers in 2013 had less than a high school diploma compared with 7 percent of the native-born population.4 At the high-skilled end, about 40 percent of U.S. PhDs and engi-
- 5. neers are foreign born.5 Immigrant workers can either be substitutes for native-born workers or complements to them. When immigrant workers are substitutes for native-born workers, they compete for simi- lar jobs. Using a simple supply and demand model, an influx of substitutable workers constitutes an increase in the supply of labor, causing wages to fall for workers with similar skills. Because many immigrants are low-skilled workers, economic studies have found that an influx of immi- grants depresses wages for low-skilled native-born workers in the short run.6 And, because many immigrants are also high-skilled, a similar substitution effect occurs for some high-skilled workers. However, when workers are complementary, an increase in immigrant labor can increase job opportunities and wages for native-born workers. So, the low-skilled immigrant labor reduces the cost of production and increases the output of those goods; this greater output increases the demand for other, higher-skilled workers. For example, consider that immigrant workers account for 22 percent of the construction workforce. They tend to pursue jobs in the construc- tion industry that require less training and education but are areas where the industry has its 2 Federal Reserve Bank of St. Louis 3
- 6. largest labor shortages—such as painters, drywall installers, and construction laborers.7 This supply of immigrant labor has decreased the cost and presumably increased the number of homes produced and sold over time. The increase in housing construction has increased the demand for higher-skilled construction workers such as contractors, electricians, and plumbers and increased the demand for manufactured goods such as air conditioners and appliances. In some cases, immigrant labor has complemented native-born laborers by allowing them to move into the labor force. For example, immigration has provided families with access to low-cost child care. This has allowed more native-born women to enter the workforce.8 In the modern economy, high-skilled immigrants complement high-skilled native-born workers by filling positions in the fast-growing science, technology, engineering, and math (STEM) fields; they make up about 45 percent of medical scientists and 37 percent of computer programmers.9 These workers fill positions in areas where native-born labor is relatively scarce and positions that are often complementary to other STEM jobs. For example, Bill Gates has stated in congressional testimony that Microsoft hires four additional employees to support each high-skilled worker hired on a temporary work (H-1B) visa.10 In addition, high-skilled immigrants appear to be more innovative than their native-born counterparts, which can boost productivity and economic growth over time. Highly educated immigrants receive patents at
- 7. twice the rate of highly educated native-born workers. Immigrants also tend to be more entre- preneurial; research indicates they are about 30 percent more likely to start a business than non- immigrants.11 In fact, immigrants founded 25 percent of the U.S. high-tech startups between 1995 and 2005.12 The Effects of Immigrant Workers on the U.S. Federal Budget Low-skilled and high-skilled immigrants also differ in how they influence the U.S. federal budget. The United States has a progressive income tax, which means that those with higher incomes pay a greater percentage of their incomes in taxes. Low-skilled workers typically earn low wages and as such do not pay much in taxes, but they benefit from taxpayer-supported edu- cation services, medical services, income subsidies, and other means-tested (asset- or income- dependent) benefit programs. This results in low-skilled (low- income) immigrant workers creating a net fiscal drain. Such programs function as a taxpayer subsidy to firms that hire low- skilled workers and their customers. The firms, their customers (through lower prices), and the immigrants are better off, while taxpayers bear the cost of providing the benefit programs. High- skilled immigrant workers are likely to earn higher incomes— and therefore pay higher income taxes—and qualify for fewer means-tested benefits. As a result, high-skilled immigrants are more likely to generate a fiscal surplus. Their situation is not unlike that of their native-born counterparts with comparable skills.
- 8. What About Illegal Immigration? In 2010, slightly more than 1 million immigrants were admitted to the United States legally, and the net inflow of illegal immigrants was at least 500,000.13 Economists who study immigra- tion often do not differentiate between legal and illegal immigrants. However, noneconomists draw a sharp distinction between these two groups: Most are supportive of legal immigrants but very critical of illegal immigrants. The 2014 Gallup poll mentioned earlier also reported 88 percent of Americans worry at least a little about illegal immigration, and 93 percent report that controlling the U.S. borders to halt the flow of illegal immigrants into the country is at least moderately important.14 Despite these perceptions, recent research suggests that policies PAGE ONE Economics NEWSLETTER 3 that reduce immigration (legal and illegal) will also reduce job creation and the benefits that would have accrued to native-born workers. This research argues that a policy of deportation would have a negative effect on the employment opportunities of native-born workers, whereas a policy of legalization would increase job opportunities.15 Conclusion Immigration creates economic winners and losers. Winners
- 9. include (i) employers who bene- fit from lower labor costs, (ii) consumers who benefit from lower prices for goods and services, and (iii) complementary workers who benefit from increased job opportunities and higher wages. The losers are (i) substitutable workers who compete for the same jobs as immigrant workers (in both low-skilled and high-skilled professions) and earn depressed wages as a result and (ii) tax- payers who pay higher taxes to support means-tested benefit programs. There are many non - economic factors involved in the issue of immigration; but, in terms of simply weighing the economic costs and benefits of admitting additional workers, immigration is a net benefit. � NOTES 1 See Congressional Budget Office. “A Description of the Immigration Population—2013 Update.” May 8, 2013; http://www.cbo.gov/publication/44134. 2 See Gallup. “Immigration,” pp. 1-2; http://www.gallup.com/poll/1660/immigration.aspx#1. 3 See Orrenius, Pia and Zavodny, Madeline. “From Brawn to Brains: How Immigration Works for America.” Federal Reserve Bank of Dallas 2010 Annual Report, p. 10; http://www.dallasfed.org/assets/documents/fed/annual/2010/ar1 0.pdf. 4 See note 1. 5 See Mankiw, N. Gregory. Principles of Economics. Sixth Edition. Mason, OH: South-Western Cengage Learning, 2011, p.
- 10. 387. 6 Economists agree that while immigrant labor influences wages in the short run, in the long run, once adjustments to the capital stock are accounted for, the returns to capital and labor revert to their initial levels. Much low-skilled work would likely be done offshore if immigrant labor were not available. When immigrant labor is available, transportation costs make offshore options unattractive. Recent research suggests that immigrant labor is a more suitable substitute for offshore labor than native labor. See Ottaviano, Gianmarco I.; Peri, Giovanni and Wright, Greg C. “Immigration, Offshoring and American Jobs.” CEP Discussion Paper No 1147, Centre for Economic Performance, May 2012; http://cep.lse.ac.uk/pubs/download/dp1147.pdf. 7 See National Association of Home Builders. “Immigrant Workers in the Construction Labor Force.” April 1, 2013; http://www.nahb.org/generic.aspx?sectionID=734&genericConte ntID=200529&channelID=311. 8 See Furtado, Delia and Hock, Heinrich. “Immigrant Labor, Child Care Services, and the Work Fertility Trade-Off in the United States.” IZA Discussion Paper No. 3506, Institute for the Study of Labor (IZA), May 2008; http://ftp.iza.org/dp3506.pdf. 9 See Orrenius, Pia and Zavodny, Madeline. “From Brawn to Brains: How Immigration Works for America.” Federal Reserve Bank of Dallas 2010 Annual Report, p. 8; http://www.dallasfed.org/assets/documents/fed/annual/2010/ar1 0.pdf. 10 H1-B visas are nonimmigrant visas granted to U.S. employers to temporarily employ foreign workers in specialty
- 11. occupa- tions. See Kerr, Sari Pekkala; Kerr, William R. and Lincoln, William F. “Skilled Immigration and the Employment Structures of U.S. Firms.” NBER Working Paper No. 19658. National Bureau of Economic Research, November 2013; http://www.nber.org/papers/w19658. 11 See Fairlee, Robert W. “Estimating the Contribution of Immigrant Business Owners to the U.S. Economy.” Small Business Administration, Office of Advocacy Report No. 334, November 2008; http://archive.sba.gov/advo/research/rs334tot.pdf. 12 See Wadhwa, Vivek; Saxenian, AnnaLee; Rissing, Ben A. and Gereffi, Gary. “America’s New Immigrant Entrepreneurs: Part I.” Duke Science, Technology & Innovation Paper No. 23, January 2007. 13 See Borjas, George J. Labor Economics. New York: McGraw Hill, 2013. The number of illegal immigrants varies from year to year and is very sensitive to changes in economic conditions between the United States and the source countries. 14 See Gallup. “Immigration,” p. 1; http://www.gallup.com/poll/1660/immigration.aspx#1. 15 See Chassamboulli, Andri and Peri, Giovanni. “The Labor Market Effects of Reducing Undocumented Immigrants.” NBER Working Paper No. 19932. National Bureau of Economic Research, February 2014; http://www.nber.org/papers/w19932. Federal Reserve Bank of St. Louis 4PAGE ONE Economics NEWSLETTER
- 12. 4 http://www.nber.org/papers/w19932 http://www.gallup.com/poll/1660/immigration.aspx#1 http://archive.sba.gov/advo/research/rs334tot.pdf http://www.nber.org/papers/w19658 http://www.dallasfed.org/assets/documents/fed/annual/2010/ar1 0.pdf http://ftp.iza.org/dp3506.pdf http://www.nahb.org/generic.aspx?sectionID=734&genericConte ntID=200529&channelID=311 http://cep.lse.ac.uk/pubs/download/dp1147.pdf http://www.dallasfed.org/assets/documents/fed/annual/2010/ar1 0.pdf http://www.gallup.com/poll/1660/immigration.aspx#1 http://www.cbo.gov/publication/44134 GLOSSARY Complement (resources): Productive inputs that are used jointly with other inputs in the production process. Means-tested: Programs in which eligibility depends on the level of one’s current income or assets. Negative externality: A negative side effect that results when the production or consumption of a good or service affects the welfare of people who are not the parties directly involved in a market exchange. Substitute (resource): Productive inputs that can be used in place of each other. Page One Economics Newsletter from the Federal Reserve Bank of St. Louis provides an informative, accessible economic essay
- 13. written by our economic education specialists, who also write the accompanying classroom edition and lesson plan. The newsletter and lesson plans are published 5 times per year: January, March, May, September, and November. Please visit our website and archives http://research.stlouisfed.org/pageone-economics/ for more information and resources. Views expressed do not necessarily reflect official positions of the Federal Reserve System. Federal Reserve Bank of St. Louis 5PAGE ONE Economics NEWSLETTER 5 http://research.stlouisfed.org/pageone-economics/ Name___________________________________ Period_______ Federal Reserve Bank of St. Louis Page One Economics Newsletter: “The Economics of Immigration: A Story of Substitutes and Complements” After reading the article, answer the following questions. 1. How does the skill level of immigrant workers differ from that of native-born workers? 2. How does an increase in immigrant workers with substitutable skills influence wages of native-
- 14. born workers? 3. How does an increase in immigrant workers with complementary skills influence wages of native- born workers? 4. How do immigrant workers influence the U.S. federal budget? 5. Overall, is immigration a positive or negative for the economy? 6 Teacher’s Guide Federal Reserve Bank of St. Louis Page One Economics Newsletter: “The Economics of Immigration: A Story of Substitutes and Complements” After reading the article, answer the following questions. 1. How does the skill level of immigrant workers differ from that of native-born workers? Immigrant workers are overrepresented at the extremes of the skills spectrum—there are many at the low- skilled end of the spectrum and many at the high-skilled end. On the low-skilled end, 27 percent of foreign- born workers in 2013 had less than a high school diploma compared with 7 percent of the native-born population. At the high-skilled end, about 40 percent of U.S. PhDs and engineers are foreign born.
- 15. 2. How does an increase in immigrant workers with substitutable skills influence wages of native- born workers? An influx of substitutable workers constitutes an increase in the supply of labor, causing wages to fall for workers with similar skills. Because many immigrants are low- skilled, economic studies have found that an influx of immigrants depresses wages for low-skilled native- born workers in the short run. 3. How does an increase in immigrant workers with complementary skills influence wages of native- born workers? Immigrant labor can increase job opportunities and wages for native-born workers with complementary skills. For example, the availability of lower-skilled construction workers (such as drywall installers) can increase the demand for higher-skilled workers (such as electricians) in that industry and related industries (such as air conditioner manufacturing). 4. How do immigrant workers influence the U.S. federal budget? Immigrants influence the U.S. federal budget in the same way as their native-born counterparts with com- parable skills. Low-skilled immigrant workers typically earn low wages and as such do not pay much in taxes, but they benefit from taxpayer-supported benefit programs. This results in low-skilled (low-income) immi- grant workers creating a net fiscal drain. High-skilled immigrant workers are likely to earn higher incomes— and therefore pay higher income taxes—and qualify for fewer benefits. As a result, high-skilled immigrants are more likely to generate a net fiscal surplus. 5. Overall, is immigration a positive or negative for the
- 16. economy? Immigration creates winners and losers, but in economic terms it is a net benefit. Economists estimate the annual economic gains to the native-born population to be between 0.1 and 0.3 percent of gross domestic product. 7 For Further Discussion Review the following or distribute the handout to your students; then lead a classroom discussion on the production possibilities frontier. The production possibilities frontier (PPF) is an economic model that shows all possible combinations of two goods that an economy can produce in a certain time period. The production level is based on the economy’s current level of economic resources, which are land, labor, capital, and the current level of technology—that is, how we combine resources to produce goods and services. More specifically, the curved line represents the frontier—the limits of what this economy can produce with its current resources. The graph below shows the production possibilities for goods and services in this economy. So, choosing a production level that lies on the frontier (such as level A or B) indicates that the economy is using all of its available resources. This economy could produce at level A, which means it would produce 11 units of goods and 5 units of services. Alternately, if it preferred more services, it could produce at level B: 5 goods and 11 services. However, note that
- 17. to produce more services, it had to give up some production of goods. More specifically, to increase production of services by 6 units (from 5 units to 11 units), it had to give up 6 units of goods (from 11 units to 5 units). Why? To increase services, some resources had to be shifted from goods production to services production. This scenario illustrates two very important economic concepts. First, the economy illustrated on the PPF would likely prefer to produce goods and services at a level beyond the frontier, but because it has limited resources, it cannot produce beyond the frontier. This demonstrates the concept of scarcity, which is the condition that exists because there are not enough resources to produce everyone’s wants. Second, because it has limited resources, choosing to produce more of one thing results in less production of something else. That is, the econ- omy gave up some goods to gain additional services. This demonstrates the concept of a trade-off, which is giving up something in order to gain something else. What about level C in the graph? This economy cannot produce at level C because it lies outside the frontier. In economic terms, this means the economy currently does not have the resources necessary to produce at level C. However, what if a new technology were invented that dramatically increased the productivity of labor? The resulting increase in production possibilities would shift the frontier line to the right (see second graph). Notice that level C is now potentially available to this economy. 8 The PPF can also shift to the left, indicating a loss of economic
- 18. resources. A leftward shift of the production possibilities curve reduces the production possibilities of the economy—fewer goods and services produced. Use the concepts you learned about the PPF to answer the following questions. 1. How do you think the development of technologies such as faster computers, the Internet, and cell phones has shifted the PPF in recent years? Each of these technological changes has increased labor productivity. The increase in labor productivity has shifted the PPF further right than if those technologies had not been developed. 2. Immigrant labor currently makes up about 16 percent of the U.S. labor force. What if more immigrants are added to the labor force? What does that mean in terms of total production of goods and services? The addition of labor resources would shift the PPF outward, to the right. The rightward shift indicates an economy that has the potential to produce a greater quantity of goods and services. Note: This assumes no other changes in the labor force or technological changes that might influence the productivity of labor. Glossary Production possibilities frontier (PPF): A graphic representation of output combinations that can be produced given an economy’s available resources and technology. Scarcity: The condition that exists because there are not enough resources to produce everyone’s wants.
- 19. Trade-off: Giving up part of one thing in order to gain part of something else. 9 Handout Name___________________________________ Period_______ The production possibilities frontier (PPF) is an economic model that shows all possible combinations of two goods that an economy can produce in a certain time period. The production level is based on the economy’s current level of economic resources, which are land, labor, capital, and the current level of technology—that is, how we combine resources to produce goods and services. More specifically, the curved line represents the frontier—the limits of what this economy can produce with its current resources. The graph below shows the production possibilities for goods and services in this economy. So, choosing a production level that lies on the frontier (such as level A or B) indicates that the economy is using all of its available resources. This economy could produce at level A, which means it would produce 11 units of goods and 5 units of services. Alternately, if it preferred more services, it could produce at level B: 5 goods and 11 services. However, note that to produce more services, it had to give up some production of goods. More specifically, to increase production of services by 6 units (from 5 units to 11 units), it had to give up 6 units of goods (from 11 units to 5 units). Why?
- 20. To increase services, some resources had to be shifted from goods production to services production. This scenario illustrates two very important economic concepts. First, the economy illustrated on the PPF would likely prefer to produce goods and services at a level beyond the frontier, but because it has limited resources, it cannot produce beyond the frontier. This demonstrates the concept of scarcity, which is the condition that exists because there are not enough resources to produce everyone’s wants. Second, because it has limited resources, choosing to produce more of one thing results in less production of something else. That is, the econ- omy gave up some goods to gain additional services. This demonstrates the concept of a trade-off, which is giving up something in order to gain something else. What about level C in the graph? This economy cannot produce at level C because it lies outside the frontier. In economic terms, this means the economy currently does not have the resources necessary to produce at level C. However, what if a new technology were invented that dramatically increased the productivity of labor? The resulting increase in production possibilities would shift the frontier line to the right (see second graph). No- tice that level C is now potentially available to this economy. 10 The PPF can also shift to the left, indicating a loss of economic resources. A leftward shift of the production possibilities curve reduces the production possibilities of the economy—fewer goods and services produced.
- 21. Use the concepts you learned about the PPF to answer the following questions. 1. How do you think the development of technologies such as faster computers, the Internet, and cell phones has shifted the PPF in recent years? 2. Immigrant labor currently makes up about 16 percent of the U.S. labor force. What if more immigrants are added to the labor force? What does that mean in terms of total production of goods and services? Glossary Production possibilities frontier (PPF): A graphic representation of output combinations that can be produced given an economy’s available resources and technology. Scarcity: The condition that exists because there are not enough resources to produce everyone’s wants. Trade-off: Giving up part of one thing in order to gain part of something else. 11 Common Core State Standards Grades 6-12 Literacy in History/Social Studies and Technical Subjects • Key Ideas and Details RH.11-12.1: Cite specific textual evidence to support analysis of primary and secondary sources,
- 22. connecting insights gained from specific details to an understanding of the text as a whole. RH.11-12.2: Determine the central ideas or information of a primary or secondary source; provide an accurate summary that makes clear the relationships among the key details and ideas. • Craft and Structure RH.11-12.4: Determine the meaning of words and phrases as they are used in a text, including analyzing how an author uses and refines the meaning of a key term over the course of a text (e.g., how Madison defines faction in Federalist No. 10). 12