Stock Research Report for Yamana Gold Inc MMM as of 11/17/11 - Chaikin Power Tools
•
1 gostou•261 visualizações

To order a Chaikin Power Gauge stock research report for MMM go to http://www.chaikinpowertools.com/reports

Recomendados
Recomendados
Mais conteúdo relacionado
Último
Último (20)
Destaque
Destaque (20)
Stock Research Report for Yamana Gold Inc MMM as of 11/17/11 - Chaikin Power Tools
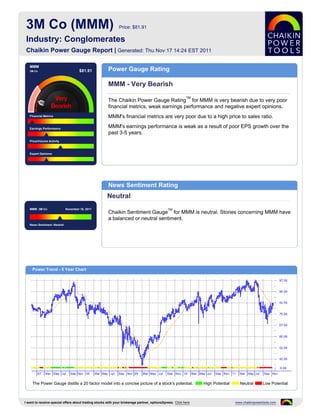
- 1. 3M Co (MMM) Price: $81.91 Industry: Conglomerates Chaikin Power Gauge Report | Generated: Thu Nov 17 14:24 EST 2011 MMM 3M Co $81.91 Power Gauge Rating MMM - Very Bearish TM The Chaikin Power Gauge Rating for MMM is very bearish due to very poor financial metrics, weak earnings performance and negative expert opinions. Financial Metrics MMM's financial metrics are very poor due to a high price to sales ratio. Earnings Performance MMM's earnings performance is weak as a result of poor EPS growth over the past 3-5 years. Price/Volume Activity Expert Opinions News Sentiment Rating Neutral MMM 3M Co November 16, 2011 TM Chaikin Sentiment Gauge for MMM is neutral. Stories concerning MMM have a balanced or neutral sentiment. News Sentiment :Neutral Power Trend - 5 Year Chart The Power Gauge distills a 20 factor model into a concise picture of a stock's potential. High Potential Neutral Low Potential I want to receive special offers about trading stocks with your brokerage partner, optionsXpress. Click here www.chaikinpowertools.com
- 2. Financials & Earnings Financial Metrics Financial Metrics Rating LT Debt/Equity Ratio Very Bearish Price to Book Value MMM's financial metrics are very poor. The company has relatively low revenue per share and may be overvalued. Return on Equity The rank is based on a high price to book value ratio, high return on equity, high price to sales ratio and relatively low cash flow. Price to Sales Ratio Business Value Assets and Liabilities Valuation Returns Ratio TTM Ratio TTM Ratio TTM Current Ratio 2.22 Price/Book 3.34 Return on Invest 19.8% LT Debt/Equity 0.26 Price/Sales 2.18 Return on Equity 25.0% Earnings Performance Earnings Performance Rating Earnings Growth Bearish Earnings Surprise MMM's earnings performance has been weak. The company has a history of weak earnings growth and has not met analysts' earnings estimates. Earnings Trend The rank is based on poor EPS growth over the past 3-5 years, worse than expected earnings in recent quarters, a relatively poor trend in earnings this year Projected P/E Ratio and consistent earnings over the past 5 years. Earnings Consistency 5 Year Revenue and Earnings Growth EPS Estimates 12/06 12/07 12/08 12/09 12/10 Factor Actual EPS Prev EST EPS Current Change Revenue(M) 22,923.00 24,462.00 25,269.00 23,123.00 26,662.00 Quarterly EPS $1.30 $1.31 +0.01 Rev % Growth 8.30% 6.71% 3.30% -8.49% 15.31% Yearly EPS $5.72 $5.93 +0.21 EPS $5.15 $5.70 $4.95 $4.56 $5.72 Factor Actual EPS Growth Est EPS Growth Change EPS % Growth 25.00% 10.68% -13.16% -7.88% 25.44% 3-5 year EPS 5.02% 12.30% +7.28 EPS Surprise EPS Quarterly Results Estimate Actual Difference % Difference FY Qtr 1 Qtr 2 Qtr 3 Qtr 4 Total Latest Qtr $1.61 $1.52 $-0.09 -5.59 12/09 $0.74 $1.12 $1.36 $1.32 $4.54 1 Qtr Ago $1.60 $1.60 $0.00 0.00 12/10 $1.31 $1.57 $1.55 $1.30 $5.73 2 Qtr Ago $1.43 $1.49 $0.06 4.20 12/11 $1.52 $1.63 $1.54 - - 3 Qtr Ago $1.27 $1.27 $0.00 0.00 Fiscal Year End Month is December. I want to receive special offers about trading stocks with your brokerage partner, optionsXpress. Click here www.chaikinpowertools.com
- 3. Price Trend & Expert Opinions Price/Volume Activity Price/Volume Activity Rating Relative Strength vs Market Neutral Chaikin Money Flow Price and volume activity for MMM is neutral. MMM has outperformed the S&P 500 over 26 weeks and has underperformed the S&P 500 over 26 weeks. Price Trend Price Trend ROC Volume Trend Relative Strength vs S&P500 Index Chaikin Money Flow Chart shows whether MMM is performing better or worse than the market. Chaikin Money Flow analyzes supply and demand for a company's stock. Price Activity Price Activity Volume Activity Factor Value Factor Value Factor Value 52 Week High 97.97 % Change Price - 4 Weeks 5.37% Average Volume 20 Days 5,113,955 52 Week Low 70.93 % Change Price - 24 Weeks -10.47% Average Volume 90 Days 5,474,743 % Change YTD Rel S&P 500 -5.12% % Change Price - 4 Wks Rel to S&P 3.06% Chaikin Money Flow Persistency 48% % Change Price - 24 Wks Rel to S&P -4.85% Expert Opinions Expert Opinions Earnings Estimate Revisions Bearish Short Interest Expert opinions about MMM are negative. Analysts are lowering their EPS estimates for MMM and insiders are not net buyers of MMM's stock. Insider Activity The rank for MMM is based on analysts revising earnings estimates downward, a low short interest ratio, insiders not purchasing significant amounts of stock and Analyst Opinions optimistic analyst opinions. Relative Strength vs Industry Earnings Estimate Revisions Analyst Recommendations EPS Estimates Revision Summary Current 7 Days Ago % Change Factor Value Last Week Last 4 Weeks Current Qtr 1.31 1.32 -0.76% Mean this Week Buy Up Down Up Down Next Qtr 1.51 1.51 0.00% Mean Last Week Buy Curr Qtr 0 1 0 10 Curr Yr 0 0 0 15 Current 30 Days Ago % Change Change 0.00 Next Qtr 0 0 0 2 Current FY 5.93 6.19 -0.26 Mean 5 Weeks Ago Strong Buy Next Yr 0 1 0 11 I want to receive special offers about trading stocks with your brokerage partner, optionsXpress. Click here www.chaikinpowertools.com
- 4. The Company & Its Competitors MMM's Competitors in Conglomerates News Headlines for MMM Company Power Historic EPS Projected EPS Profit Margin PEG PE Revenue(M) 3M views $1.3 million penalty as a clear win - Gauge growth growth Nov 8, 2011 MMM 5.02% 12.30% 14.56% 1.12 13.92 26,662 3M: Mississippi River cleanup is paying off - Nov GE 0.45% 12.60% 9.92% 0.94 12.18 150,211 4, 2011 3M lowers year view on slowing growth - Oct 25, HIT 7.68% 4.75% 1.38% 1.81 16.29 112,239 2011 UTX 5.29% 11.92% 8.35% 1.19 14.32 54,326 3M Launches Website - Oct 10, 2011 HON 4.38% 13.80% 7.56% 0.96 15.45 33,370 3M Completes Acquisition of Do-It-Yourself and Professional Business of GPI Group - Oct 3, 2011 Company Details Company Profile 3M CO 3M Company is a diversified technology company with leading positions in consumer and 3M CENTER BLDG. 220-11W-02 office; display and graphics; electronics and telecommunications; health care; industrial; ST PAUL, MN 55144-1000 safety, security and protection services; transportation and other businesses. They are an USA integrated enterprise characterized by substantial intercompany cooperation in research, Phone: 6517332204 manufacturing and marketing of products. Fax: 651-737-7117 Website: http://http://www.3m.com Full Time Employees: 80,057 Sector: Multi-Sector Conglomerates Power Gauge Ratings are created using a relative ranking system that assigns a rank of 0 to 100 (100 being the highest) to each stock in the universe. Rank is calculated by evaluating each of the stocks factors and combining them into a single number using a weighting formula. A stock's rank ranges from 100-0, where 100 is the strongest, and a rank of 95 indicates the stock is better than 95% of the stocks in the universe. Chaikin Stock Research(CSR) is not registered as a securities broker dealer or investment advisor with either the U.S. Securities and Exchange Commission or with any state securities regulatory authority. CSR is not responsible for trades executed by users of this research report, our web site or mobile app based on the information included herein. The information presented in this report does not represent a recommendation to buy or sell stocks or any financial instrument nor is it intended as an endorsement of any security or investment. The information in this report is generic by nature and is not personalized to the specific financial situation of any individual. The user bears complete responsibility for their own investment research and should seek the advice of a qualified investment professional before making any investment decisions. Copyright (c) 1978-(Present) by ZACKS Investment Research, Inc ("ZACKS"). The information, data, analyses and opinions contained herein (1) includes the confidential and proprietary information of ZACKS, (2) may not be copied or redistributed, for any purpose, (3) does not constitute investment advice offered by ZACKS, (4) are provided solely for informational purposes, and (5) are not warranted or represented to be correct, complete, accurate or timely. ZACKS shall not be responsible for investment decisions, damages or other losses resulting from, or related to, use of this information, data, analyses or opinions. Past performance is no guarantee of future performance. ZACKS is not affiliated with Chaikin Power Tools. This report from Chaikin Power Tools is for informational purposes only and is not a recommendation to buy or sell securities. LM 2.3 DS 3.0 LS 2.1 Data Provided by ZACKS Investment Research, Inc., www.zacks.com Special offers to trade stocks from optionsXpress: www.chaikinpowertools.com