Stock Research Report for USB as of 9/8/11 - Chaikin Power Tools
•
1 gostou•156 visualizações

To order a free Chaikin Power Gauge stock research report for USB go to http://www.chaikinpowertools.com/reports

Recomendados
Recomendados
Mais conteúdo relacionado
Mais de Dan Oconnor
Mais de Dan Oconnor (6)
Último
Último (20)
Stock Research Report for USB as of 9/8/11 - Chaikin Power Tools
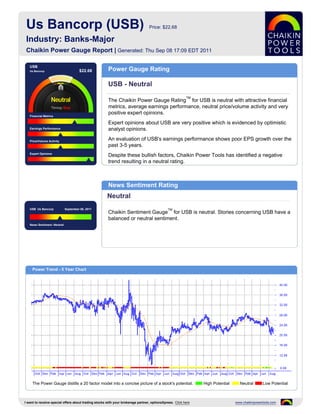
- 1. Us Bancorp (USB) Price: $22.68 Industry: Banks-Major Chaikin Power Gauge Report | Generated: Thu Sep 08 17:09 EDT 2011 USB Us Bancorp $22.68 Power Gauge Rating USB - Neutral TM The Chaikin Power Gauge Rating for USB is neutral with attractive financial metrics, average earnings performance, neutral price/volume activity and very positive expert opinions. Financial Metrics Expert opinions about USB are very positive which is evidenced by optimistic Earnings Performance analyst opinions. Price/Volume Activity An evaluation of USB's earnings performance shows poor EPS growth over the past 3-5 years. Expert Opinions Despite these bullish factors, Chaikin Power Tools has identified a negative trend resulting in a neutral rating. News Sentiment Rating Neutral USB Us Bancorp September 08, 2011 TM Chaikin Sentiment Gauge for USB is neutral. Stories concerning USB have a balanced or neutral sentiment. News Sentiment :Neutral Power Trend - 5 Year Chart The Power Gauge distills a 20 factor model into a concise picture of a stock's potential. High Potential Neutral Low Potential I want to receive special offers about trading stocks with your brokerage partner, optionsXpress. Click here www.chaikinpowertools.com
- 2. Financials & Earnings Financial Metrics Financial Metrics Rating LT Debt/Equity Ratio Bullish Price to Book Value USB's financial metrics are very good. The company generates high free cash flow relative to market capitalization and yields a high return on shareholder's Return on Equity equity. The rank is based on a high return on equity and relatively high cash flow. Price to Sales Ratio Business Value Assets and Liabilities Valuation Returns Ratio TTM Ratio TTM Ratio TTM Current Ratio 0.87 Price/Book 1.42 Return on Invest 6.5% LT Debt/Equity 1.11 Price/Sales 2.12 Return on Equity 14.0% Earnings Performance Earnings Performance Rating Earnings Growth Neutral Earnings Surprise USB's earnings performance has been neutral. The company has outperformed analysts' earnings estimates and has a history of weak earnings growth. Earnings Trend The rank is based on poor EPS growth over the past 3-5 years, better than expected earnings in recent quarters and an upward trend in earnings this year. Projected P/E Ratio Earnings Consistency 5 Year Revenue and Earnings Growth EPS Estimates 12/06 12/07 12/08 12/09 12/10 Factor Actual EPS Prev EST EPS Current Change Revenue(M) 19,109.00 20,308.00 19,229.00 19,490.00 20,518.00 Quarterly EPS $0.46 $0.61 +0.15 Rev % Growth 15.14% 6.27% -5.31% 1.36% 5.27% Yearly EPS $1.74 $2.32 +0.58 EPS $2.64 $2.46 $1.62 $0.97 $1.74 Factor Actual EPS Growth Est EPS Growth Change EPS % Growth 7.76% -6.82% -34.15% -40.12% 79.38% 3-5 year EPS 4.55% 6.25% +1.70 EPS Surprise EPS Quarterly Results Estimate Actual Difference % Difference FY Qtr 1 Qtr 2 Qtr 3 Qtr 4 Total Latest Qtr $0.54 $0.60 $0.06 11.11 12/09 $0.24 $0.12 $0.31 $0.30 $0.97 1 Qtr Ago $0.49 $0.52 $0.03 6.12 12/10 $0.34 $0.45 $0.46 $0.50 $1.75 2 Qtr Ago $0.46 $0.47 $0.01 2.17 12/11 $0.52 $0.61 - - - 3 Qtr Ago $0.43 $0.45 $0.02 4.65 Fiscal Year End Month is December. I want to receive special offers about trading stocks with your brokerage partner, optionsXpress. Click here www.chaikinpowertools.com
- 3. Price Trend & Expert Opinions Price/Volume Activity Price/Volume Activity Rating Relative Strength vs Market Neutral Chaikin Money Flow Price and volume activity for USB is neutral. USB is trading on higher volume than its 90 day average volume and is experiencing sustained selling. Price Trend The rank for USB is based on negative Chaikin money flow and an increasing Price Trend ROC volume trend. Volume Trend Relative Strength vs S&P500 Index Chaikin Money Flow Chart shows whether USB is performing better or worse than the market. Chaikin Money Flow analyzes supply and demand for a company's stock. Price Activity Price Activity Volume Activity Factor Value Factor Value Factor Value 52 Week High 28.70 % Change Price - 4 Weeks 5.88% Average Volume 20 Days 15,696,301 52 Week Low 20.31 % Change Price - 24 Weeks -14.22% Average Volume 90 Days 14,018,751 % Change YTD Rel S&P 500 -14.16% % Change Price - 4 Wks Rel to S&P -1.00% Chaikin Money Flow Persistency 20% % Change Price - 24 Wks Rel to S&P -7.14% Expert Opinions Expert Opinions Earnings Estimate Revisions Very Bullish Short Interest Expert opinions about USB are very positive. Analysts's opinions on USB have been more positive recently and analysts are raising their EPS estimates for USB. Insider Activity The rank for USB is based on analysts revising earnings estimates upward, a low short interest ratio, optimistic analyst opinions and price strength of the stock Analyst Opinions versus the Banks-Major industry group. Relative Strength vs Industry Earnings Estimate Revisions Analyst Recommendations EPS Estimates Revision Summary Current 7 Days Ago % Change Factor Value Last Week Last 4 Weeks Current Qtr 0.61 0.61 0.00% Mean this Week Buy Up Down Up Down Next Qtr 0.61 0.60 +1.67% Mean Last Week Buy Curr Qtr 1 0 1 2 Curr Yr 1 0 2 3 Current 30 Days Ago % Change Change 0.00 Next Qtr 1 0 2 2 Current FY 2.32 2.32 0.00 Mean 5 Weeks Ago Buy Next Yr 0 3 1 7 I want to receive special offers about trading stocks with your brokerage partner, optionsXpress. Click here www.chaikinpowertools.com
- 4. The Company & Its Competitors USB's Competitors in Banks-Major News Headlines for USB Company Power Historic EPS Projected EPS Profit Margin PEG PE Revenue(M) U.S. Bank Launches Dedicated Customer Gauge growth growth Support for Military Families - Aug 17, 2011 USB 4.55% 6.25% 19.73% 1.56 11.12 20,518 U.S. Bank Launches Dedicated Customer C 2.80% 7.66% 12.35% 0.93 8.81 86,601 Support for Military Families - Aug 17, 2011 U.S. Bank Asset Based Finance Closes $265 BAC 15.58% 7.80% -14.72% - - 134,194 Million Credit Facility for Lextron - Aug 9, 2011 BBT 7.47% 6.75% 9.05% 1.88 16.35 11,072 U.S. Bancorp Fund Services Launches Fourth Shared Trust - Jul 21, 2011 JPM 22.29% 6.75% 19.85% 1.04 7.44 102,694 U.S. Bank Offers New Fixed Rate Student Loan PNC 31.49% 6.67% 23.24% 1.19 7.67 17,096 - Jun 24, 2011 WFC 22.35% 8.67% 15.97% 1.03 9.67 93,249 BK 14.72% 7.00% 18.14% 1.31 9.09 13,875 Company Details Company Profile US BANCORP U.S. Bancorp is a financial services holding company. They operate full-service branch U.S.BANCORP 800 NICOLLET offices and ATMs, and provides a comprehensive line of banking, brokerage, insurance, MALL investment, mortgage, trust and payment services products to consumers, businesses MINNEAPOLIS, MN 55402 and institutions. U.S. Bancorp is the parent company of Firstar Bank and U.S. Bank. USA Phone: (651)466-3000 Website: http://http://www.usbank.com Full Time Employees: 60,584 Sector: Finance Power Gauge Ratings are created using a relative ranking system that assigns a rank of 0 to 100 (100 being the highest) to each stock in the universe. Rank is calculated by evaluating each of the stocks factors and combining them into a single number using a weighting formula. A stock's rank ranges from 100-0, where 100 is the strongest, and a rank of 95 indicates the stock is better than 95% of the stocks in the universe. Chaikin Stock Research(CSR) is not registered as a securities broker dealer or investment advisor with either the U.S. Securities and Exchange Commission or with any state securities regulatory authority. CSR is not responsible for trades executed by users of this research report, our web site or mobile app based on the information included herein. The information presented in this report does not represent a recommendation to buy or sell stocks or any financial instrument nor is it intended as an endorsement of any security or investment. The information in this report is generic by nature and is not personalized to the specific financial situation of any individual. The user bears complete responsibility for their own investment research and should seek the advice of a qualified investment professional before making any investment decisions. Copyright (c) 1978-(Present) by ZACKS Investment Research, Inc ("ZACKS"). The information, data, analyses and opinions contained herein (1) includes the confidential and proprietary information of ZACKS, (2) may not be copied or redistributed, for any purpose, (3) does not constitute investment advice offered by ZACKS, (4) are provided solely for informational purposes, and (5) are not warranted or represented to be correct, complete, accurate or timely. ZACKS shall not be responsible for investment decisions, damages or other losses resulting from, or related to, use of this information, data, analyses or opinions. Past performance is no guarantee of future performance. ZACKS is not affiliated with Chaikin Power Tools. This report from Chaikin Power Tools is for informational purposes only and is not a recommendation to buy or sell securities. LM 2.3 DS 3.0 LS 2.1 Data Provided by ZACKS Investment Research, Inc., www.zacks.com Special offers to trade stocks from optionsXpress: www.chaikinpowertools.com