Stock Research Report for GIB as of 7/27/11 - Chaikin Power Tools
•
1 gostou•348 visualizações

To order a free Chaikin Power Gauge stock research report for GIB go to http://www.chaikinpowertools.com/reports

Recomendados
Mais conteúdo relacionado
Mais de Dan Oconnor
Mais de Dan Oconnor (8)
Último
Último (20)
Stock Research Report for GIB as of 7/27/11 - Chaikin Power Tools
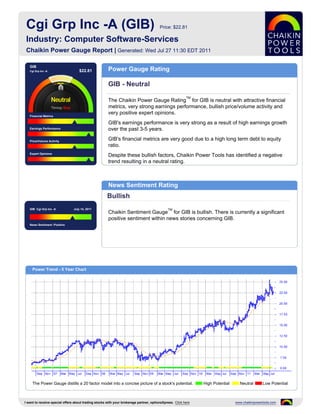
- 1. Cgi Grp Inc -A (GIB) Price: $22.81 Industry: Computer Software-Services Chaikin Power Gauge Report | Generated: Wed Jul 27 11:30 EDT 2011 GIB Cgi Grp Inc -A $22.81 Power Gauge Rating GIB - Neutral TM The Chaikin Power Gauge Rating for GIB is neutral with attractive financial metrics, very strong earnings performance, bullish price/volume activity and very positive expert opinions. Financial Metrics GIB's earnings performance is very strong as a result of high earnings growth Earnings Performance over the past 3-5 years. Price/Volume Activity GIB's financial metrics are very good due to a high long term debt to equity ratio. Expert Opinions Despite these bullish factors, Chaikin Power Tools has identified a negative trend resulting in a neutral rating. News Sentiment Rating Bullish GIB Cgi Grp Inc -A July 14, 2011 TM Chaikin Sentiment Gauge for GIB is bullish. There is currently a significant positive sentiment within news stories concerning GIB. News Sentiment :Positive Power Trend - 5 Year Chart The Power Gauge distills a 20 factor model into a concise picture of a stock's potential. High Potential Neutral Low Potential I want to receive special offers about trading stocks with your brokerage partner, optionsXpress. Click here www.chaikinpowertools.com
- 2. Financials & Earnings Financial Metrics Financial Metrics Rating LT Debt/Equity Ratio Bullish Price to Book Value GIB's financial metrics are very good. The company yields a high return on shareholder's equity and has high revenue per share. Return on Equity The rank is based on a high long term debt to equity ratio, high price to book value ratio, high return on equity, low price to sales ratio and relatively high cash Price to Sales Ratio flow. Business Value Assets and Liabilities Valuation Returns Ratio TTM Ratio TTM Ratio TTM Current Ratio 1.23 Price/Book 2.65 Return on Invest 15.1% LT Debt/Equity 0.48 Price/Sales 1.41 Return on Equity 20.4% Earnings Performance Earnings Performance Rating Earnings Growth Very Bullish Earnings Surprise GIB's earnings performance has been very strong. The company has a history of strong earnings growth and has a stable 5 year earnings trend. Earnings Trend The rank is based on high earnings growth over the past 3-5 years, a relatively low projected P/E ratio and consistent earnings over the past 5 years. Projected P/E Ratio Earnings Consistency 5 Year Revenue and Earnings Growth EPS Estimates 09/06 09/07 09/08 09/09 09/10 Factor Actual EPS Prev EST EPS Current Change Revenue(M) 3,477.60 3,710.00 3,705.86 3,555.79 3,722.86 Quarterly EPS $0.30 $0.41 +0.11 Rev % Growth 10.51% 6.68% -0.11% -4.05% 4.70% Yearly EPS $1.27 $1.65 +0.38 EPS $0.40 $0.72 $0.94 $0.96 $1.27 Factor Actual EPS Growth Est EPS Growth Change EPS % Growth -4.76% 80.00% 30.56% 2.13% 32.29% 3-5 year EPS 3.55% 15.20% +11.65 EPS Surprise EPS Quarterly Results Estimate Actual Difference % Difference FY Qtr 1 Qtr 2 Qtr 3 Qtr 4 Total Latest Qtr $0.40 $0.46 $0.06 15.00 09/09 $0.21 $0.21 $0.23 $0.25 $0.90 1 Qtr Ago $0.38 $0.44 $0.06 15.79 09/10 $0.37 $0.28 $0.29 $0.30 $1.24 2 Qtr Ago $0.35 $0.46 $0.11 31.43 09/11 $0.47 $0.46 - - - 3 Qtr Ago $0.29 $0.35 $0.06 20.69 Fiscal Year End Month is September. I want to receive special offers about trading stocks with your brokerage partner, optionsXpress. Click here www.chaikinpowertools.com
- 3. Price Trend & Expert Opinions Price/Volume Activity Price/Volume Activity Rating Relative Strength vs Market Bullish Chaikin Money Flow Price and volume activity for GIB is bullish. GIB has outperformed the S&P 500 over 26 weeks and is experiencing sustained buying. Price Trend The rank for GIB is based on its price strength versus the market, positive Chaikin Price Trend ROC money flow, a positive Chaikin price trend, a negative Chaikin price trend ROC and an increasing volume trend. Volume Trend Relative Strength vs S&P500 Index Chaikin Money Flow Chart shows whether GIB is performing better or worse than the market. Chaikin Money Flow analyzes supply and demand for a company's stock. Price Activity Price Activity Volume Activity Factor Value Factor Value Factor Value 52 Week High 25.57 % Change Price - 4 Weeks 2.02% Average Volume 20 Days 324,878 52 Week Low 13.71 % Change Price - 24 Weeks 12.55% Average Volume 90 Days 258,943 % Change YTD Rel S&P 500 22.54% % Change Price - 4 Wks Rel to S&P -2.85% Chaikin Money Flow Persistency 65% % Change Price - 24 Wks Rel to S&P 10.77% Expert Opinions Expert Opinions Earnings Estimate Revisions Very Bullish Short Interest Expert opinions about GIB are very positive. Shorting of GIB is low and analysts's opinions on GIB have been more positive recently. Insider Activity The rank for GIB is based on analysts revising earnings estimates upward, a low short interest ratio, optimistic analyst opinions and price strength of the stock Analyst Opinions versus the Computer Software-Services industry group. Relative Strength vs Industry Earnings Estimate Revisions Analyst Recommendations EPS Estimates Revision Summary Current 7 Days Ago % Change Factor Value Last Week Last 4 Weeks Current Qtr 0.41 0.41 0.00% Mean this Week Buy Up Down Up Down Next Qtr 0.43 0.43 0.00% Mean Last Week Buy Curr Qtr 0 2 1 2 Curr Yr 3 3 4 5 Current 30 Days Ago % Change Change +0.15 Next Qtr 0 0 0 1 Current FY 1.66 1.66 0.00 Mean 5 Weeks Ago Buy Next Yr 5 2 7 3 I want to receive special offers about trading stocks with your brokerage partner, optionsXpress. Click here www.chaikinpowertools.com
- 4. The Company & Its Competitors GIB's Competitors in Computer Software-Services News Headlines for GIB Company Power Historic EPS Projected EPS Profit Margin PEG PE Revenue(M) E CGI Contract EPA US 05 18 - May 18, 2011 Gauge growth growth Stanley helps CGI Group to book US$550 GIB 3.55% 15.20% 9.94% 0.91 13.32 3,723 million public contracts in first quarter - Jan 12, CSC 2.00% 9.00% 4.59% 0.87 7.91 16,042 2011 CGI files 2010 Annual Disclosure Reports - Dec CACI 15.86% 11.20% 3.70% 1.16 14.75 - 23, 2010 CBR 2.73% 35.50% -7.02% 0.42 24.29 1,071 e CGI taks order 11 03 - Nov 3, 2010 MANT 21.88% 9.74% 4.76% 1.19 12.19 2,604 e CGI Awarded 10 13 - Oct 13, 2010 SNX 8.95% 10.00% 1.34% 0.80 8.27 8,614 TLVT 16.14% 20.00% 6.14% 1.04 22.53 997 SGMS 3.28% 10.00% -18.91% 3.24 55.24 882 Company Details Company Profile CGI GRP INC -A CGI provides the full range of IT services including consulting, systems integration and 1130 SHERBROOKE ST WEST the management of business and IT functions. The company's primary focus is large MONTREAL QUEBEC, A8 H3A scale systems integration and outsourcing contracts. 2M8 CAN Phone: 5148413200 Fax: 514-841-3299 Website: http://www.cgi.com Full Time Employees: 26,000 Sector: Computer and Technology Power Gauge Ratings are created using a relative ranking system that assigns a rank of 0 to 100 (100 being the highest) to each stock in the universe. Rank is calculated by evaluating each of the stocks factors and combining them into a single number using a weighting formula. A stock's rank ranges from 100-0, where 100 is the strongest, and a rank of 95 indicates the stock is better than 95% of the stocks in the universe. Chaikin Stock Research(CSR) is not registered as a securities broker dealer or investment advisor with either the U.S. Securities and Exchange Commission or with any state securities regulatory authority. CSR is not responsible for trades executed by users of this research report, our web site or mobile app based on the information included herein. The information presented in this report does not represent a recommendation to buy or sell stocks or any financial instrument nor is it intended as an endorsement of any security or investment. The information in this report is generic by nature and is not personalized to the specific financial situation of any individual. The user bears complete responsibility for their own investment research and should seek the advice of a qualified investment professional before making any investment decisions. Copyright (c) 1978-(Present) by ZACKS Investment Research, Inc ("ZACKS"). The information, data, analyses and opinions contained herein (1) includes the confidential and proprietary information of ZACKS, (2) may not be copied or redistributed, for any purpose, (3) does not constitute investment advice offered by ZACKS, (4) are provided solely for informational purposes, and (5) are not warranted or represented to be correct, complete, accurate or timely. ZACKS shall not be responsible for investment decisions, damages or other losses resulting from, or related to, use of this information, data, analyses or opinions. Past performance is no guarantee of future performance. ZACKS is not affiliated with Chaikin Power Tools. This report from Chaikin Power Tools is for informational purposes only and is not a recommendation to buy or sell securities. LM 2.3 DS 3.0 LS 2.1 Data Provided by ZACKS Investment Research, Inc., www.zacks.com Special offers to trade stocks from optionsXpress: www.chaikinpowertools.com