Stock Research Report for CAT as of 7/8/11 - Chaikin Power Tools
•
1 gostou•114 visualizações

To order a free Chaikin Power Gauge stock research report for CAT go to http://www.chaikinpowertools.com/reports

Recomendados
Mais conteúdo relacionado
Destaque
Mais de Dan Oconnor
Mais de Dan Oconnor (10)
Último
Último (20)
Stock Research Report for CAT as of 7/8/11 - Chaikin Power Tools
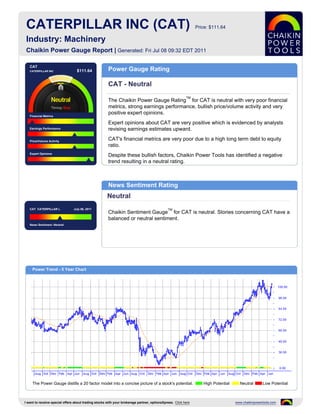
- 1. CATERPILLAR INC (CAT) Price: $111.64 Industry: Machinery Chaikin Power Gauge Report | Generated: Fri Jul 08 09:32 EDT 2011 CAT CATERPILLAR INC $111.64 Power Gauge Rating CAT - Neutral TM The Chaikin Power Gauge Rating for CAT is neutral with very poor financial metrics, strong earnings performance, bullish price/volume activity and very positive expert opinions. Financial Metrics Expert opinions about CAT are very positive which is evidenced by analysts Earnings Performance revising earnings estimates upward. Price/Volume Activity CAT's financial metrics are very poor due to a high long term debt to equity ratio. Expert Opinions Despite these bullish factors, Chaikin Power Tools has identified a negative trend resulting in a neutral rating. News Sentiment Rating Neutral CAT CATERPILLAR I.. July 06, 2011 TM Chaikin Sentiment Gauge for CAT is neutral. Stories concerning CAT have a balanced or neutral sentiment. News Sentiment :Neutral Power Trend - 5 Year Chart The Power Gauge distills a 20 factor model into a concise picture of a stock's potential. High Potential Neutral Low Potential I want to receive special offers about trading stocks with your brokerage partner, optionsXpress. Click here www.chaikinpowertools.com
- 2. Financials & Earnings Financial Metrics Financial Metrics Rating LT Debt/Equity Ratio Very Bearish Price to Book Value CAT's financial metrics are very poor. The company is carrying too much long term debt and may be overvalued. Return on Equity The rank is based on a high long term debt to equity ratio, high price to book value ratio, high return on equity, high price to sales ratio and relatively low cash Price to Sales Ratio flow. Business Value Assets and Liabilities Valuation Returns Ratio TTM Ratio TTM Ratio TTM Current Ratio 1.50 Price/Book 5.63 Return on Invest 11.6% LT Debt/Equity 1.88 Price/Sales 1.69 Return on Equity 34.0% Earnings Performance Earnings Performance Rating Earnings Growth Bullish Earnings Surprise CAT's earnings performance has been strong. The company has outperformed analysts' earnings estimates and experienced superior earnings growth in the past 12 months. Earnings Trend The rank is based on poor EPS growth over the past 3-5 years, better than Projected P/E Ratio expected earnings in recent quarters, an upward trend in earnings this year and consistent earnings over the past 5 years. Earnings Consistency 5 Year Revenue and Earnings Growth EPS Estimates 12/06 12/07 12/08 12/09 12/10 Factor Actual EPS Prev EST EPS Current Change Revenue(M) 41,517.00 44,958.00 51,324.00 32,396.00 42,588.00 Quarterly EPS $1.25 $1.69 +0.44 Rev % Growth 14.37% 8.29% 14.16% -36.88% 31.46% Yearly EPS $4.28 $6.94 +2.66 EPS $5.37 $5.55 $5.83 $1.46 $4.28 Factor Actual EPS Growth Est EPS Growth Change EPS % Growth 32.92% 3.35% 5.05% -74.96% 193.15% 3-5 year EPS 6.28% 13.00% +6.72 EPS Surprise EPS Quarterly Results Estimate Actual Difference % Difference FY Qtr 1 Qtr 2 Qtr 3 Qtr 4 Total Latest Qtr $1.31 $1.84 $0.53 40.46 12/09 $-0.19 $0.61 $0.65 $0.37 $1.44 1 Qtr Ago $1.28 $1.47 $0.19 14.84 12/10 $0.37 $1.12 $1.25 $1.52 $4.26 2 Qtr Ago $1.09 $1.22 $0.13 11.93 12/11 $1.91 - - - - 3 Qtr Ago $0.85 $0.99 $0.14 16.47 Fiscal Year End Month is December. I want to receive special offers about trading stocks with your brokerage partner, optionsXpress. Click here www.chaikinpowertools.com
- 3. Price Trend & Expert Opinions Price/Volume Activity Price/Volume Activity Rating Relative Strength vs Market Bullish Chaikin Money Flow Price and volume activity for CAT is bullish. CAT has outperformed the S&P 500 over 26 weeks and is experiencing sustained buying. Price Trend The rank for CAT is based on its price strength versus the market and positive Price Trend ROC Chaikin money flow. Volume Trend Relative Strength vs S&P500 Index Chaikin Money Flow Chart shows whether CAT is performing better or worse than the market. Chaikin Money Flow analyzes supply and demand for a company's stock. Price Activity Price Activity Volume Activity Factor Value Factor Value Factor Value 52 Week High 115.41 % Change Price - 4 Weeks 12.46% Average Volume 20 Days 7,990,085 52 Week Low 59.81 % Change Price - 24 Weeks 19.25% Average Volume 90 Days 7,738,038 % Change YTD Rel S&P 500 8.87% % Change Price - 4 Wks Rel to S&P 7.13% Chaikin Money Flow Persistency 68% % Change Price - 24 Wks Rel to S&P 12.82% Expert Opinions Expert Opinions Earnings Estimate Revisions Very Bullish Short Interest Expert opinions about CAT are very positive. Analysts are raising their EPS estimates for CAT and insiders are net buyers of CAT's stock. Insider Activity The rank for CAT is based on analysts revising earnings estimates upward, a low short interest ratio, insiders purchasing stock, optimistic analyst opinions and Analyst Opinions price strength of the stock versus the Machinery industry group. Relative Strength vs Industry Earnings Estimate Revisions Analyst Recommendations EPS Estimates Revision Summary Current 7 Days Ago % Change Factor Value Last Week Last 4 Weeks Current Qtr 1.73 1.73 0.00% Mean this Week Buy Up Down Up Down Next Qtr 1.69 1.69 0.00% Mean Last Week Buy Curr Qtr 0 0 1 0 Curr Yr 0 0 1 0 Current 30 Days Ago % Change Change 0.00 Next Qtr 0 0 0 2 Current FY 6.94 6.94 0.00 Mean 5 Weeks Ago Buy Next Yr 0 0 0 0 I want to receive special offers about trading stocks with your brokerage partner, optionsXpress. Click here www.chaikinpowertools.com
- 4. The Company & Its Competitors CAT's Competitors in Machinery News Headlines for CAT Company Power Historic EPS Projected EPS Profit Margin PEG PE Revenue(M) DOJ clears Caterpillar acquisition of Bucyrus - Gauge growth growth May 20, 2011 CAT 6.28% 13.00% 7.81% 1.24 20.22 42,588 Joy Global buys LeTourneau Technologies for ASTE 6.00% 15.00% 4.18% 1.49 26.61 771 $1.1 billion - May 16, 2011 Caterpillar Surpasses Earnings Expectations JOYG 13.61% 17.10% 13.46% 1.00 19.78 3,524 and Raises Its Outlook for the Year - Apr 29, BUCY 49.15% 16.05% 8.53% 1.09 20.59 3,651 2011 New Caterpillar CEO's compensation TEX -0.45% 16.25% -3.55% 2.45 - 4,418 quadruples - Apr 15, 2011 MTW 9.23% 22.50% -3.04% 1.80 129.14 3,142 IBM Introduces Software to Help Clients Reach New Mobile and Social Networks - Apr 11, 2011 Company Details Company Profile CATERPILLAR INC Caterpillar Inc is the world's largest manufacturer of construction and mining equipment, 100 NE ADAMS ST diesel and natural gas engines and industrial gas turbines. The company is one of only a PEORIA, IL 61629 handful of U.S. companies that leads its industry while competing globally from a USA principally domestic manufacturing base. The company records more than half of its Phone: 3096751000 sales to overseas customers. Their products are used in the construction, road building, Fax: 309-675-6155 mining, forestry, energy, transportation and material-handling industries. Website: http://http://www.cat.com Full Time Employees: 104,490 Sector: Industrial Products Power Gauge Ratings are created using a relative ranking system that assigns a rank of 0 to 100 (100 being the highest) to each stock in the universe. Rank is calculated by evaluating each of the stocks factors and combining them into a single number using a weighting formula. A stock's rank ranges from 100-0, where 100 is the strongest, and a rank of 95 indicates the stock is better than 95% of the stocks in the universe. Chaikin Stock Research(CSR) is not registered as a securities broker dealer or investment advisor with either the U.S. Securities and Exchange Commission or with any state securities regulatory authority. CSR is not responsible for trades executed by users of this research report, our web site or mobile app based on the information included herein. The information presented in this report does not represent a recommendation to buy or sell stocks or any financial instrument nor is it intended as an endorsement of any security or investment. The information in this report is generic by nature and is not personalized to the specific financial situation of any individual. The user bears complete responsibility for their own investment research and should seek the advice of a qualified investment professional before making any investment decisions. Copyright (c) 1978-(Present) by ZACKS Investment Research, Inc ("ZACKS"). The information, data, analyses and opinions contained herein (1) includes the confidential and proprietary information of ZACKS, (2) may not be copied or redistributed, for any purpose, (3) does not constitute investment advice offered by ZACKS, (4) are provided solely for informational purposes, and (5) are not warranted or represented to be correct, complete, accurate or timely. ZACKS shall not be responsible for investment decisions, damages or other losses resulting from, or related to, use of this information, data, analyses or opinions. Past performance is no guarantee of future performance. ZACKS is not affiliated with Chaikin Power Tools. This report from Chaikin Power Tools is for informational purposes only and is not a recommendation to buy or sell securities. LM 2.3 DS 3.0 LS 2.1 Data Provided by ZACKS Investment Research, Inc., www.zacks.com Special offers to trade stocks from optionsXpress: www.chaikinpowertools.com