SlideShare uma empresa Scribd logo
1 de 4
Baixar para ler offline
Jpmorgan Chase (JPM)                                                                                  Price: $36.03

 Industry: Banks-Major
 Chaikin Power Gauge Report | Generated: Wed Aug 17 10:46 EDT 2011

   JPM
   Jpmorgan Chase                   $36.03            Power Gauge Rating

                                                      JPM - Neutral
                                                                                                         TM
                                                      The Chaikin Power Gauge Rating for JPM is neutral and reflects poor
                                                      financial metrics, very strong earnings performance, bullish price/volume
                                                      activity and neutral expert opinions.
   Financial Metrics

                                                      JPM's earnings performance is very strong as a result of a relatively low
   Earnings Performance                               projected P/E ratio.

   Price/Volume Activity
                                                      JPM's financial metrics are poor due to a high long term debt to equity ratio.

   Expert Opinions


                                                      News Sentiment Rating
                                                      Bearish
   JPM Jpmorgan Chase         August 17, 2011                                                TM
                                                      Chaikin Sentiment Gauge for JPM is bearish. There is currently a significant
                                                      negative sentiment within news stories concerning JPM.
   News Sentiment :Negative


     Power Trend - 5 Year Chart


     The Power Gauge distills a 20 factor model into a concise picture of a stock's potential.                  High Potential     Neutral       Low Potential


I want to receive special offers about trading stocks with your brokerage partner, optionsXpress. Click here                     www.chaikinpowertools.com
Financials & Earnings


    Financial Metrics
                                                             Financial Metrics Rating

    LT Debt/Equity Ratio
                                                             Bearish

    Price to Book Value                                      JPM's financial metrics are poor. The company is carrying too much long term
                                                             debt and has relatively low revenue per share.
    Return on Equity
                                                             The rank is based on a high long term debt to equity ratio, low price to book value
                                                             and high price to sales ratio.
    Price to Sales Ratio


    Business Value


    Assets and Liabilities                                                 Valuation                                                   Returns


    Ratio                                               TTM                Ratio                                      TTM              Ratio                                         TTM

    Current Ratio                                       0.96               Price/Book                                  0.82            Return on Invest                              3.6%

    LT Debt/Equity                                      1.81               Price/Sales                                 1.39            Return on Equity                             11.9%


    Earnings Performance
                                                             Earnings Performance Rating

    Earnings Growth
                                                             Very Bullish

    Earnings Surprise                                        JPM's earnings performance has been very strong. The company is priced
                                                             relatively low compared to next year's projected EPS and has a stable 5 year
                                                             earnings trend.
    Earnings Trend

                                                             The rank is based on poor EPS growth over the past 3-5 years, better than
    Projected P/E Ratio                                      expected earnings in recent quarters, an upward trend in earnings this year, a
                                                             relatively low projected P/E ratio and consistent earnings over the past 5 years.
    Earnings Consistency


   5 Year Revenue and Earnings Growth                                                                 EPS Estimates


                              12/06         12/07            12/08            12/09           12/10   Factor                       Actual EPS Prev        EST EPS Current          Change

   Revenue(M)              61,437.00   116,353.00      67,252.00        100,434.00       102,694.00   Quarterly EPS                            $1.02                $1.23           +0.21

   Rev % Growth              12.67%        89.39%        -42.20%            49.34%           2.25%    Yearly EPS                               $3.96                $5.01           +1.05

   EPS                        $4.16         $4.51            $1.41            $2.27           $3.96   Factor                  Actual EPS Growth            Est EPS Growth          Change

   EPS % Growth              74.79%        8.41%         -68.74%            60.99%          74.45%    3-5 year EPS                         22.29%                   6.75%           -15.54


    EPS Surprise                                                                                      EPS Quarterly Results


                                Estimate            Actual           Difference       % Difference    FY                   Qtr 1           Qtr 2            Qtr 3        Qtr 4       Total

    Latest Qtr                     $1.21            $1.27                $0.06               4.96     12/09               $0.40            $0.28           $0.82        $0.75       $2.25

    1 Qtr Ago                      $1.16            $1.28                $0.12              10.34     12/10               $0.75            $1.10           $1.02        $1.12       $3.99

    2 Qtr Ago                      $1.00            $1.12                $0.12              12.00     12/11               $1.29            $1.28                -            -           -

    3 Qtr Ago                      $0.91            $1.01                $0.10              10.99     Fiscal Year End Month is December.


 I want to receive special offers about trading stocks with your brokerage partner, optionsXpress. Click here                                          www.chaikinpowertools.com
Price Trend & Expert Opinions

    Price/Volume Activity
                                                     Price/Volume Activity Rating

    Relative Strength vs Market                      Bullish

    Chaikin Money Flow
                                                     Price and volume activity for JPM is bullish. JPM is in an accelerating price trend
                                                     compared to 4 months ago and is trading on higher volume than its 90 day
    Price Trend                                      average volume.

    Price Trend ROC
                                                     The rank for JPM is based on its relative weakness versus the market, negative
                                                     Chaikin money flow, a positive Chaikin price trend ROC and an increasing
                                                     volume trend.
    Volume Trend


   Relative Strength vs S&P500 Index                                                          Chaikin Money Flow


   Chart shows whether JPM is performing better or worse than the market.                      Chaikin Money Flow analyzes supply and demand for a company's stock.


    Price Activity                                               Price Activity                                           Volume Activity

    Factor                                         Value        Factor                                           Value   Factor                                         Value

    52 Week High                                   48.00        % Change Price - 4 Weeks                    -10.80%      Average Volume 20 Days                    48,146,488

    52 Week Low                                    34.06        % Change Price - 24 Weeks                   -20.99%      Average Volume 90 Days                    35,989,938

    % Change YTD Rel S&P 500                      -9.69%        % Change Price - 4 Wks Rel to S&P               -0.78%   Chaikin Money Flow Persistency                  34%

                                                                % Change Price - 24 Wks Rel to S&P          -13.46%


    Expert Opinions
                                                     Expert Opinions

    Earnings Estimate Revisions                      Neutral
    Short Interest                                   Expert opinions about JPM are neutral. Shorting of JPM is low and analysts's
                                                     opinions on JPM have been more negative recently.
    Insider Activity
                                                     The rank for JPM is based on analysts revising earnings estimates downward, a
                                                     low short interest ratio, insiders purchasing stock, pessimistic analyst opinions
    Analyst Opinions
                                                     and relative weakness of the stock versus the Banks-Major industry group.

    Relative Strength vs Industry


    Earnings Estimate Revisions                                  Analyst Recommendations                                  EPS Estimates Revision Summary

                       Current      7 Days Ago % Change         Factor                                           Value                            Last Week    Last 4 Weeks

   Current Qtr           1.23             1.22   +0.82%         Mean this Week                            Strong Buy                           Up     Down         Up   Down

   Next Qtr              1.24             1.24    0.00%         Mean Last Week                            Strong Buy     Curr Qtr                 0       2         1       2

                                                                                                                         Curr Yr                  0       3         1       4
                       Current      30 Days Ago % Change        Change                                            0.00
                                                                                                                         Next Qtr                 0       3         0       3
   Current FY            5.01             5.03     -0.02        Mean 5 Weeks Ago                          Strong Buy
                                                                                                                         Next Yr                  0       3         0       3


 I want to receive special offers about trading stocks with your brokerage partner, optionsXpress. Click here                          www.chaikinpowertools.com
The Company & Its Competitors


   JPM's Competitors in Banks-Major                                                                                News Headlines for JPM

   Company     Power   Historic EPS   Projected EPS    Profit Margin       PEG           PE    Revenue(M)           Alabama county rejects settling $3.1B in debt -
               Gauge         growth           growth                                                                Aug 12, 2011
   JPM                      22.29%           6.75%          19.85%         1.07         7.70       102,694          Alabama county rejects settling $3.1B in debt -
   WFC                      22.35%           8.33%          15.97%         1.05         9.52        93,249
                                                                                                                    Aug 12, 2011
                                                                                                                    Firm accused of defrauding 5 Wis. school
   USB                       4.55%           6.25%          19.73%         1.53        10.87        20,518
                                                                                                                    districts - Aug 10, 2011
   BBT                       7.47%           6.75%           9.05%         1.75        15.30        11,072          Regulator sues Goldman Sachs over risky
                                                                                                                    mortgages - Aug 9, 2011
   PNC                      31.49%           6.67%          23.24%         1.15         7.35        17,096
                                                                                                                    N.M. Claims Settled In Scheme - Aug 7, 2011
   C                         2.80%           7.66%          12.35%         0.95         9.10        86,601

   BAC                      15.58%           7.80%         -14.72%            -            -       134,194

   BK                       14.72%           7.00%          18.14%         1.31         9.13        13,875


       Company Details                                             Company Profile

       JPMORGAN CHASE                                              J.P. Morgan Chase & Co. is a leading global financial services firm. The firm is a leader in
       270 PARK AVE 38TH FL                                        investment banking, asset management, private banking, private equity, custody and
       NEW YORK, NY 10017                                          transaction services and retail and middle market financial services. A component of the
       USA                                                         Dow Jones Industrial Average, JPMorgan Chase is headquartered in New York and
       Phone: 2122706000                                           serves more than 30 million consumer customers and the world's most prominent
       Fax: 212-270-1648                                           corporate, institutional and government clients.
       Website:
       http://http://www.jpmorganchase.co
       m
       Full Time Employees: 239,831
       Sector: Finance


  Power Gauge Ratings are created using a relative ranking system that assigns a rank of 0 to 100 (100 being the highest) to each stock in the universe. Rank is calculated
  by evaluating each of the stocks factors and combining them into a single number using a weighting formula. A stock's rank ranges from 100-0, where 100 is the
  strongest, and a rank of 95 indicates the stock is better than 95% of the stocks in the universe.

  Chaikin Stock Research(CSR) is not registered as a securities broker dealer or investment advisor with either the U.S. Securities and Exchange Commission or with any
  state securities regulatory authority. CSR is not responsible for trades executed by users of this research report, our web site or mobile app based on the information
  included herein. The information presented in this report does not represent a recommendation to buy or sell stocks or any financial instrument nor is it intended as an
  endorsement of any security or investment. The information in this report is generic by nature and is not personalized to the specific financial situation of any individual.
  The user bears complete responsibility for their own investment research and should seek the advice of a qualified investment professional before making any investment
  decisions.

  Copyright (c) 1978-(Present) by ZACKS Investment Research, Inc ("ZACKS"). The information, data, analyses and opinions contained herein (1) includes the
  confidential and proprietary information of ZACKS, (2) may not be copied or redistributed, for any purpose, (3) does not constitute investment advice offered by
  ZACKS, (4) are provided solely for informational purposes, and (5) are not warranted or represented to be correct, complete, accurate or timely. ZACKS shall not be
  responsible for investment decisions, damages or other losses resulting from, or related to, use of this information, data, analyses or opinions. Past performance is no
  guarantee of future performance. ZACKS is not affiliated with Chaikin Power Tools.

  This report from Chaikin Power Tools is for informational purposes only and is not a recommendation to buy or sell securities.


                                                                                                                                                                     LM 2.3 DS 3.0 LS 2.1


 Data Provided by ZACKS Investment Research, Inc., www.zacks.com                     Special offers to trade stocks from optionsXpress: www.chaikinpowertools.com

Mais conteúdo relacionado

Último

The Abortion pills for sale in Qatar@Doha [+27737758557] []Deira Dubai Kuwait
The Abortion pills for sale in Qatar@Doha [+27737758557] []Deira Dubai KuwaitThe Abortion pills for sale in Qatar@Doha [+27737758557] []Deira Dubai Kuwait
The Abortion pills for sale in Qatar@Doha [+27737758557] []Deira Dubai Kuwait
daisycvs
 
Mckinsey foundation level Handbook for Viewing
Mckinsey foundation level Handbook for ViewingMckinsey foundation level Handbook for Viewing
Mckinsey foundation level Handbook for Viewing
Nauman Safdar
 

Último (20)

Unveiling Falcon Invoice Discounting: Leading the Way as India's Premier Bill...
Unveiling Falcon Invoice Discounting: Leading the Way as India's Premier Bill...Unveiling Falcon Invoice Discounting: Leading the Way as India's Premier Bill...
Unveiling Falcon Invoice Discounting: Leading the Way as India's Premier Bill...
 
Berhampur 70918*19311 CALL GIRLS IN ESCORT SERVICE WE ARE PROVIDING
Berhampur 70918*19311 CALL GIRLS IN ESCORT SERVICE WE ARE PROVIDINGBerhampur 70918*19311 CALL GIRLS IN ESCORT SERVICE WE ARE PROVIDING
Berhampur 70918*19311 CALL GIRLS IN ESCORT SERVICE WE ARE PROVIDING
 
Call 7737669865 Vadodara Call Girls Service at your Door Step Available All Time
Call 7737669865 Vadodara Call Girls Service at your Door Step Available All TimeCall 7737669865 Vadodara Call Girls Service at your Door Step Available All Time
Call 7737669865 Vadodara Call Girls Service at your Door Step Available All Time
 
UAE Bur Dubai Call Girls ☏ 0564401582 Call Girl in Bur Dubai
UAE Bur Dubai Call Girls ☏ 0564401582 Call Girl in Bur DubaiUAE Bur Dubai Call Girls ☏ 0564401582 Call Girl in Bur Dubai
UAE Bur Dubai Call Girls ☏ 0564401582 Call Girl in Bur Dubai
 
QSM Chap 10 Service Culture in Tourism and Hospitality Industry.pptx
QSM Chap 10 Service Culture in Tourism and Hospitality Industry.pptxQSM Chap 10 Service Culture in Tourism and Hospitality Industry.pptx
QSM Chap 10 Service Culture in Tourism and Hospitality Industry.pptx
 
Berhampur 70918*19311 CALL GIRLS IN ESCORT SERVICE WE ARE PROVIDING
Berhampur 70918*19311 CALL GIRLS IN ESCORT SERVICE WE ARE PROVIDINGBerhampur 70918*19311 CALL GIRLS IN ESCORT SERVICE WE ARE PROVIDING
Berhampur 70918*19311 CALL GIRLS IN ESCORT SERVICE WE ARE PROVIDING
 
Marel Q1 2024 Investor Presentation from May 8, 2024
Marel Q1 2024 Investor Presentation from May 8, 2024Marel Q1 2024 Investor Presentation from May 8, 2024
Marel Q1 2024 Investor Presentation from May 8, 2024
 
Katrina Personal Brand Project and portfolio 1
Katrina Personal Brand Project and portfolio 1Katrina Personal Brand Project and portfolio 1
Katrina Personal Brand Project and portfolio 1
 
JAJPUR CALL GIRL ❤ 82729*64427❤ CALL GIRLS IN JAJPUR ESCORTS
JAJPUR CALL GIRL ❤ 82729*64427❤ CALL GIRLS IN JAJPUR  ESCORTSJAJPUR CALL GIRL ❤ 82729*64427❤ CALL GIRLS IN JAJPUR  ESCORTS
JAJPUR CALL GIRL ❤ 82729*64427❤ CALL GIRLS IN JAJPUR ESCORTS
 
Escorts in Nungambakkam Phone 8250092165 Enjoy 24/7 Escort Service Enjoy Your...
Escorts in Nungambakkam Phone 8250092165 Enjoy 24/7 Escort Service Enjoy Your...Escorts in Nungambakkam Phone 8250092165 Enjoy 24/7 Escort Service Enjoy Your...
Escorts in Nungambakkam Phone 8250092165 Enjoy 24/7 Escort Service Enjoy Your...
 
Chennai Call Gril 80022//12248 Only For Sex And High Profile Best Gril Sex Av...
Chennai Call Gril 80022//12248 Only For Sex And High Profile Best Gril Sex Av...Chennai Call Gril 80022//12248 Only For Sex And High Profile Best Gril Sex Av...
Chennai Call Gril 80022//12248 Only For Sex And High Profile Best Gril Sex Av...
 
Durg CALL GIRL ❤ 82729*64427❤ CALL GIRLS IN durg ESCORTS
Durg CALL GIRL ❤ 82729*64427❤ CALL GIRLS IN durg ESCORTSDurg CALL GIRL ❤ 82729*64427❤ CALL GIRLS IN durg ESCORTS
Durg CALL GIRL ❤ 82729*64427❤ CALL GIRLS IN durg ESCORTS
 
joint cost.pptx COST ACCOUNTING Sixteenth Edition ...
joint cost.pptx  COST ACCOUNTING  Sixteenth Edition                          ...joint cost.pptx  COST ACCOUNTING  Sixteenth Edition                          ...
joint cost.pptx COST ACCOUNTING Sixteenth Edition ...
 
The Abortion pills for sale in Qatar@Doha [+27737758557] []Deira Dubai Kuwait
The Abortion pills for sale in Qatar@Doha [+27737758557] []Deira Dubai KuwaitThe Abortion pills for sale in Qatar@Doha [+27737758557] []Deira Dubai Kuwait
The Abortion pills for sale in Qatar@Doha [+27737758557] []Deira Dubai Kuwait
 
Berhampur Call Girl Just Call 8084732287 Top Class Call Girl Service Available
Berhampur Call Girl Just Call 8084732287 Top Class Call Girl Service AvailableBerhampur Call Girl Just Call 8084732287 Top Class Call Girl Service Available
Berhampur Call Girl Just Call 8084732287 Top Class Call Girl Service Available
 
Uneak White's Personal Brand Exploration Presentation
Uneak White's Personal Brand Exploration PresentationUneak White's Personal Brand Exploration Presentation
Uneak White's Personal Brand Exploration Presentation
 
Phases of Negotiation .pptx
 Phases of Negotiation .pptx Phases of Negotiation .pptx
Phases of Negotiation .pptx
 
Mckinsey foundation level Handbook for Viewing
Mckinsey foundation level Handbook for ViewingMckinsey foundation level Handbook for Viewing
Mckinsey foundation level Handbook for Viewing
 
Organizational Transformation Lead with Culture
Organizational Transformation Lead with CultureOrganizational Transformation Lead with Culture
Organizational Transformation Lead with Culture
 
SEO Case Study: How I Increased SEO Traffic & Ranking by 50-60% in 6 Months
SEO Case Study: How I Increased SEO Traffic & Ranking by 50-60%  in 6 MonthsSEO Case Study: How I Increased SEO Traffic & Ranking by 50-60%  in 6 Months
SEO Case Study: How I Increased SEO Traffic & Ranking by 50-60% in 6 Months
 

Destaque

How Race, Age and Gender Shape Attitudes Towards Mental Health
How Race, Age and Gender Shape Attitudes Towards Mental HealthHow Race, Age and Gender Shape Attitudes Towards Mental Health
How Race, Age and Gender Shape Attitudes Towards Mental Health
ThinkNow
 
Social Media Marketing Trends 2024 // The Global Indie Insights
Social Media Marketing Trends 2024 // The Global Indie InsightsSocial Media Marketing Trends 2024 // The Global Indie Insights
Social Media Marketing Trends 2024 // The Global Indie Insights
Kurio // The Social Media Age(ncy)
 

Destaque (20)

2024 State of Marketing Report – by Hubspot
2024 State of Marketing Report – by Hubspot2024 State of Marketing Report – by Hubspot
2024 State of Marketing Report – by Hubspot
 
Everything You Need To Know About ChatGPT
Everything You Need To Know About ChatGPTEverything You Need To Know About ChatGPT
Everything You Need To Know About ChatGPT
 
Product Design Trends in 2024 | Teenage Engineerings
Product Design Trends in 2024 | Teenage EngineeringsProduct Design Trends in 2024 | Teenage Engineerings
Product Design Trends in 2024 | Teenage Engineerings
 
How Race, Age and Gender Shape Attitudes Towards Mental Health
How Race, Age and Gender Shape Attitudes Towards Mental HealthHow Race, Age and Gender Shape Attitudes Towards Mental Health
How Race, Age and Gender Shape Attitudes Towards Mental Health
 
AI Trends in Creative Operations 2024 by Artwork Flow.pdf
AI Trends in Creative Operations 2024 by Artwork Flow.pdfAI Trends in Creative Operations 2024 by Artwork Flow.pdf
AI Trends in Creative Operations 2024 by Artwork Flow.pdf
 
Skeleton Culture Code
Skeleton Culture CodeSkeleton Culture Code
Skeleton Culture Code
 
PEPSICO Presentation to CAGNY Conference Feb 2024
PEPSICO Presentation to CAGNY Conference Feb 2024PEPSICO Presentation to CAGNY Conference Feb 2024
PEPSICO Presentation to CAGNY Conference Feb 2024
 
Content Methodology: A Best Practices Report (Webinar)
Content Methodology: A Best Practices Report (Webinar)Content Methodology: A Best Practices Report (Webinar)
Content Methodology: A Best Practices Report (Webinar)
 
How to Prepare For a Successful Job Search for 2024
How to Prepare For a Successful Job Search for 2024How to Prepare For a Successful Job Search for 2024
How to Prepare For a Successful Job Search for 2024
 
Social Media Marketing Trends 2024 // The Global Indie Insights
Social Media Marketing Trends 2024 // The Global Indie InsightsSocial Media Marketing Trends 2024 // The Global Indie Insights
Social Media Marketing Trends 2024 // The Global Indie Insights
 
Trends In Paid Search: Navigating The Digital Landscape In 2024
Trends In Paid Search: Navigating The Digital Landscape In 2024Trends In Paid Search: Navigating The Digital Landscape In 2024
Trends In Paid Search: Navigating The Digital Landscape In 2024
 
5 Public speaking tips from TED - Visualized summary
5 Public speaking tips from TED - Visualized summary5 Public speaking tips from TED - Visualized summary
5 Public speaking tips from TED - Visualized summary
 
ChatGPT and the Future of Work - Clark Boyd
ChatGPT and the Future of Work - Clark Boyd ChatGPT and the Future of Work - Clark Boyd
ChatGPT and the Future of Work - Clark Boyd
 
Getting into the tech field. what next
Getting into the tech field. what next Getting into the tech field. what next
Getting into the tech field. what next
 
Google's Just Not That Into You: Understanding Core Updates & Search Intent
Google's Just Not That Into You: Understanding Core Updates & Search IntentGoogle's Just Not That Into You: Understanding Core Updates & Search Intent
Google's Just Not That Into You: Understanding Core Updates & Search Intent
 
How to have difficult conversations
How to have difficult conversations How to have difficult conversations
How to have difficult conversations
 
Introduction to Data Science
Introduction to Data ScienceIntroduction to Data Science
Introduction to Data Science
 
Time Management & Productivity - Best Practices
Time Management & Productivity -  Best PracticesTime Management & Productivity -  Best Practices
Time Management & Productivity - Best Practices
 
The six step guide to practical project management
The six step guide to practical project managementThe six step guide to practical project management
The six step guide to practical project management
 
Beginners Guide to TikTok for Search - Rachel Pearson - We are Tilt __ Bright...
Beginners Guide to TikTok for Search - Rachel Pearson - We are Tilt __ Bright...Beginners Guide to TikTok for Search - Rachel Pearson - We are Tilt __ Bright...
Beginners Guide to TikTok for Search - Rachel Pearson - We are Tilt __ Bright...
 

Stock Research Report for JPM as of 8/17/11 - Chaikin Power Tools

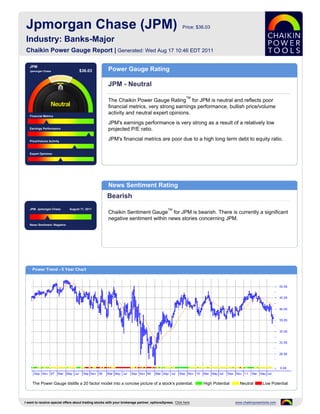
  • 1. Jpmorgan Chase (JPM) Price: $36.03 Industry: Banks-Major Chaikin Power Gauge Report | Generated: Wed Aug 17 10:46 EDT 2011 JPM Jpmorgan Chase $36.03 Power Gauge Rating JPM - Neutral TM The Chaikin Power Gauge Rating for JPM is neutral and reflects poor financial metrics, very strong earnings performance, bullish price/volume activity and neutral expert opinions. Financial Metrics JPM's earnings performance is very strong as a result of a relatively low Earnings Performance projected P/E ratio. Price/Volume Activity JPM's financial metrics are poor due to a high long term debt to equity ratio. Expert Opinions News Sentiment Rating Bearish JPM Jpmorgan Chase August 17, 2011 TM Chaikin Sentiment Gauge for JPM is bearish. There is currently a significant negative sentiment within news stories concerning JPM. News Sentiment :Negative Power Trend - 5 Year Chart The Power Gauge distills a 20 factor model into a concise picture of a stock's potential. High Potential Neutral Low Potential I want to receive special offers about trading stocks with your brokerage partner, optionsXpress. Click here www.chaikinpowertools.com
  • 2. Financials & Earnings Financial Metrics Financial Metrics Rating LT Debt/Equity Ratio Bearish Price to Book Value JPM's financial metrics are poor. The company is carrying too much long term debt and has relatively low revenue per share. Return on Equity The rank is based on a high long term debt to equity ratio, low price to book value and high price to sales ratio. Price to Sales Ratio Business Value Assets and Liabilities Valuation Returns Ratio TTM Ratio TTM Ratio TTM Current Ratio 0.96 Price/Book 0.82 Return on Invest 3.6% LT Debt/Equity 1.81 Price/Sales 1.39 Return on Equity 11.9% Earnings Performance Earnings Performance Rating Earnings Growth Very Bullish Earnings Surprise JPM's earnings performance has been very strong. The company is priced relatively low compared to next year's projected EPS and has a stable 5 year earnings trend. Earnings Trend The rank is based on poor EPS growth over the past 3-5 years, better than Projected P/E Ratio expected earnings in recent quarters, an upward trend in earnings this year, a relatively low projected P/E ratio and consistent earnings over the past 5 years. Earnings Consistency 5 Year Revenue and Earnings Growth EPS Estimates 12/06 12/07 12/08 12/09 12/10 Factor Actual EPS Prev EST EPS Current Change Revenue(M) 61,437.00 116,353.00 67,252.00 100,434.00 102,694.00 Quarterly EPS $1.02 $1.23 +0.21 Rev % Growth 12.67% 89.39% -42.20% 49.34% 2.25% Yearly EPS $3.96 $5.01 +1.05 EPS $4.16 $4.51 $1.41 $2.27 $3.96 Factor Actual EPS Growth Est EPS Growth Change EPS % Growth 74.79% 8.41% -68.74% 60.99% 74.45% 3-5 year EPS 22.29% 6.75% -15.54 EPS Surprise EPS Quarterly Results Estimate Actual Difference % Difference FY Qtr 1 Qtr 2 Qtr 3 Qtr 4 Total Latest Qtr $1.21 $1.27 $0.06 4.96 12/09 $0.40 $0.28 $0.82 $0.75 $2.25 1 Qtr Ago $1.16 $1.28 $0.12 10.34 12/10 $0.75 $1.10 $1.02 $1.12 $3.99 2 Qtr Ago $1.00 $1.12 $0.12 12.00 12/11 $1.29 $1.28 - - - 3 Qtr Ago $0.91 $1.01 $0.10 10.99 Fiscal Year End Month is December. I want to receive special offers about trading stocks with your brokerage partner, optionsXpress. Click here www.chaikinpowertools.com
  • 3. Price Trend & Expert Opinions Price/Volume Activity Price/Volume Activity Rating Relative Strength vs Market Bullish Chaikin Money Flow Price and volume activity for JPM is bullish. JPM is in an accelerating price trend compared to 4 months ago and is trading on higher volume than its 90 day Price Trend average volume. Price Trend ROC The rank for JPM is based on its relative weakness versus the market, negative Chaikin money flow, a positive Chaikin price trend ROC and an increasing volume trend. Volume Trend Relative Strength vs S&P500 Index Chaikin Money Flow Chart shows whether JPM is performing better or worse than the market. Chaikin Money Flow analyzes supply and demand for a company's stock. Price Activity Price Activity Volume Activity Factor Value Factor Value Factor Value 52 Week High 48.00 % Change Price - 4 Weeks -10.80% Average Volume 20 Days 48,146,488 52 Week Low 34.06 % Change Price - 24 Weeks -20.99% Average Volume 90 Days 35,989,938 % Change YTD Rel S&P 500 -9.69% % Change Price - 4 Wks Rel to S&P -0.78% Chaikin Money Flow Persistency 34% % Change Price - 24 Wks Rel to S&P -13.46% Expert Opinions Expert Opinions Earnings Estimate Revisions Neutral Short Interest Expert opinions about JPM are neutral. Shorting of JPM is low and analysts's opinions on JPM have been more negative recently. Insider Activity The rank for JPM is based on analysts revising earnings estimates downward, a low short interest ratio, insiders purchasing stock, pessimistic analyst opinions Analyst Opinions and relative weakness of the stock versus the Banks-Major industry group. Relative Strength vs Industry Earnings Estimate Revisions Analyst Recommendations EPS Estimates Revision Summary Current 7 Days Ago % Change Factor Value Last Week Last 4 Weeks Current Qtr 1.23 1.22 +0.82% Mean this Week Strong Buy Up Down Up Down Next Qtr 1.24 1.24 0.00% Mean Last Week Strong Buy Curr Qtr 0 2 1 2 Curr Yr 0 3 1 4 Current 30 Days Ago % Change Change 0.00 Next Qtr 0 3 0 3 Current FY 5.01 5.03 -0.02 Mean 5 Weeks Ago Strong Buy Next Yr 0 3 0 3 I want to receive special offers about trading stocks with your brokerage partner, optionsXpress. Click here www.chaikinpowertools.com
  • 4. The Company & Its Competitors JPM's Competitors in Banks-Major News Headlines for JPM Company Power Historic EPS Projected EPS Profit Margin PEG PE Revenue(M) Alabama county rejects settling $3.1B in debt - Gauge growth growth Aug 12, 2011 JPM 22.29% 6.75% 19.85% 1.07 7.70 102,694 Alabama county rejects settling $3.1B in debt - WFC 22.35% 8.33% 15.97% 1.05 9.52 93,249 Aug 12, 2011 Firm accused of defrauding 5 Wis. school USB 4.55% 6.25% 19.73% 1.53 10.87 20,518 districts - Aug 10, 2011 BBT 7.47% 6.75% 9.05% 1.75 15.30 11,072 Regulator sues Goldman Sachs over risky mortgages - Aug 9, 2011 PNC 31.49% 6.67% 23.24% 1.15 7.35 17,096 N.M. Claims Settled In Scheme - Aug 7, 2011 C 2.80% 7.66% 12.35% 0.95 9.10 86,601 BAC 15.58% 7.80% -14.72% - - 134,194 BK 14.72% 7.00% 18.14% 1.31 9.13 13,875 Company Details Company Profile JPMORGAN CHASE J.P. Morgan Chase & Co. is a leading global financial services firm. The firm is a leader in 270 PARK AVE 38TH FL investment banking, asset management, private banking, private equity, custody and NEW YORK, NY 10017 transaction services and retail and middle market financial services. A component of the USA Dow Jones Industrial Average, JPMorgan Chase is headquartered in New York and Phone: 2122706000 serves more than 30 million consumer customers and the world's most prominent Fax: 212-270-1648 corporate, institutional and government clients. Website: http://http://www.jpmorganchase.co m Full Time Employees: 239,831 Sector: Finance Power Gauge Ratings are created using a relative ranking system that assigns a rank of 0 to 100 (100 being the highest) to each stock in the universe. Rank is calculated by evaluating each of the stocks factors and combining them into a single number using a weighting formula. A stock's rank ranges from 100-0, where 100 is the strongest, and a rank of 95 indicates the stock is better than 95% of the stocks in the universe. Chaikin Stock Research(CSR) is not registered as a securities broker dealer or investment advisor with either the U.S. Securities and Exchange Commission or with any state securities regulatory authority. CSR is not responsible for trades executed by users of this research report, our web site or mobile app based on the information included herein. The information presented in this report does not represent a recommendation to buy or sell stocks or any financial instrument nor is it intended as an endorsement of any security or investment. The information in this report is generic by nature and is not personalized to the specific financial situation of any individual. The user bears complete responsibility for their own investment research and should seek the advice of a qualified investment professional before making any investment decisions. Copyright (c) 1978-(Present) by ZACKS Investment Research, Inc ("ZACKS"). The information, data, analyses and opinions contained herein (1) includes the confidential and proprietary information of ZACKS, (2) may not be copied or redistributed, for any purpose, (3) does not constitute investment advice offered by ZACKS, (4) are provided solely for informational purposes, and (5) are not warranted or represented to be correct, complete, accurate or timely. ZACKS shall not be responsible for investment decisions, damages or other losses resulting from, or related to, use of this information, data, analyses or opinions. Past performance is no guarantee of future performance. ZACKS is not affiliated with Chaikin Power Tools. This report from Chaikin Power Tools is for informational purposes only and is not a recommendation to buy or sell securities. LM 2.3 DS 3.0 LS 2.1 Data Provided by ZACKS Investment Research, Inc., www.zacks.com Special offers to trade stocks from optionsXpress: www.chaikinpowertools.com