SlideShare uma empresa Scribd logo
1 de 1
Baixar para ler offline
Supplemental Nutrition Assistance Program Fact Sheet


                                                                                                 Farmers’ Market
                                                                                                 Edition: FY 2010
Number of SNAP Authorized Farmers’ Markets

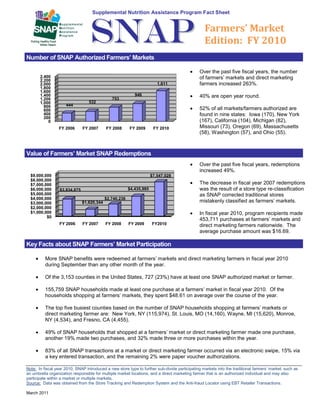
                                                                                               Over the past five fiscal years, the number
       2,400
       2,200
                                                                                               of farmers’ markets and direct marketing
       2,000                                                             1,611                 farmers increased 263%.
       1,800
       1,600
       1,400                                                946                                40% are open year round.
       1,200                                   753
       1,000                      532
         800         444
         600                                                                                   52% of all markets/farmers authorized are
         400                                                                                   found in nine states: Iowa (170), New York
         200
           0                                                                                   (167), California (104), Michigan (82),
                 FY 2006       FY 2007      FY 2008      FY 2009       FY 2010                 Missouri (73), Oregon (69), Massachusetts
                                                                                               (58), Washington (57), and Ohio (55).


Value of Farmers’ Market SNAP Redemptions
                                                                                               Over the past five fiscal years, redemptions
                                                                                               increased 49%.
  $9,000,000                                                          $7,547,028
  $8,000,000
  $7,000,000                                                                                   The decrease in fiscal year 2007 redemptions
  $6,000,000      $3,834,875                             $4,435,985                            was the result of a store type re-classification
  $5,000,000                                                                                   as SNAP corrected traditional stores
  $4,000,000                                $2,740,236
  $3,000,000                   $1,620,344                                                      mistakenly classified as farmers’ markets.
  $2,000,000
  $1,000,000                                                                                   In fiscal year 2010, program recipients made
          $0
                                                                                               453,711 purchases at farmers’ markets and
                  FY 2006      FY 2007      FY 2008      FY 2009      FY2010                   direct marketing farmers nationwide. The
                                                                                               average purchase amount was $16.69.

Key Facts about SNAP Farmers’ Market Participation

          More SNAP benefits were redeemed at farmers’ markets and direct marketing farmers in fiscal year 2010
          during September than any other month of the year.

          Of the 3,153 counties in the United States, 727 (23%) have at least one SNAP authorized market or farmer.

          155,759 SNAP households made at least one purchase at a farmers’ market in fiscal year 2010. Of the
          households shopping at farmers’ markets, they spent $48.61 on average over the course of the year.

          The top five busiest counties based on the number of SNAP households shopping at farmers’ markets or
          direct marketing farmer are: New York, NY (115,974), St. Louis, MO (14,160), Wayne, MI (15,620), Monroe,
          NY (4,534), and Fresno, CA (4,455).

          49% of SNAP households that shopped at a farmers’ market or direct marketing farmer made one purchase,
          another 19% made two purchases, and 32% made three or more purchases within the year.

          83% of all SNAP transactions at a market or direct marketing farmer occurred via an electronic swipe, 15% via
          a key entered transaction, and the remaining 2% were paper voucher authorizations.

Note: In fiscal year 2010, SNAP introduced a new store type to further sub-divide participating markets into the traditional farmers’ market, such as
an umbrella organization responsible for multiple market locations, and a direct marketing farmer that is an authorized individual and may also
participate within a market or multiple markets.
Source: Data was obtained from the Store Tracking and Redemption System and the Anti-fraud Locator using EBT Retailer Transactions.

March 2011

Mais conteúdo relacionado

Semelhante a 2010 SNAP at FMs Fact Sheet

monsanto 01-24-05_low
monsanto 01-24-05_lowmonsanto 01-24-05_low
monsanto 01-24-05_lowfinance28
 
Profitability of Actors in the Value Chain of Commercial Rice
Profitability of Actors in the Value Chain of Commercial RiceProfitability of Actors in the Value Chain of Commercial Rice
Profitability of Actors in the Value Chain of Commercial RiceAI Publications
 
monsanto 04-11-05
monsanto 04-11-05monsanto 04-11-05
monsanto 04-11-05finance28
 
Marketing Organic Grains
Marketing Organic GrainsMarketing Organic Grains
Marketing Organic GrainsGardening
 
State Implementation of the New WIC Produce Package:
State Implementation of the New WIC Produce Package:State Implementation of the New WIC Produce Package:
State Implementation of the New WIC Produce Package:John Smith
 
United Natural Foods - Risky But With Large Upside Potential
United Natural Foods -  Risky But With Large Upside PotentialUnited Natural Foods -  Risky But With Large Upside Potential
United Natural Foods - Risky But With Large Upside Potentialalexgavrish
 
Sustainable Corn and Soybean Production
Sustainable Corn and Soybean ProductionSustainable Corn and Soybean Production
Sustainable Corn and Soybean ProductionGardening
 
Discussion Paper_ contract services for smallholders_Lund Nov2015 Word version
Discussion Paper_ contract services for smallholders_Lund Nov2015 Word versionDiscussion Paper_ contract services for smallholders_Lund Nov2015 Word version
Discussion Paper_ contract services for smallholders_Lund Nov2015 Word versionBrian Lund
 
Full Draft-Enhancing Farmers' Markets
Full Draft-Enhancing Farmers' MarketsFull Draft-Enhancing Farmers' Markets
Full Draft-Enhancing Farmers' MarketsJoshua Pierce
 
Mercer Capital's Value Focus: Agribusiness | Q2 2018 | Segment: Crops and Cro...
Mercer Capital's Value Focus: Agribusiness | Q2 2018 | Segment: Crops and Cro...Mercer Capital's Value Focus: Agribusiness | Q2 2018 | Segment: Crops and Cro...
Mercer Capital's Value Focus: Agribusiness | Q2 2018 | Segment: Crops and Cro...Mercer Capital
 
Keynote Address
Keynote AddressKeynote Address
Keynote Addressthelenju
 
ICRISAT Research Program West and Central Africa 2016 Highlights- Moves to es...
ICRISAT Research Program West and Central Africa 2016 Highlights- Moves to es...ICRISAT Research Program West and Central Africa 2016 Highlights- Moves to es...
ICRISAT Research Program West and Central Africa 2016 Highlights- Moves to es...ICRISAT
 
Ne Iowa FFI Overview Driftless
Ne Iowa FFI Overview DriftlessNe Iowa FFI Overview Driftless
Ne Iowa FFI Overview Driftlessiowafoodandfitness
 
Natural Livestock Feasibility Study
Natural Livestock Feasibility StudyNatural Livestock Feasibility Study
Natural Livestock Feasibility StudyElisaMendelsohn
 
Natural Livestock Feasibility Study
Natural Livestock Feasibility StudyNatural Livestock Feasibility Study
Natural Livestock Feasibility StudyElisaMendelsohn
 
Natural Livestock Feasibility Study
Natural Livestock Feasibility StudyNatural Livestock Feasibility Study
Natural Livestock Feasibility StudyElisaMendelsohn
 

Semelhante a 2010 SNAP at FMs Fact Sheet (20)

monsanto 01-24-05_low
monsanto 01-24-05_lowmonsanto 01-24-05_low
monsanto 01-24-05_low
 
Profitability of Actors in the Value Chain of Commercial Rice
Profitability of Actors in the Value Chain of Commercial RiceProfitability of Actors in the Value Chain of Commercial Rice
Profitability of Actors in the Value Chain of Commercial Rice
 
monsanto 04-11-05
monsanto 04-11-05monsanto 04-11-05
monsanto 04-11-05
 
Local foods
Local foodsLocal foods
Local foods
 
Marketing Organic Grains
Marketing Organic GrainsMarketing Organic Grains
Marketing Organic Grains
 
State Implementation of the New WIC Produce Package:
State Implementation of the New WIC Produce Package:State Implementation of the New WIC Produce Package:
State Implementation of the New WIC Produce Package:
 
Socio Economic Variables of Cashew Farmers in Oyo State, Nigeria
Socio Economic Variables of Cashew Farmers in Oyo State, NigeriaSocio Economic Variables of Cashew Farmers in Oyo State, Nigeria
Socio Economic Variables of Cashew Farmers in Oyo State, Nigeria
 
United Natural Foods - Risky But With Large Upside Potential
United Natural Foods -  Risky But With Large Upside PotentialUnited Natural Foods -  Risky But With Large Upside Potential
United Natural Foods - Risky But With Large Upside Potential
 
Sustainable Corn and Soybean Production
Sustainable Corn and Soybean ProductionSustainable Corn and Soybean Production
Sustainable Corn and Soybean Production
 
Discussion Paper_ contract services for smallholders_Lund Nov2015 Word version
Discussion Paper_ contract services for smallholders_Lund Nov2015 Word versionDiscussion Paper_ contract services for smallholders_Lund Nov2015 Word version
Discussion Paper_ contract services for smallholders_Lund Nov2015 Word version
 
Full Draft-Enhancing Farmers' Markets
Full Draft-Enhancing Farmers' MarketsFull Draft-Enhancing Farmers' Markets
Full Draft-Enhancing Farmers' Markets
 
9. Ontario Commodity Market Situation and Outlook
9. Ontario Commodity Market Situation and Outlook9. Ontario Commodity Market Situation and Outlook
9. Ontario Commodity Market Situation and Outlook
 
Mercer Capital's Value Focus: Agribusiness | Q2 2018 | Segment: Crops and Cro...
Mercer Capital's Value Focus: Agribusiness | Q2 2018 | Segment: Crops and Cro...Mercer Capital's Value Focus: Agribusiness | Q2 2018 | Segment: Crops and Cro...
Mercer Capital's Value Focus: Agribusiness | Q2 2018 | Segment: Crops and Cro...
 
Business Plan for SNAP
Business Plan for SNAPBusiness Plan for SNAP
Business Plan for SNAP
 
Keynote Address
Keynote AddressKeynote Address
Keynote Address
 
ICRISAT Research Program West and Central Africa 2016 Highlights- Moves to es...
ICRISAT Research Program West and Central Africa 2016 Highlights- Moves to es...ICRISAT Research Program West and Central Africa 2016 Highlights- Moves to es...
ICRISAT Research Program West and Central Africa 2016 Highlights- Moves to es...
 
Ne Iowa FFI Overview Driftless
Ne Iowa FFI Overview DriftlessNe Iowa FFI Overview Driftless
Ne Iowa FFI Overview Driftless
 
Natural Livestock Feasibility Study
Natural Livestock Feasibility StudyNatural Livestock Feasibility Study
Natural Livestock Feasibility Study
 
Natural Livestock Feasibility Study
Natural Livestock Feasibility StudyNatural Livestock Feasibility Study
Natural Livestock Feasibility Study
 
Natural Livestock Feasibility Study
Natural Livestock Feasibility StudyNatural Livestock Feasibility Study
Natural Livestock Feasibility Study
 

Mais de Community Food Security Coalition

Baltimore’s Food Justice Initiatives_Urban Agriculture, Virtual Supermarkets ...
Baltimore’s Food Justice Initiatives_Urban Agriculture, Virtual Supermarkets ...Baltimore’s Food Justice Initiatives_Urban Agriculture, Virtual Supermarkets ...
Baltimore’s Food Justice Initiatives_Urban Agriculture, Virtual Supermarkets ...Community Food Security Coalition
 
Baltimore’s Food Justice Initiatives: Urban Agriculture, Virtual Supermarkets...
Baltimore’s Food Justice Initiatives: Urban Agriculture, Virtual Supermarkets...Baltimore’s Food Justice Initiatives: Urban Agriculture, Virtual Supermarkets...
Baltimore’s Food Justice Initiatives: Urban Agriculture, Virtual Supermarkets...Community Food Security Coalition
 
Japan's Sustainable Food Infrastructure: Pre and Post Disaster
Japan's Sustainable Food Infrastructure: Pre and Post DisasterJapan's Sustainable Food Infrastructure: Pre and Post Disaster
Japan's Sustainable Food Infrastructure: Pre and Post DisasterCommunity Food Security Coalition
 
Growing Farm to Preschool: Bringing the “Farm” to Preschool Settings
Growing Farm to Preschool: Bringing the “Farm” to Preschool Settings Growing Farm to Preschool: Bringing the “Farm” to Preschool Settings
Growing Farm to Preschool: Bringing the “Farm” to Preschool Settings Community Food Security Coalition
 
Beyond Tokenism_Youth Leadership in the Food Justice Movment
Beyond Tokenism_Youth Leadership in the Food Justice MovmentBeyond Tokenism_Youth Leadership in the Food Justice Movment
Beyond Tokenism_Youth Leadership in the Food Justice MovmentCommunity Food Security Coalition
 
SNAP at Farmers Markets: Logistics, Policies, Partners, and Evaluating Success
SNAP at Farmers Markets: Logistics, Policies, Partners, and Evaluating SuccessSNAP at Farmers Markets: Logistics, Policies, Partners, and Evaluating Success
SNAP at Farmers Markets: Logistics, Policies, Partners, and Evaluating SuccessCommunity Food Security Coalition
 
Understanding Motivators and Evaluating SNAP/EBT Incentive Outcomes in Farmer...
Understanding Motivators and Evaluating SNAP/EBT Incentive Outcomes in Farmer...Understanding Motivators and Evaluating SNAP/EBT Incentive Outcomes in Farmer...
Understanding Motivators and Evaluating SNAP/EBT Incentive Outcomes in Farmer...Community Food Security Coalition
 

Mais de Community Food Security Coalition (20)

Baltimore’s Food Justice Initiatives_Urban Agriculture, Virtual Supermarkets ...
Baltimore’s Food Justice Initiatives_Urban Agriculture, Virtual Supermarkets ...Baltimore’s Food Justice Initiatives_Urban Agriculture, Virtual Supermarkets ...
Baltimore’s Food Justice Initiatives_Urban Agriculture, Virtual Supermarkets ...
 
Baltimore’s Food Justice Initiatives: Urban Agriculture, Virtual Supermarkets...
Baltimore’s Food Justice Initiatives: Urban Agriculture, Virtual Supermarkets...Baltimore’s Food Justice Initiatives: Urban Agriculture, Virtual Supermarkets...
Baltimore’s Food Justice Initiatives: Urban Agriculture, Virtual Supermarkets...
 
Japan's Sustainable Food Infrastructure: Pre and Post Disaster
Japan's Sustainable Food Infrastructure: Pre and Post DisasterJapan's Sustainable Food Infrastructure: Pre and Post Disaster
Japan's Sustainable Food Infrastructure: Pre and Post Disaster
 
Growing Farm to Preschool: Bringing the “Farm” to Preschool Settings
Growing Farm to Preschool: Bringing the “Farm” to Preschool Settings Growing Farm to Preschool: Bringing the “Farm” to Preschool Settings
Growing Farm to Preschool: Bringing the “Farm” to Preschool Settings
 
Beyond Tokenism_Youth Leadership in the Food Justice Movment
Beyond Tokenism_Youth Leadership in the Food Justice MovmentBeyond Tokenism_Youth Leadership in the Food Justice Movment
Beyond Tokenism_Youth Leadership in the Food Justice Movment
 
Workshop Illustration 2
Workshop Illustration 2Workshop Illustration 2
Workshop Illustration 2
 
Workshop Illustration
Workshop IllustrationWorkshop Illustration
Workshop Illustration
 
Real Food Wheel
Real Food WheelReal Food Wheel
Real Food Wheel
 
Pecan Grove Farmers Market
Pecan Grove Farmers MarketPecan Grove Farmers Market
Pecan Grove Farmers Market
 
Health Insurance Report September 2011
Health Insurance Report September 2011Health Insurance Report September 2011
Health Insurance Report September 2011
 
Farmers Market Manager FAQs 2010
Farmers Market Manager FAQs 2010Farmers Market Manager FAQs 2010
Farmers Market Manager FAQs 2010
 
Expanding Access and FM Study
Expanding Access and FM StudyExpanding Access and FM Study
Expanding Access and FM Study
 
Community Support Manual
Community Support ManualCommunity Support Manual
Community Support Manual
 
Combined Resources
Combined ResourcesCombined Resources
Combined Resources
 
SNAP at Farmers Markets: Logistics, Policies, Partners, and Evaluating Success
SNAP at Farmers Markets: Logistics, Policies, Partners, and Evaluating SuccessSNAP at Farmers Markets: Logistics, Policies, Partners, and Evaluating Success
SNAP at Farmers Markets: Logistics, Policies, Partners, and Evaluating Success
 
Stakeholder Analysis Grid
Stakeholder Analysis GridStakeholder Analysis Grid
Stakeholder Analysis Grid
 
White Privilege Unpacking The Invisible Knapsack
White Privilege Unpacking The Invisible KnapsackWhite Privilege Unpacking The Invisible Knapsack
White Privilege Unpacking The Invisible Knapsack
 
Supplementary: Visions Multicultural Guidelines
Supplementary: Visions Multicultural GuidelinesSupplementary: Visions Multicultural Guidelines
Supplementary: Visions Multicultural Guidelines
 
Supplementary: Racial Microaggressions
Supplementary: Racial MicroaggressionsSupplementary: Racial Microaggressions
Supplementary: Racial Microaggressions
 
Understanding Motivators and Evaluating SNAP/EBT Incentive Outcomes in Farmer...
Understanding Motivators and Evaluating SNAP/EBT Incentive Outcomes in Farmer...Understanding Motivators and Evaluating SNAP/EBT Incentive Outcomes in Farmer...
Understanding Motivators and Evaluating SNAP/EBT Incentive Outcomes in Farmer...
 

2010 SNAP at FMs Fact Sheet

  • 1. Supplemental Nutrition Assistance Program Fact Sheet Farmers’ Market Edition: FY 2010 Number of SNAP Authorized Farmers’ Markets Over the past five fiscal years, the number 2,400 2,200 of farmers’ markets and direct marketing 2,000 1,611 farmers increased 263%. 1,800 1,600 1,400 946 40% are open year round. 1,200 753 1,000 532 800 444 600 52% of all markets/farmers authorized are 400 found in nine states: Iowa (170), New York 200 0 (167), California (104), Michigan (82), FY 2006 FY 2007 FY 2008 FY 2009 FY 2010 Missouri (73), Oregon (69), Massachusetts (58), Washington (57), and Ohio (55). Value of Farmers’ Market SNAP Redemptions Over the past five fiscal years, redemptions increased 49%. $9,000,000 $7,547,028 $8,000,000 $7,000,000 The decrease in fiscal year 2007 redemptions $6,000,000 $3,834,875 $4,435,985 was the result of a store type re-classification $5,000,000 as SNAP corrected traditional stores $4,000,000 $2,740,236 $3,000,000 $1,620,344 mistakenly classified as farmers’ markets. $2,000,000 $1,000,000 In fiscal year 2010, program recipients made $0 453,711 purchases at farmers’ markets and FY 2006 FY 2007 FY 2008 FY 2009 FY2010 direct marketing farmers nationwide. The average purchase amount was $16.69. Key Facts about SNAP Farmers’ Market Participation More SNAP benefits were redeemed at farmers’ markets and direct marketing farmers in fiscal year 2010 during September than any other month of the year. Of the 3,153 counties in the United States, 727 (23%) have at least one SNAP authorized market or farmer. 155,759 SNAP households made at least one purchase at a farmers’ market in fiscal year 2010. Of the households shopping at farmers’ markets, they spent $48.61 on average over the course of the year. The top five busiest counties based on the number of SNAP households shopping at farmers’ markets or direct marketing farmer are: New York, NY (115,974), St. Louis, MO (14,160), Wayne, MI (15,620), Monroe, NY (4,534), and Fresno, CA (4,455). 49% of SNAP households that shopped at a farmers’ market or direct marketing farmer made one purchase, another 19% made two purchases, and 32% made three or more purchases within the year. 83% of all SNAP transactions at a market or direct marketing farmer occurred via an electronic swipe, 15% via a key entered transaction, and the remaining 2% were paper voucher authorizations. Note: In fiscal year 2010, SNAP introduced a new store type to further sub-divide participating markets into the traditional farmers’ market, such as an umbrella organization responsible for multiple market locations, and a direct marketing farmer that is an authorized individual and may also participate within a market or multiple markets. Source: Data was obtained from the Store Tracking and Redemption System and the Anti-fraud Locator using EBT Retailer Transactions. March 2011