The Secret Life of Candles

Candlestick Signals are a graphical representation of investor (or trader) sentiment for the time frame being observed. My mentor taught me this concept several years ago and it has proven to be one of the most powerful "trading truths" I have learned. Our Live Trading Room is a place for you to begin your journey as an Emini Futures Trader. We offer a 5 Day Free Trial with no CC required. You will also be able to download our Platform and install our Indicators. We will teach you in 5 days - ONE SETUP - you can use to trade - ANY MARKET! Emini Futures? Crude? Gold? Soybeans? Currencies? Stocks? Crypto? Forex? YES! - All those and more... One Setup - One Time Frame - Unlimited Opportunity. Start your Free Trial Today! http://EminiTrainingSchool.com

Recomendados
Mais conteúdo relacionado
Destaque
Último
Último (20)
The Secret Life of Candles
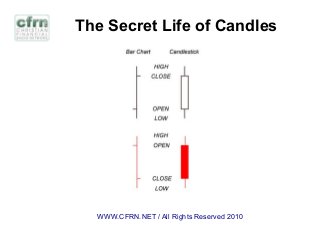
- 1. The Secret Life of Candles WWW.CFRN.NET / All Rights Reserved 2010
- 2. The Secret Life of Candles WWW.CFRN.NET / All Rights Reserved 2010 Doji Star Upon seeing a Doji in an overbought or oversold condition, an extremely high probability reversal situation becomes evident. Overbought or oversold conditions can be defined using other indicators such as stochastics, When a Doji appears, it is demonstrating that there is indecision now occurring at an extreme portion of a trend. This indecision can be portrayed in a few variations of the Doji.
- 3. The Secret Life of Candles WWW.CFRN.NET / All Rights Reserved 2010 Long-legged Doji The Long-legged Doji is composed of long upper and lower shadows. Throughout the time period, the price moved up and down dramatically before it closed at or very near the opening price. This reflects the great indecision that exists between the bulls and the bears.
- 4. The Secret Life of Candles WWW.CFRN.NET / All Rights Reserved 2010 The Gravestone Doji is formed when the open and the close occur at the low end of the trading range. The price opens at the low of the day and rallies from there, but by the close the price is beaten back down to the opening price. The Japanese analogy is that it represents those who have died in battle. The victories of the day are all lost by the end of the day. A Gravestone Doji, at the top of the trend, is a specific version of the Shooting Star. At the bottom, it is a variation of the Inverted Hammer.
- 5. The Secret Life of Candles WWW.CFRN.NET / All Rights Reserved 2010 Dragonfly Doji The Dragonfly Doji occurs when trading opens, trades lower, then closes at the open price which is the high of the day. At the top of the market, it becomes a variation of the Hanging Man. At the bottom of a trend, it becomes a specific Hammer. An extensively long shadow on a Dragonfly Doji at the bottom of a trend is very bullish.
- 6. The Secret Life of Candles WWW.CFRN.NET / All Rights Reserved 2010 Doji’s that occur in multi-signal patterns make those signals more convincing reversal signals Harami – Doji Evening Star - Abandoned Baby Having the knowledge of what a Doji represents, indecision, allows the Candlestick analyst to take advantage of reversal moves at the most opportune levels. Regardless of whether you are trading long-term holds for day trading from the one-minute, five-minute, and fifteen- minute charts, the Doji illustrates indecision in any time frame.
- 7. The Secret Life of Candles WWW.CFRN.NET / All Rights Reserved 2010 Bullish Engulfing Signal A Bullish Engulfing signal is one of the major signals. When the elements out of a Bullish Engulfing signal are broken down, an investor can clearly understand what was going on in investor sentiment to cause a reversal. 400 years of observations from Japanese Rice traders has recognized the Bullish Engulfing signal as a very high probability reversal signal.
- 8. The Secret Life of Candles WWW.CFRN.NET / All Rights Reserved 2010 Bearish Engulfing Signal The information conveyed in this signal creates an extremely high probability that the buying is over. It also reveals an opportunity for establishing a good short position.
- 9. The Secret Life of Candles WWW.CFRN.NET / All Rights Reserved 2010 The Hammer Signal One of the most visually compelling signals is the Hammer signal. The hammer signal is easily recognized by the lower shadow ( the tail ) protruding to the downside after an extended downtrend.
- 10. The Secret Life of Candles WWW.CFRN.NET / All Rights Reserved 2010 Hanging Man The Hanging Man produces some very important attributes when analyzing a potential reversal. It is considered one of the 12 major signals. Learn how to use a Hanging Man signal correctly. The probabilities of being in a correct trade when utilizing this signal becomes extremely high.
- 11. The Secret Life of Candles WWW.CFRN.NET / All Rights Reserved 2010 The Piercing Pattern Being able to utilize information that has been used successfully in the past is a much more viable investment strategy than taking shots in the dark. Keep in mind, when you are given privileged information about stock market tips, where you are in the food chain. Are you one of those privileged few that gets top-notch pertinent information on a timely manner, or you one of the masses that feed into a frenzy and allow the smart money to make the profits?
- 12. The Secret Life of Candles WWW.CFRN.NET / All Rights Reserved 2010 Dark Cloud Cover The Dark Cloud signal is a signal that tells an obvious reversal of a trend. It is named because it looks like a dark cloud over a nice bright sunny uptrend.
- 13. The Secret Life of Candles WWW.CFRN.NET / All Rights Reserved 2010 Bullish Harami The Bullish Harami is an example of visual statistical analysis. Upon witnessing a bullish Harami at the end of a downtrend, an investor has a good idea of what to expect. This major signal becomes a vital information packed analytical tool.
- 14. The Secret Life of Candles WWW.CFRN.NET / All Rights Reserved 2010 Bearish Harami The Bearish Harami is one of the major signals that exhibits common sense into graphic depiction. Candlestick analysis provides a clear understanding of what happens to investor sentiment at the reversal areas. The elements that create a Bearish Harami produce clear insights into what was going on in investor minds at a reversal.
- 15. The Secret Life of Candles WWW.CFRN.NET / All Rights Reserved 2010 The Morning Star Signal The Morning Star is a bottom reversal signal. Like the planet Mercury, the morning star, it foretells that brighter things - sunrise, is about to occur, or that prices are going to go higher. It is formed after an obvious downtrend.
- 16. The Secret Life of Candles WWW.CFRN.NET / All Rights Reserved 2010 The Evening Star pattern is a top reversal signal. It is exactly the opposite of the Morning Star signal. Like the planet Venice , the evening star, it foretells that darkness is about to set or that prices are going to go lower. It is formed after an obvious uptrend.
- 17. The Secret Life of Candles WWW.CFRN.NET / All Rights Reserved 2010 The Kicker signal is the most powerful signal of all. It works equally well in both directions. Its relevance is magnified when occurring in the overbought or oversold area. It is formed by two candles. This formation is indicative of a dramatic change in investor sentiment. The candlesticks visually depict the magnitude of the change.
- 18. The Secret Life of Candles WWW.CFRN.NET / All Rights Reserved 2010 The Shooting Star is comprised of one candle. It is easily identified by the presence of a small body with a shadow at least two times greater than the body. It is found at the top of an uptrend. The Japanese named this pattern because it looks like a shooting star falling from the sky with the tail trailing it.
- 19. The Secret Life of Candles WWW.CFRN.NET / All Rights Reserved 2010 Inverted Hammer The Inverted Hammer produces some very important attributes when analyzing a potential reversal. It is considered one of the 12 major signals. Learn how to use an inverted hammer signal correctly. The probabilities of being in a correct trade when utilizing this signal becomes extremely high.
- 20. The Secret Life of Candles WWW.CFRN.NET / All Rights Reserved 2010 30 Minute Chart 8/20/10
- 21. The Secret Life of Candles WWW.CFRN.NET / All Rights Reserved 2010 30 Minute Chart 8/20/1010K Volume Chart - 8/20/10
- 22. The Secret Life of Candles WWW.CFRN.NET / All Rights Reserved 2010