Financial Core Office Market Statistics
•
1 gostou•321 visualizações

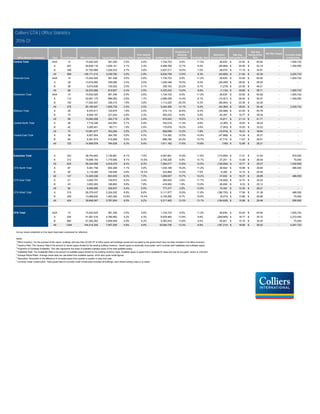
The document provides statistics on office market conditions in different submarkets in the Greater Toronto Area (GTA) during the first quarter of 2016, including: - The Financial Core submarket had 88 buildings totaling 34.5 million square feet, with a vacancy rate of 2.4% and availability rate of 9.6%. - The Downtown submarket had a total of 278 buildings containing 65.2 million square feet, with a vacancy rate of 2.5% and availability rate of 8.4%. It experienced a net absorption of -44,384 square feet during the quarter. - Average asking net and gross rents in the Downtown submarket were $28.63 and $54.46 per square foot respectively

Recomendados
Mais conteúdo relacionado
Mais procurados
Mais procurados (12)
Semelhante a Financial Core Office Market Statistics
Semelhante a Financial Core Office Market Statistics (20)
Mais de Chris Fyvie
Mais de Chris Fyvie (20)
Último
Último (20)
Financial Core Office Market Statistics
- 1. Office Market / Submarket Class # of Buildings Office Inventory Vacant Space Vacancy Rate Prior Quarter Vacancy Rate Available Space Proportion of Sublease Availability Availability Rate Absorption Current Quarter Wgt Avg. Asking Net Rent Wgt Avg. Asking Gross Rent Net New Supply Currently Under Construction Central Total AAA 14 15,542,025 381,346 2.5% 2.6% 1,734,723 9.5% 11.2% 26,630 33.92$ 63.92$ - 1,925,722 Central Total A 207 52,836,116 1,628,101 3.1% 2.3% 4,468,769 12.7% 8.5% (95,860) 20.95$ 42.19$ - 1,300,000 Central Total B 348 37,793,069 1,029,333 2.7% 3.9% 2,627,217 19.0% 7.0% 28,570 17.16$ 34.91$ - - Central Total All 569 106,171,210 3,038,780 2.9% 2.9% 8,830,709 13.9% 8.3% (40,660) 21.84$ 43.36$ - 3,225,722 Financial Core AAA 14 15,542,025 381,346 2.5% 2.6% 1,734,723 9.5% 11.2% 26,630 33.92$ 63.92$ - 1,925,722 Financial Core A 38 13,916,905 338,086 2.4% 2.0% 1,249,346 16.5% 9.0% (26,485) 28.52$ 55.52$ - - Financial Core B 36 5,074,636 100,525 2.0% 3.1% 339,163 23.2% 6.7% (1,279) 23.39$ 46.21$ - - Financial Core All 88 34,533,566 819,957 2.4% 2.5% 3,323,232 13.5% 9.6% (1,134) 30.69$ 58.71$ - 1,925,722 Downtown Total AAA 14 15,542,025 381,346 2.5% 2.6% 1,734,723 9.5% 11.2% 26,630 33.92$ 63.92$ - 1,925,722 Downtown Total A 112 32,081,175 896,083 2.8% 1.7% 2,596,258 10.4% 8.1% (14,021) 26.93$ 52.07$ - 1,300,000 Downtown Total B 152 17,542,347 328,310 1.9% 3.8% 1,113,325 20.3% 6.3% (56,993) 22.38$ 42.26$ - - Downtown Total All 278 65,165,547 1,605,739 2.5% 2.5% 5,444,306 12.1% 8.4% (44,384) 28.63$ 54.46$ - 3,225,722 Midtown Total A 29 6,470,811 124,675 1.9% 2.5% 416,110 32.6% 6.4% (30,586) 23.50$ 45.78$ - - Midtown Total B 70 8,594,197 221,044 2.6% 2.3% 500,433 8.6% 5.8% 45,397 19.77$ 39.34$ - - Midtown Total All 99 15,065,008 345,719 2.3% 2.4% 916,543 19.5% 6.1% 14,811 21.14$ 41.71$ - - Central North Total A 28 7,716,226 242,583 3.1% 2.9% 742,019 11.4% 9.6% (3,365) 18.55$ 39.22$ - - Central North Total B 42 3,265,451 60,711 1.9% 2.5% 116,679 19.2% 3.6% (7,553) 15.25$ 33.22$ - - Central North Total All 70 10,981,677 303,294 2.8% 2.7% 858,698 12.5% 7.8% (10,918) 18.23$ 38.64$ - - Central East Total A 38 6,567,904 364,760 5.6% 4.5% 714,382 10.5% 10.9% (47,888) 14.36$ 30.27$ - - Central East Total B 84 8,391,074 419,268 5.0% 6.3% 896,780 23.2% 10.7% 47,719 11.67$ 26.51$ - - Central East Total All 122 14,958,978 784,028 5.2% 5.5% 1,611,162 17.6% 10.8% (169) 12.88$ 28.21$ - - Suburban Total A 323 38,754,902 3,138,881 8.1% 7.0% 4,507,691 14.9% 11.6% (173,805) 17.21$ 31.04$ - 972,000 Suburban Total B 312 19,589,193 1,779,595 9.1% 10.9% 2,756,326 8.8% 14.1% 27,251 13.48$ 26.44$ - 70,000 Suburban Total All 635 58,344,095 4,918,476 8.4% 8.3% 7,264,017 12.6% 12.5% (146,554) 15.77$ 29.27$ - 1,042,000 GTA North Total A 87 9,281,758 654,389 7.1% 3.8% 1,035,189 16.2% 11.2% 29,542 16.98$ 29.84$ - 486,000 GTA North Total B 60 3,118,280 149,546 4.8% 16.3% 233,868 13.4% 7.5% 8,390 14.15$ 25.40$ - - GTA North Total All 147 12,400,038 803,935 6.5% 7.0% 1,269,057 15.7% 10.2% 37,932 16.37$ 28.89$ - 486,000 GTA East Total A 21 3,093,707 159,972 5.2% 3.4% 360,525 3.6% 11.7% (16,592) 14.74$ 32.22$ - - GTA East Total B 43 3,002,283 166,665 5.6% 7.8% 416,952 1.8% 13.9% 26,934 9.33$ 23.12$ - - GTA East Total All 64 6,095,990 326,637 5.4% 5.5% 777,477 2.6% 12.8% 10,342 12.36$ 28.21$ - - GTA West Total A 215 26,379,437 2,324,520 8.8% 8.6% 3,111,977 15.8% 11.8% (186,755) 17.56$ 31.38$ - 486,000 GTA West Total B 209 13,468,630 1,463,384 10.9% 10.4% 2,105,506 9.7% 15.6% (8,073) 13.86$ 26.96$ - 70,000 GTA West Total All 424 39,848,067 3,787,904 9.5% 9.2% 5,217,483 13.3% 13.1% (194,828) 15.98$ 29.49$ - 556,000 GTA Total AAA 14 15,542,025 381,346 2.5% 2.6% 1,734,723 9.5% 11.2% 26,630 33.92$ 63.92$ - 1,925,722 GTA Total A 530 91,591,018 4,766,982 5.2% 4.3% 8,976,460 13.8% 9.8% (269,665) 18.77$ 35.70$ - 2,272,000 GTA Total B 660 57,382,262 2,808,928 4.9% 6.3% 5,383,543 13.8% 9.4% 55,821 15.16$ 30.30$ - 70,000 GTA Total All 1204 164,515,305 7,957,256 4.8% 4.8% 16,094,726 13.3% 9.8% (187,214) 18.68$ 36.02$ - 4,267,722 Survey results presented on this report have been condensed for reference. Notes: 1 Office Inventory: For the purpose of this report, buildings with less than 20,000 SF of office space and buildings owned and occupied by the government have not been included in the office inventory. 2 Vacancy Rate: The Vacancy Rate is the amount of vacant space divided by the existing building inventory. Vacant space is physically unoccupied, and it includes both headlease and sublease space. 3 Proportion of Sublease Availability: This ratio represents the share of available sublease space of the total available space. 4 Availability Rate: The Availability Rate is the amount of available space divided by the building inventory base. Available space is space that is available for lease and can be occupied, vacant or unknown. 5 Average Rental Rates: Average rental rates are calculated from available spaces, which also quote rental figures. 6 Absorption: Absorption is the difference in occupied space from quarter to quarter or year-over-year. 7 Currently Under Construction: Total square feet for currently under construction includes all buildings, even where building class is un-listed. Colliers GTA | Office Statistics 2016 Q1
- 2. Office Market / Submarket Class # of Buildings Office Inventory Vacant Space Vacancy Rate Prior Quarter Vacancy Rate Available Space Proportion of Sublease Availability Availability Rate Absorption Current Quarter Wgt Avg. Asking Net Rent Wgt Avg. Asking Gross Rent Net New Supply Currently Under Construction Financial Core AAA 14 15,542,025 381,346 2.5% 2.6% 1,734,723 9.5% 11.2% 26,630 33.92$ 63.92$ - 1,925,722 Financial Core A 38 13,916,905 338,086 2.4% 2.0% 1,249,346 16.5% 9.0% (26,485) 28.52$ 55.52$ - - Financial Core B 36 5,074,636 100,525 2.0% 3.1% 339,163 23.2% 6.7% (1,279) 23.39$ 46.21$ - - Financial Core All 88 34,533,566 819,957 2.4% 2.5% 3,323,232 13.5% 9.6% (1,134) 30.69$ 58.71$ - 1,925,722 Downtown East A 12 1,154,946 6,829 0.6% 0.1% 162,613 8.6% 14.1% (5,243) 24.85$ 46.18$ - 500,000 Downtown East B 29 1,999,191 44,842 2.2% 1.7% 120,226 38.6% 6.0% (11,448) 20.33$ 38.62$ - - Downtown East All 41 3,154,137 51,671 1.6% 1.1% 282,839 21.4% 9.0% (16,691) 24.20$ 45.09$ - 500,000 Downtown North A 15 6,482,285 172,578 2.7% 2.6% 432,583 3.2% 6.7% 3,779 21.43$ 42.30$ - - Downtown North B 31 5,811,769 80,863 1.4% 1.0% 179,112 12.1% 3.1% (31,109) 18.63$ 38.39$ - - Downtown North All 46 12,294,054 253,441 2.1% 1.8% 611,695 5.8% 5.0% (27,330) 19.78$ 40.00$ - - Downtown South A 12 4,616,441 37,212 0.8% 0.8% 205,841 8.0% 4.5% 11,721 - - - 800,000 Downtown South B 3 747,135 35,462 4.7% 8.8% 86,551 10.8% 11.6% 16,550 21.16$ 38.32$ - - Downtown South All 15 5,363,576 72,674 1.4% 1.9% 292,392 8.8% 5.5% 28,271 21.16$ 38.32$ - 800,000 Downtown West A 35 5,910,598 341,378 5.8% 0.8% 545,875 3.5% 9.2% 2,207 21.46$ 41.39$ - - Downtown West B 53 3,909,616 66,618 1.7% 8.8% 388,273 18.1% 9.9% (29,707) 25.22$ 40.85$ - - Downtown West All 88 9,820,214 407,996 4.2% 4.0% 934,148 9.6% 9.5% (27,500) 24.57$ 40.94$ - - Downtown Total AAA 14 15,542,025 381,346 2.5% 2.6% 1,734,723 9.5% 11.2% 26,630 33.92$ 63.92$ - 1,925,722 Downtown Total A 112 32,081,175 896,083 2.8% 1.7% 2,596,258 10.4% 8.1% (14,021) 26.93$ 52.07$ - 1,300,000 Downtown Total B 152 17,542,347 328,310 1.9% 3.8% 1,113,325 20.3% 6.3% (56,993) 22.38$ 42.26$ - - Downtown Total All 278 65,165,547 1,605,739 2.5% 2.5% 5,444,306 12.1% 8.4% (44,384) 28.63$ 54.46$ - 3,225,722 Survey results presented on this report have been condensed for reference. Notes: 1 Office Inventory: For the purpose of this report, buildings with less than 20,000 SF of office space and buildings owned and occupied by the government have not been included in the office inventory. 2 Vacancy Rate: The Vacancy Rate is the amount of vacant space divided by the existing building inventory. Vacant space is physically unoccupied, and it includes both headlease and sublease space. 3 Proportion of Sublease Availability: This ratio represents the share of available sublease space of the total available space. 4 Availability Rate: The Availability Rate is the amount of available space divided by the building inventory base. Available space is space that is available for lease and can be occupied, vacant or unknown. 5 Average Rental Rates: Average rental rates are calculated from available spaces, which also quote rental figures. 6 Absorption: Absorption is the difference in occupied space from quarter to quarter or year-over-year. 7 Currently Under Construction: Total square feet for currently under construction includes all buildings, even where building class is un-listed. Colliers Downtown | Office Statistics 2016 Q1
- 3. Office Market / Submarket Class # of Buildings Office Inventory Vacant Space Vacancy Rate Prior Quarter Vacancy Rate Available Space Proportion of Sublease Availability Availability Rate Absorption Current Quarter Wgt Avg. Asking Net Rent Wgt Avg. Asking Gross Rent Net New Supply Currently Under Construction Yonge-Bloor A 13 4,065,692 72,476 1.8% 0.8% 211,722 26.5% 5.2% (29,958) 26.77$ 48.55$ - - Yonge-Bloor B 26 4,156,660 122,437 2.9% 2.6% 256,785 0.0% 6.2% (23,250) 20.96$ 40.76$ - - Yonge-Bloor All 39 8,222,352 194,913 2.4% 1.7% 468,507 12.0% 5.7% (53,208) 22.98$ 43.46$ - - Yonge-St.Clair A 6 896,638 18,470 2.1% 7.6% 45,475 39.3% 5.1% (4,671) 22.31$ 44.16$ - - Yonge-St.Clair B 13 1,461,453 23,460 1.6% 1.6% 95,378 8.0% 6.5% 54,423 19.50$ 39.10$ - - Yonge-St.Clair All 19 2,358,091 41,930 1.8% 3.9% 140,853 18.1% 6.0% 49,752 20.18$ 40.31$ - - Yonge-Eglinton A 9 1,469,981 33,729 2.3% 4.2% 158,913 38.8% 10.8% 4,043 18.81$ 42.00$ - - Yonge-Eglinton B 24 2,487,235 57,801 2.3% 2.0% 121,925 15.8% 4.9% 14,224 16.55$ 35.45$ - - Yonge-Eglinton All 33 3,957,216 91,530 2.3% 2.8% 280,838 28.8% 7.1% 18,267 17.68$ 38.73$ - - Toronto West A 1 38,500 - 0.0% 0.0% - 0.0% 0.0% - - - - - Toronto West B 7 488,849 17,346 3.5% 3.5% 26,345 60.3% 5.4% - - - - - Toronto West All 8 527,349 17,346 3.3% 3.3% 26,345 60.3% 5.0% - - - - - Midtown Total A 29 6,470,811 124,675 1.9% 2.5% 416,110 32.6% 6.4% (30,586) 23.50$ 45.78$ - - Midtown Total B 70 8,594,197 221,044 2.6% 2.3% 500,433 8.6% 5.8% 45,397 19.77$ 39.34$ - - Midtown Total All 99 15,065,008 345,719 2.3% 2.4% 916,543 19.5% 6.1% 14,811 21.14$ 41.71$ - - Survey results presented on this report have been condensed for reference. Notes: 1 Office Inventory: For the purpose of this report, buildings with less than 20,000 SF of office space and buildings owned and occupied by the government have not been included in the office inventory. 2 Vacancy Rate: The Vacancy Rate is the amount of vacant space divided by the existing building inventory. Vacant space is physically unoccupied, and it includes both headlease and sublease space. 3 Proportion of Sublease Availability: This ratio represents the share of available sublease space of the total available space. 4 Availability Rate: The Availability Rate is the amount of available space divided by the building inventory base. Available space is space that is available for lease and can be occupied, vacant or unknown. 5 Average Rental Rates: Average rental rates are calculated from available spaces, which also quote rental figures. 6 Absorption: Absorption is the difference in occupied space from quarter to quarter or year-over-year. 7 Currently Under Construction: Total square feet for currently under construction includes all buildings, even where building class is un-listed. Colliers Midtown | Office Statistics 2016 Q1
- 4. Office Market / Submarket Class # of Buildings Office Inventory Vacant Space Vacancy Rate Prior Quarter Vacancy Rate Available Space Proportion of Sublease Availability Availability Rate Absorption Current Quarter Wgt Avg. Asking Net Rent Wgt Avg. Asking Gross Rent Net New Supply Currently Under Construction Don Mills/Eglinton A 9 1,189,191 48,579 4.1% 3.4% 224,783 16.6% 18.9% 8,699 13.24$ 29.92$ - - Don Mills/Eglinton B 24 2,772,683 80,543 2.9% 5.2% 205,136 33.0% 7.4% 46,694 11.52$ 26.14$ - - Don Mills/Eglinton All 33 3,961,874 129,122 3.3% 4.7% 429,919 24.4% 10.9% 55,393 12.56$ 28.44$ - - Duncan Mill A 3 459,396 40,994 8.9% 8.3% 40,994 0.0% 8.9% (2,164) 14.50$ 30.11$ - - Duncan Mill B 16 1,118,208 79,078 7.1% 6.9% 98,879 1.5% 8.8% (9,317) 9.45$ 22.69$ - - Duncan Mill All 19 1,577,604 120,072 7.6% 7.3% 139,873 1.1% 8.9% (11,481) 10.94$ 24.89$ - - Consumers Road A 7 1,305,491 113,318 8.7% 4.2% 167,969 5.4% 12.9% (71,676) 12.56$ 30.29$ - - Consumers Road B 21 2,688,596 216,772 8.1% 7.2% 486,298 21.8% 18.1% (10,847) 12.31$ 28.03$ - - Consumers Road All 28 3,994,087 330,090 8.3% 6.2% 654,267 17.6% 16.4% (82,523) 12.35$ 28.32$ - - Woodbine/Steeles A 19 3,613,826 161,869 4.5% 4.4% 280,636 10.2% 7.8% 17,253 15.78$ 30.63$ - - Woodbine/Steeles B 19 1,609,299 42,875 2.7% 7.1% 106,467 31.2% 6.6% 21,189 12.22$ 25.06$ - - Woodbine/Steeles All 38 5,223,125 204,744 3.9% 5.2% 387,103 15.9% 7.4% 38,442 15.11$ 29.58$ - - Toronto East A 0 - - 0.0% 0.0% - 0.0% 0.0% - - - - - Toronto East B 4 202,288 - 0.0% 0.8% - 0.0% 0.0% - - - - - Toronto East All 4 202,288 - 0.0% 0.8% - 0.0% 0.0% - - - - - Central East Total A 38 6,567,904 364,760 5.6% 4.5% 714,382 10.5% 10.9% (47,888) 14.36$ 30.27$ - - Central East Total B 84 8,391,074 419,268 5.0% 6.3% 896,780 23.2% 10.7% 47,719 11.67$ 26.51$ - - Central East Total All 122 14,958,978 784,028 5.2% 5.5% 1,611,162 17.6% 10.8% (169) 12.88$ 28.21$ - - Survey results presented on this report have been condensed for reference. Notes: 1 Office Inventory: For the purpose of this report, buildings with less than 20,000 SF of office space and buildings owned and occupied by the government have not been included in the office inventory. 2 Vacancy Rate: The Vacancy Rate is the amount of vacant space divided by the existing building inventory. Vacant space is physically unoccupied, and it includes both headlease and sublease space. 3 Proportion of Sublease Availability: This ratio represents the share of available sublease space of the total available space. 4 Availability Rate: The Availability Rate is the amount of available space divided by the building inventory base. Available space is space that is available for lease and can be occupied, vacant or unknown. 5 Average Rental Rates: Average rental rates are calculated from available spaces, which also quote rental figures. 6 Absorption: Absorption is the difference in occupied space from quarter to quarter or year-over-year. 7 Currently Under Construction: Total square feet for currently under construction includes all buildings, even where building class is un-listed. Colliers Central East | Office Statistics 2016 Q1
- 5. Office Market / Submarket Class # of Buildings Office Inventory Vacant Space Vacancy Rate Prior Quarter Vacancy Rate Available Space Proportion of Sublease Availability Availability Rate Absorption Current Quarter Wgt Avg. Asking Net Rent Wgt Avg. Asking Gross Rent Net New Supply Currently Under Construction Yorkdale A 5 940,646 32,123 3.4% 1.3% 37,282 8.2% 4.0% (16,304) 15.99$ 34.91$ - - Yorkdale B 9 584,842 - 0.0% 0.7% 1,169 0.0% 0.2% - 14.00$ 33.20$ - - Yorkdale All 14 1,525,488 32,123 2.1% 1.0% 38,451 8.0% 2.5% (16,304) 15.92$ 34.85$ - - Dufferin/Finch A 0 - - 0.0% 0.0% - 0.0% 0.0% - - - - - Dufferin/Finch B 14 958,081 39,780 4.2% 3.6% 42,329 0.0% 4.4% (5,322) 9.25$ 25.34$ - - Dufferin/Finch All 14 958,081 39,780 4.2% 3.6% 42,329 0.0% 4.4% (5,322) 9.25$ 25.34$ - - North Yonge Corridor A 23 6,775,580 210,460 3.1% 3.1% 704,737 11.6% 10.4% 12,939 18.69$ 39.46$ - - North Yonge Corridor B 19 1,722,528 20,931 1.2% 2.4% 73,181 30.5% 4.2% (2,231) 18.23$ 37.10$ - - North Yonge Corridor All 42 8,498,108 231,391 2.7% 3.0% 777,918 13.4% 9.2% 10,708 18.66$ 39.30$ - - Central North Total A 28 7,716,226 242,583 3.1% 2.9% 742,019 11.4% 9.6% (3,365) 18.55$ 39.22$ - - Central North Total B 42 3,265,451 60,711 1.9% 2.5% 116,679 19.2% 3.6% (7,553) 15.25$ 33.22$ - - Central North Total All 70 10,981,677 303,294 2.8% 2.7% 858,698 12.5% 7.8% (10,918) 18.23$ 38.64$ - - Survey results presented on this report have been condensed for reference. Notes: 1 Office Inventory: For the purpose of this report, buildings with less than 20,000 SF of office space and buildings owned and occupied by the government have not been included in the office inventory. 2 Vacancy Rate: The Vacancy Rate is the amount of vacant space divided by the existing building inventory. Vacant space is physically unoccupied, and it includes both headlease and sublease space. 3 Proportion of Sublease Availability: This ratio represents the share of available sublease space of the total available space. 4 Availability Rate: The Availability Rate is the amount of available space divided by the building inventory base. Available space is space that is available for lease and can be occupied, vacant or unknown. 5 Average Rental Rates: Average rental rates are calculated from available spaces, which also quote rental figures. 6 Absorption: Absorption is the difference in occupied space from quarter to quarter or year-over-year. 7 Currently Under Construction: Total square feet for currently under construction includes all buildings, even where building class is un-listed. Colliers Central North | Office Statistics 2016 Q1
- 6. Office Market / Submarket Class # of Buildings Office Inventory Vacant Space Vacancy Rate Prior Quarter Vacancy Rate Available Space Proportion of Sublease Availability Availability Rate Absorption Current Quarter Wgt Avg. Asking Net Rent Wgt Avg. Asking Gross Rent Net New Supply Currently Under Construction Vaughan A 24 1,683,054 44,444 2.6% 1.4% 108,095 10.7% 6.4% 11,225 17.23$ 29.11$ - 486,000 Vaughan B 16 749,327 43,061 5.7% 10.0% 57,183 4.2% 7.6% (739) 15.93$ 24.27$ - - Vaughan All 40 2,432,381 87,505 3.6% 4.0% 165,278 8.5% 6.8% 10,486 16.73$ 27.27$ - 486,000 Richmond Hill A 2 379,319 - 0.0% 0.0% - 0.0% 0.0% - - - - - Richmond Hill B 4 166,133 2,042 1.2% 0.5% 2,042 0.0% 1.2% (1,228) 12.20$ 24.87$ - - Richmond Hill All 6 545,452 2,042 0.4% 0.1% 2,042 0.0% 0.4% (1,228) 12.20$ 24.87$ - - Hwy 404-Hwy 407 A 51 5,938,874 391,041 6.6% 4.9% 659,118 21.4% 11.1% (10,516) 17.94$ 31.87$ - - Hwy 404-Hwy 407 B 31 1,609,394 104,443 6.5% 14.1% 173,443 16.0% 10.8% 9,457 13.51$ 25.84$ - - Hwy 404-Hwy 407 All 82 7,548,268 495,484 6.6% 6.8% 832,561 20.3% 11.0% (1,059) 16.78$ 30.29$ - - Markham Town Centre A 10 1,280,511 218,904 17.1% 3.3% 267,976 5.6% 20.9% 28,833 15.27$ 26.68$ - - Markham Town Centre B 9 593,426 - 0.0% 34.8% 1,200 100.0% 0.2% 900 - - - - Markham Town Centre All 19 1,873,937 218,904 11.7% 13.3% 269,176 6.0% 14.4% 29,733 15.27$ 26.68$ - - GTA North Total A 87 9,281,758 654,389 7.1% 3.8% 1,035,189 16.2% 11.2% 29,542 16.98$ 29.84$ - 486,000 GTA North Total B 60 3,118,280 149,546 4.8% 16.3% 233,868 13.4% 7.5% 8,390 14.15$ 25.40$ - - GTA North Total All 147 12,400,038 803,935 6.5% 7.0% 1,269,057 15.7% 10.2% 37,932 16.37$ 28.89$ - 486,000 Survey results presented on this report have been condensed for reference. Notes: 1 Office Inventory: For the purpose of this report, buildings with less than 20,000 SF of office space and buildings owned and occupied by the government have not been included in the office inventory. 2 Vacancy Rate: The Vacancy Rate is the amount of vacant space divided by the existing building inventory. Vacant space is physically unoccupied, and it includes both headlease and sublease space. 3 Proportion of Sublease Availability: This ratio represents the share of available sublease space of the total available space. 4 Availability Rate: The Availability Rate is the amount of available space divided by the building inventory base. Available space is space that is available for lease and can be occupied, vacant or unknown. 5 Average Rental Rates: Average rental rates are calculated from available spaces, which also quote rental figures. 6 Absorption: Absorption is the difference in occupied space from quarter to quarter or year-over-year. 7 Currently Under Construction: Total square feet for currently under construction includes all buildings, even where building class is un-listed. Colliers GTA North | Office Statistics 2016 Q1
- 7. Office Market / Submarket Class # of Buildings Office Inventory Vacant Space Vacancy Rate Prior Quarter Vacancy Rate Available Space Proportion of Sublease Availability Availability Rate Absorption Current Quarter Wgt Avg. Asking Net Rent Wgt Avg. Asking Gross Rent Net New Supply Currently Under Construction Scarborough Town Centre A 10 2,044,570 131,079 6.4% 3.6% 318,995 4.1% 15.6% (12,713) 15.49$ 34.21$ - - Scarborough Town Centre B 29 2,320,222 120,155 5.2% 8.0% 340,503 0.9% 14.7% 21,736 8.47$ 22.94$ - - Scarborough Town Centre All 39 4,364,792 251,234 5.8% 6.0% 659,498 2.4% 15.1% 9,023 12.80$ 29.90$ - - Pickering/Oshawa A 11 1,049,137 28,893 2.8% 2.8% 41,530 0.0% 4.0% (3,879) 11.47$ 23.50$ - - Pickering/Oshawa B 14 682,061 46,510 6.8% 6.9% 76,449 5.6% 11.2% 5,198 10.86$ 23.44$ - - Pickering/Oshawa All 25 1,731,198 75,403 4.4% 4.4% 117,979 3.6% 6.8% 1,319 11.10$ 23.47$ - - GTA East Total A 21 3,093,707 159,972 5.2% 3.4% 360,525 3.6% 11.7% (16,592) 14.74$ 32.22$ - - GTA East Total B 43 3,002,283 166,665 5.6% 7.8% 416,952 1.8% 13.9% 26,934 9.33$ 23.12$ - - GTA East Total All 64 6,095,990 326,637 5.4% 5.5% 777,477 2.6% 12.8% 10,342 12.36$ 28.21$ - - Survey results presented on this report have been condensed for reference. Notes: 1 Office Inventory: For the purpose of this report, buildings with less than 20,000 SF of office space and buildings owned and occupied by the government have not been included in the office inventory. 2 Vacancy Rate: The Vacancy Rate is the amount of vacant space divided by the existing building inventory. Vacant space is physically unoccupied, and it includes both headlease and sublease space. 3 Proportion of Sublease Availability: This ratio represents the share of available sublease space of the total available space. 4 Availability Rate: The Availability Rate is the amount of available space divided by the building inventory base. Available space is space that is available for lease and can be occupied, vacant or unknown. 5 Average Rental Rates: Average rental rates are calculated from available spaces, which also quote rental figures. 6 Absorption: Absorption is the difference in occupied space from quarter to quarter or year-over-year. 7 Currently Under Construction: Total square feet for currently under construction includes all buildings, even where building class is un-listed. Colliers GTA East | Office Statistics 2016 Q1
- 8. Office Market / Submarket Class # of Buildings Office Inventory Vacant Space Vacancy Rate Prior Quarter Vacancy Rate Available Space Proportion of Sublease Availability Availability Rate Absorption Current Quarter Wgt Avg. Asking Net Rent Wgt Avg. Asking Gross Rent Net New Supply Currently Under Construction Airport Corporate Centre A 33 3,885,147 307,747 7.9% 7.6% 512,295 29.5% 13.2% 43,019 18.75$ 32.43$ - - Airport Corporate Centre B 12 725,727 24,489 3.4% 12.3% 62,987 0.0% 8.7% 9,169 11.41$ 18.47$ - - Airport Corporate Centre All 45 4,610,874 332,236 7.2% 8.3% 575,282 26.3% 12.5% 52,188 17.50$ 30.04$ - - Airport East A 9 1,108,286 349,023 31.5% 12.1% 377,948 7.3% 34.1% (108,380) 13.50$ 29.50$ - - Airport East B 32 2,176,705 293,849 13.5% 20.6% 427,143 13.7% 19.6% 47,481 11.32$ 25.03$ - - Airport East All 41 3,284,991 642,872 19.6% 17.7% 805,091 10.7% 24.5% (60,899) 11.45$ 25.29$ - - Airport West A 23 2,971,219 84,091 2.8% 3.5% 89,906 20.9% 3.0% (4,165) 13.47$ 23.21$ - - Airport West B 11 501,292 31,413 6.3% 3.1% 38,995 0.0% 7.8% - 8.68$ 22.30$ - - Airport West All 34 3,472,511 115,504 3.3% 3.4% 128,901 14.5% 3.7% (4,165) 11.78$ 22.89$ - - Brampton A 15 1,116,517 131,532 11.8% 20.4% 134,922 0.0% 12.1% 48,806 16.49$ 29.14$ - - Brampton B 13 1,777,144 78,519 4.4% 0.2% 101,858 46.6% 5.7% (26,599) 16.08$ 31.32$ - - Brampton All 28 2,893,661 210,051 7.3% 8.0% 236,780 20.1% 8.2% 22,207 16.39$ 29.70$ - - Burlington A 24 2,022,052 321,507 15.9% 12.7% 406,381 8.2% 20.1% (52,052) 17.67$ 30.39$ - - Burlington B 22 992,672 123,198 12.4% 7.9% 154,292 0.0% 15.5% (57,172) 14.10$ 23.49$ - - Burlington All 46 3,014,724 444,705 14.8% 11.1% 560,673 5.9% 18.6% (109,224) 16.72$ 28.55$ - - Cooksville A 1 98,254 3,183 3.2% 0.0% 8,931 35.6% 9.1% (3,183) 16.50$ 30.41$ - - Cooksville B 11 780,144 22,093 2.8% 2.4% 29,029 0.0% 3.7% (3,070) 14.83$ 26.22$ - - Cooksville All 12 878,398 25,276 2.9% 2.2% 37,960 8.4% 4.3% (6,253) 15.17$ 27.07$ - - Hwy 401-Hurontario A 23 3,005,516 157,603 5.2% 4.7% 178,918 13.2% 6.0% (8,723) 15.44$ 28.68$ - - Hwy 401-Hurontario B 9 542,442 81,060 14.9% 15.9% 166,944 26.7% 30.8% 5,124 15.10$ 26.38$ - 70,000 Hwy 401-Hurontario All 32 3,547,958 238,663 6.7% 6.4% 345,862 19.7% 9.7% (3,599) 15.29$ 27.70$ - 70,000 Hwy 427/Bloor/Islington A 11 1,842,315 195,022 10.6% 15.2% 304,578 8.8% 16.5% (35,413) 15.42$ 34.36$ - - Hwy 427/Bloor/Islington B 32 1,841,967 333,468 18.1% 11.3% 478,253 5.5% 26.0% (30,650) 12.49$ 29.31$ - - Hwy 427/Bloor/Islington All 43 3,684,282 528,490 14.3% 13.3% 782,831 6.8% 21.2% (66,063) 13.40$ 30.87$ - - Meadowvale A 29 4,411,360 229,270 5.2% 4.1% 370,196 37.9% 8.4% (63,150) 18.80$ 31.86$ - 250,000 Meadowvale B 23 1,392,494 264,252 19.0% 18.6% 312,895 1.0% 22.5% 9,208 16.14$ 26.69$ - - Meadowvale All 52 5,803,854 493,522 8.5% 7.6% 683,091 21.0% 11.8% (53,942) 17.45$ 29.23$ - 250,000 Mississauga City Centre A 18 3,210,418 400,655 12.5% 13.9% 449,744 5.9% 14.0% (4,656) 16.89$ 33.07$ - - Mississauga City Centre B 14 1,149,731 113,284 9.9% 6.8% 147,342 3.5% 12.8% 7,979 15.93$ 33.31$ - - Mississauga City Centre All 32 4,360,149 513,939 11.8% 12.1% 597,086 5.3% 13.7% 3,323 16.60$ 33.14$ - - Oakville A 17 1,416,792 119,097 8.4% 11.1% 203,020 12.9% 14.3% (4,769) 20.32$ 32.90$ - 236,000 Oakville B 12 685,226 72,695 10.6% 6.0% 111,030 9.2% 16.2% 2,093 15.77$ 29.56$ - - Oakville All 29 2,102,018 191,792 9.1% 9.4% 314,050 11.6% 14.9% (2,676) 18.75$ 31.75$ - 236,000 Sheridan-Winston A 12 1,291,561 25,790 2.0% 2.5% 75,138 19.1% 5.8% 5,911 19.37$ 33.72$ - - Sheridan-Winston B 18 903,086 25,064 2.8% 7.6% 74,738 12.4% 8.3% 28,364 14.61$ 26.11$ - - Sheridan-Winston All 30 2,194,647 50,854 2.3% 4.6% 149,876 15.8% 6.8% 34,275 16.78$ 29.58$ - - GTA West Total A 215 26,379,437 2,324,520 8.8% 8.6% 3,111,977 15.8% 11.8% (186,755) 17.56$ 31.38$ - 486,000 GTA West Total B 209 13,468,630 1,463,384 10.9% 10.4% 2,105,506 9.7% 15.6% (8,073) 13.86$ 26.96$ - 70,000 GTA West Total All 424 39,848,067 3,787,904 9.5% 9.2% 5,217,483 13.3% 13.1% (194,828) 15.98$ 29.49$ - 556,000 Survey results presented on this report have been condensed for reference. Notes: 1 Office Inventory: For the purpose of this report, buildings with less than 20,000 SF of office space and buildings owned and occupied by the government have not been included in the office inventory. 2 Vacancy Rate: The Vacancy Rate is the amount of vacant space divided by the existing building inventory. Vacant space is physically unoccupied, and it includes both headlease and sublease space. 3 Proportion of Sublease Availability: This ratio represents the share of available sublease space of the total available space. 4 Availability Rate: The Availability Rate is the amount of available space divided by the building inventory base. Available space is space that is available for lease and can be occupied, vacant or unknown. 5 Average Rental Rates: Average rental rates are calculated from available spaces, which also quote rental figures. 6 Absorption: Absorption is the difference in occupied space from quarter to quarter or year-over-year. 7 Currently Under Construction: Total square feet for currently under construction includes all buildings, even where building class is un-listed. Colliers GTA West | Office Statistics 2016 Q1