Commercial Real Estate Apartment sector 2001-2009
•
0 gostou•107 visualizações

As part of Coldwell Banker Commercial's Review of Commercial Real Estate in the first decade of the 2000s, this part examines the Apartment Sector with key transactions, vacancy rates and happenings during each year.

Recomendados
Recomendados
Mais conteúdo relacionado
Mais de Coldwell Banker Commercial
Mais de Coldwell Banker Commercial (20)
Commercial Real Estate Apartment sector 2001-2009
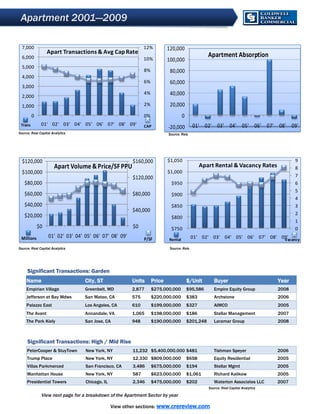
- 1. Apartment 2001—2009 7,000 12% 120,000 Apart Transactions & Avg Cap Rate 6,000 10% Apartment Absorption 100,000 5,000 8% 80,000 4,000 6% 60,000 3,000 2,000 4% 40,000 1,000 2% 20,000 0 0% 0 Trans 01' 02' 03' 04' 05' 06' 07' 08' 09' CAP 01' 02' 03' 04' 05' 06' 07' 08' 09' -20,000 Source: Real Capital Analytics Source: Reis $120,000 $160,000 $1,050 9 Apart Volume & Price/SF PPU Apart Rental & Vacancy Rates 8 $100,000 $1,000 $120,000 7 $80,000 $950 6 5 $60,000 $80,000 $900 4 $40,000 $850 3 $40,000 $20,000 2 $800 1 $0 $0 $750 0 Millions 01' 02' 03' 04' 05' 06' 07' 08' 09' P/SF 01' 02' 03' 04' 05' 06' 07' 08' 09' Rental Vacancy Source: Real Capital Analytics Source: Reis Significant Transactions: Garden Name City, ST Units Price $/Unit Buyer Year Empirian Village Greenbelt, MD 2,877 $275,000,000 $95,586 Empire Equity Group 2008 Jefferson at Bay Mdws San Mateo, CA 575 $220,000,000 $383 Archstone 2006 Palazzo East Los Angeles, CA 610 $199,000,000 $327 AIMCO 2005 The Avant Annandale, VA 1,065 $198,000,000 $186 Stellar Management 2007 The Park Kiely San Jose, CA 948 $190,000,000 $201,248 Laramar Group 2008 Significant Transactions: High / Mid Rise PeterCooper & StuyTown New York, NY 11,232 $5,400,000,000 $481 Tishman Speyer 2006 Trump Place New York, NY 12,330 $809,000,000 $658 Equity Residential 2005 Villas Parkmerced San Francisco, CA 3,486 $675,000,000 $194 Stellar Mgmt 2005 Manhattan House New York, NY 587 $623,000,000 $1,061 Richard Kalikow 2005 Presidential Towers Chicago, IL 2,346 $475,000,000 $202 Waterton Associates LLC 2007 Source: Real Capital Analytics View next page for a breakdown of the Apartment Sector by year View other sections: www.crereview.com
- 2. Apartment Breakdown View other sections: www.crereview.com