
Recomendados
Recomendados
Mais conteúdo relacionado
Destaque
Destaque (13)
Último
Último (20)
San Diego Weekly Real Estate Market Report For Home Price and Values. San Diego Homes by Zip Codes
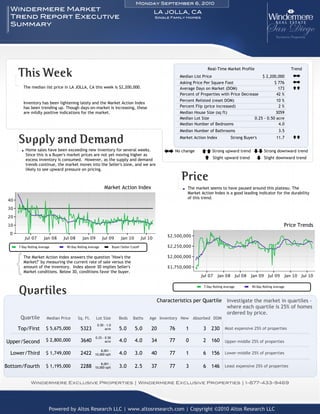
- 1. Monday September 6, 2010 Windermere Market LA JOLLA, CA Trend Report Executive Single Family Homes Summary This Week Real-Time Market Profile Trend Median List Price $ 2,200,000 ±+ Asking Price Per Square Foot $ 776 ±+ The median list price in LA JOLLA, CA this week is $2,200,000. Average Days on Market (DOM) 173 == Percent of Properties with Price Decrease 42 % Percent Relisted (reset DOM) 10 % Inventory has been lightening lately and the Market Action Index has been trending up. Though days-on-market is increasing, these Percent Flip (price increased) 2% are mildly positive indications for the market. Median House Size (sq ft) 3059 Median Lot Size 0.25 - 0.50 acre Median Number of Bedrooms 4.0 Median Number of Bathrooms 3.5 Supply and Demand Market Action Index Strong Buyer's 11.7 == Home sales have been exceeding new inventory for several weeks. ±+ No change == Strong upward trend ≠≠ Strong downward trend Since this is a Buyer's market prices are not yet moving higher as excess inventory is consumed. However, as the supply and demand = Slight upward trend ≠ Slight downward trend trends continue, the market moves into the Seller's zone, and we are likely to see upward pressure on pricing. Price Market Action Index The market seems to have paused around this plateau. The Market Action Index is a good leading indicator for the durability of this trend. Price Trends 7-Day Rolling Average 90-Day Rolling Average Buyer/Seller Cutoff The Market Action Index answers the question "How's the Market?" by measuring the current rate of sale versus the amount of the inventory. Index above 30 implies Seller's Market conditions. Below 30, conditions favor the buyer. Quartiles 7-Day Rolling Average 90-Day Rolling Average Characteristics per Quartile Investigate the market in quartiles - where each quartile is 25% of homes ordered by price. Quartile Median Price Sq. Ft. Lot Size Beds Baths Age Inventory New Absorbed DOM 0.50 - 1.0 Top/First $ 5,675,000 5323 acre 5.0 5.0 20 76 1 3 230 Most expensive 25% of properties 0.25 - 0.50 Upper/Second $ 2,800,000 3640 acre 4.0 4.0 34 77 0 2 160 Upper-middle 25% of properties 8,001 - Lower/Third $ 1,749,000 2422 10,000 sqft 4.0 3.0 40 77 1 6 156 Lower-middle 25% of properties 8,001 - Bottom/Fourth $ 1,195,000 2288 10,000 sqft 3.0 2.5 37 77 3 6 146 Least expensive 25% of properties Windermere Exclusive Properties | Windermere Exclusive Properties | 1-877-433-9469 Powered by Altos Research LLC | www.altosresearch.com | Copyright ©2010 Altos Research LLC
- 2. Monday September 6, 2010 Windermere Market SAN DIEGO, CA 92130 Trend Report Executive Single Family Homes Summary This Week Real-Time Market Profile Trend Median List Price $ 1,162,000 ±+ Asking Price Per Square Foot $ 360 ±+ The median list price in SAN DIEGO, CA 92130 this week is Average Days on Market (DOM) 115 == $1,162,000. Percent of Properties with Price Decrease 45 % Percent Relisted (reset DOM) 16 % Inventory has been lightening lately and the Market Action Index has been trending up. Though days-on-market is increasing, these Percent Flip (price increased) 4% are mildly positive indications for the market. Median House Size (sq ft) 3476 Median Lot Size 8,001 - 10,000 sqft Median Number of Bedrooms 5.0 Median Number of Bathrooms 4.0 Supply and Demand Market Action Index Strong Buyer's 17.8 == Home sales have been exceeding new inventory for several weeks. ±+ No change == Strong upward trend ≠≠ Strong downward trend Since this is a Buyer's market prices are not yet moving higher as excess inventory is consumed. However, as the supply and demand = Slight upward trend ≠ Slight downward trend trends continue, the market moves into the Seller's zone, and we are likely to see upward pressure on pricing. Price Market Action Index Recently prices in this zip have settled at a plateau even though they dipped this week. Look for a persistent up-shift in the Market Action Index before we see prices significantly move from these levels. Price Trends 7-Day Rolling Average 90-Day Rolling Average Buyer/Seller Cutoff The Market Action Index answers the question "How's the Market?" by measuring the current rate of sale versus the amount of the inventory. Index above 30 implies Seller's Market conditions. Below 30, conditions favor the buyer. Quartiles 7-Day Rolling Average 90-Day Rolling Average Characteristics per Quartile Investigate the market in quartiles - where each quartile is 25% of homes ordered by price. Quartile Median Price Sq. Ft. Lot Size Beds Baths Age Inventory New Absorbed DOM 0.50 - 1.0 Top/First $ 2,612,500 5963 acre 5.0 5.5 6 48 1 0 174 Most expensive 25% of properties 6,501 - Upper/Second $ 1,299,500 3708 8,000 sqft 5.0 4.5 9 48 0 6 131 Upper-middle 25% of properties 6,501 - Lower/Third $ 949,876 2935 8,000 sqft 5.0 3.5 10 49 4 5 84 Lower-middle 25% of properties 4,501 - Bottom/Fourth $ 739,000 2008 6,500 sqft 4.0 2.5 12 49 4 2 71 Least expensive 25% of properties Windermere Exclusive Properties | Windermere Exclusive Properties | 1-877-433-9469 Powered by Altos Research LLC | www.altosresearch.com | Copyright ©2010 Altos Research LLC
- 3. Monday September 6, 2010 Windermere Market SAN DIEGO, CA 92129 Trend Report Executive Single Family Homes Summary This Week Real-Time Market Profile Trend Median List Price $ 579,000 ±+ Asking Price Per Square Foot $ 280 ±+ The median list price in SAN DIEGO, CA 92129 this week is Average Days on Market (DOM) 84 ±+ $579,000. Percent of Properties with Price Decrease 50 % Percent Relisted (reset DOM) 9% Demand measured by the Market Action Index is increasing and days-on-market is holding steady. With more properties coming Percent Flip (price increased) 2% available, conditions are mildly positive. Median House Size (sq ft) 2162 Median Lot Size 4,501 - 6,500 sqft Median Number of Bedrooms 4.0 Median Number of Bathrooms 2.5 Supply and Demand Market Action Index Strong Buyer's 17.1 == Home sales have been exceeding new inventory for several weeks. ±+ No change == Strong upward trend ≠≠ Strong downward trend Since this is a Buyer's market prices are not yet moving higher as excess inventory is consumed. However, as the supply and demand = Slight upward trend ≠ Slight downward trend trends continue, the market moves into the Seller's zone, and we are likely to see upward pressure on pricing. Price Market Action Index We continue to see prices in this zip code bouncing around this plateau. Look for a persistent up-shift in the Market Action Index before we see prices move from these levels. Price Trends 7-Day Rolling Average 90-Day Rolling Average Buyer/Seller Cutoff The Market Action Index answers the question "How's the Market?" by measuring the current rate of sale versus the amount of the inventory. Index above 30 implies Seller's Market conditions. Below 30, conditions favor the buyer. Quartiles 7-Day Rolling Average 90-Day Rolling Average Characteristics per Quartile Investigate the market in quartiles - where each quartile is 25% of homes ordered by price. Quartile Median Price Sq. Ft. Lot Size Beds Baths Age Inventory New Absorbed DOM 6,501 - Top/First $ 739,000 2683 8,000 sqft 5.0 3.0 14 35 5 4 76 Most expensive 25% of properties 4,501 - Upper/Second $ 619,000 2241 6,500 sqft 4.0 2.5 23 35 2 1 78 Upper-middle 25% of properties 4,501 - Lower/Third $ 549,900 1977 6,500 sqft 4.0 2.5 27 35 5 7 92 Lower-middle 25% of properties 4,501 - Bottom/Fourth $ 471,950 1528 6,500 sqft 3.0 2.0 32 36 1 4 89 Least expensive 25% of properties Windermere Exclusive Properties | Windermere Exclusive Properties | 1-877-433-9469 Powered by Altos Research LLC | www.altosresearch.com | Copyright ©2010 Altos Research LLC
- 4. Monday September 6, 2010 Windermere Market SAN DIEGO, CA 92128 - Trend Report Executive Single Family Homes Summary This Week Real-Time Market Profile Trend Median List Price $ 577,250 ±+ Asking Price Per Square Foot $ 288 ±+ The median list price in SAN DIEGO, CA 92128 - Rancho Bernardo Average Days on Market (DOM) 103 == this week is $577,250. Percent of Properties with Price Decrease 50 % Percent Relisted (reset DOM) 6% Even though the days-on-market is trending higher, so is the Market Action Index at these inventory levels, providing a neutral outlook Percent Flip (price increased) 4% for the market. Median House Size (sq ft) 1990 Median Lot Size 6,501 - 8,000 sqft Median Number of Bedrooms 3.5 Median Number of Bathrooms 2.5 Supply and Demand Market Action Index Strong Buyer's 17.1 == Home sales have been exceeding new inventory for several weeks. ±+ No change == Strong upward trend ≠≠ Strong downward trend Since this is a Buyer's market prices are not yet moving higher as excess inventory is consumed. However, as the supply and demand = Slight upward trend ≠ Slight downward trend trends continue, the market moves into the Seller's zone, and we are likely to see upward pressure on pricing. Price Market Action Index We continue to see prices in this zip code bouncing around this plateau. Look for a persistent up-shift in the Market Action Index before we see prices move from these levels. Price Trends 7-Day Rolling Average 90-Day Rolling Average Buyer/Seller Cutoff The Market Action Index answers the question "How's the Market?" by measuring the current rate of sale versus the amount of the inventory. Index above 30 implies Seller's Market conditions. Below 30, conditions favor the buyer. Quartiles 7-Day Rolling Average 90-Day Rolling Average Characteristics per Quartile Investigate the market in quartiles - where each quartile is 25% of homes ordered by price. Quartile Median Price Sq. Ft. Lot Size Beds Baths Age Inventory New Absorbed DOM 0.25 - 0.50 Top/First $ 899,000 3179 acre 4.0 3.0 23 39 0 3 142 Most expensive 25% of properties 6,501 - Upper/Second $ 600,876 2104 8,000 sqft 4.0 2.5 21 39 2 5 92 Upper-middle 25% of properties 6,501 - Lower/Third $ 539,000 1813 8,000 sqft 3.0 2.5 23 39 4 2 80 Lower-middle 25% of properties 6,501 - Bottom/Fourth $ 420,000 1450 8,000 sqft 2.0 2.0 38 39 2 6 98 Least expensive 25% of properties Windermere Exclusive Properties | Windermere Exclusive Properties | 1-877-433-9469 Powered by Altos Research LLC | www.altosresearch.com | Copyright ©2010 Altos Research LLC
- 5. Monday September 6, 2010 Windermere Market SAN DIEGO, CA 92127 - Trend Report Executive Single Family Homes Summary This Week Real-Time Market Profile Trend Median List Price $ 895,000 ±+ Asking Price Per Square Foot $ 285 ±+ The median list price in SAN DIEGO, CA 92127 - Rancho Bernardo Average Days on Market (DOM) 112 ±+ this week is $895,000. Percent of Properties with Price Decrease 35 % Percent Relisted (reset DOM) 8% Inventory has been lightening lately and the Market Action Index has been trending up. These are mildly positive indications for the Percent Flip (price increased) 5% market. Median House Size (sq ft) 3525 Median Lot Size 0.25 - 0.50 acre Median Number of Bedrooms 4.0 Median Number of Bathrooms 3.5 Supply and Demand Market Action Index Strong Buyer's 16.8 == Home sales have been exceeding new inventory for several weeks. ±+ No change == Strong upward trend ≠≠ Strong downward trend Since this is a Buyer's market prices are not yet moving higher as excess inventory is consumed. However, as the supply and demand = Slight upward trend ≠ Slight downward trend trends continue, the market moves into the Seller's zone, and we are likely to see upward pressure on pricing. Price Market Action Index We continue to see prices in this zip code bouncing around this plateau. Look for a persistent up-shift in the Market Action Index before we see prices move from these levels. Price Trends 7-Day Rolling Average 90-Day Rolling Average Buyer/Seller Cutoff The Market Action Index answers the question "How's the Market?" by measuring the current rate of sale versus the amount of the inventory. Index above 30 implies Seller's Market conditions. Below 30, conditions favor the buyer. Quartiles 7-Day Rolling Average 90-Day Rolling Average Characteristics per Quartile Investigate the market in quartiles - where each quartile is 25% of homes ordered by price. Quartile Median Price Sq. Ft. Lot Size Beds Baths Age Inventory New Absorbed DOM 1.0 - 2.5 Top/First $ 2,599,999 5825 acres 5.0 5.5 4 59 3 1 141 Most expensive 25% of properties 0.25 - 0.50 Upper/Second $ 1,246,500 4021 acre 5.0 4.5 6 60 2 3 109 Upper-middle 25% of properties 6,501 - Lower/Third $ 744,250 3116 8,000 sqft 4.0 3.5 4 60 3 4 96 Lower-middle 25% of properties 4,501 - Bottom/Fourth $ 529,500 1930 6,500 sqft 4.0 2.5 20 60 6 9 103 Least expensive 25% of properties Windermere Exclusive Properties | Windermere Exclusive Properties | 1-877-433-9469 Powered by Altos Research LLC | www.altosresearch.com | Copyright ©2010 Altos Research LLC
- 6. Monday September 6, 2010 Windermere Market SAN DIEGO, CA 92126 Trend Report Executive Single Family Homes Summary This Week Real-Time Market Profile Trend Median List Price $ 394,900 ±+ Asking Price Per Square Foot $ 259 ±+ The median list price in SAN DIEGO, CA 92126 this week is Average Days on Market (DOM) 100 ±+ $394,900. Percent of Properties with Price Decrease 42 % Percent Relisted (reset DOM) 5% With inventory and days-on-market basically unchanged and the Market Action Index increasing, the market is not sending strong Percent Flip (price increased) 11 % directional signal for the near-term outlook. Median House Size (sq ft) 1458 Median Lot Size 4,501 - 6,500 sqft Median Number of Bedrooms 4.0 Median Number of Bathrooms 2.0 Supply and Demand Market Action Index Strong Buyer's 16.8 == Home sales have been exceeding new inventory for several weeks. ±+ No change == Strong upward trend ≠≠ Strong downward trend Since this is a Buyer's market prices are not yet moving higher as excess inventory is consumed. However, as the supply and demand = Slight upward trend ≠ Slight downward trend trends continue, the market moves into the Seller's zone, and we are likely to see upward pressure on pricing. Price Market Action Index We continue to see prices in this zip code bouncing around this plateau. Look for a persistent up-shift in the Market Action Index before we see prices move from these levels. Price Trends 7-Day Rolling Average 90-Day Rolling Average Buyer/Seller Cutoff The Market Action Index answers the question "How's the Market?" by measuring the current rate of sale versus the amount of the inventory. Index above 30 implies Seller's Market conditions. Below 30, conditions favor the buyer. Quartiles 7-Day Rolling Average 90-Day Rolling Average Characteristics per Quartile Investigate the market in quartiles - where each quartile is 25% of homes ordered by price. Quartile Median Price Sq. Ft. Lot Size Beds Baths Age Inventory New Absorbed DOM 4,501 - Top/First $ 475,000 1947 6,500 sqft 4.0 2.5 24 36 1 2 73 Most expensive 25% of properties 4,501 - Upper/Second $ 415,000 1616 6,500 sqft 4.0 2.0 37 37 2 6 99 Upper-middle 25% of properties 4,501 - Lower/Third $ 368,000 1405 6,500 sqft 3.0 2.0 37 37 1 2 106 Lower-middle 25% of properties 4,501 - Bottom/Fourth $ 320,000 1250 6,500 sqft 3.0 2.0 37 37 2 4 123 Least expensive 25% of properties Windermere Exclusive Properties | Windermere Exclusive Properties | 1-877-433-9469 Powered by Altos Research LLC | www.altosresearch.com | Copyright ©2010 Altos Research LLC
- 7. Monday September 6, 2010 Windermere Market POWAY, CA Trend Report Executive Single Family Homes Summary This Week Real-Time Market Profile Trend Median List Price $ 699,000 ±+ Asking Price Per Square Foot $ 288 ±+ The median list price in POWAY, CA this week is $699,000. Average Days on Market (DOM) 120 == Percent of Properties with Price Decrease 53 % Percent Relisted (reset DOM) 12 % Inventory has been decreasing lately but the Market Action Index is falling also. With days-on-market climbing, these are relatively Percent Flip (price increased) 4% negative implications for the market. Median House Size (sq ft) 2402 Median Lot Size 0.50 - 1.0 acre Median Number of Bedrooms 4.0 Median Number of Bathrooms 2.5 Supply and Demand Market Action Index Strong Buyer's 14.1 ≠≠ The Market Action Index has been trending lower for several weeks ±+ No change == Strong upward trend ≠≠ Strong downward trend while prices have remained relatively stable. If inventory continues to grow relative to demand however, it is likely that we will see = Slight upward trend ≠ Slight downward trend downward pressure on pricing. Price Market Action Index The market seems to have paused around this plateau. The Market Action Index is a good leading indicator for the durability of this trend. Price Trends 7-Day Rolling Average 90-Day Rolling Average Buyer/Seller Cutoff The Market Action Index answers the question "How's the Market?" by measuring the current rate of sale versus the amount of the inventory. Index above 30 implies Seller's Market conditions. Below 30, conditions favor the buyer. Quartiles 7-Day Rolling Average 90-Day Rolling Average Characteristics per Quartile Investigate the market in quartiles - where each quartile is 25% of homes ordered by price. Quartile Median Price Sq. Ft. Lot Size Beds Baths Age Inventory New Absorbed DOM 1.0 - 2.5 Top/First $ 1,525,000 4916 acres 5.0 4.5 15 69 1 4 159 Most expensive 25% of properties 0.50 - 1.0 Upper/Second $ 881,800 3085 acre 4.0 3.0 23 69 1 4 112 Upper-middle 25% of properties 0.25 - 0.50 Lower/Third $ 560,000 1955 acre 4.0 2.0 32 69 5 4 106 Lower-middle 25% of properties 6,501 - Bottom/Fourth $ 387,350 1451 8,000 sqft 4.0 2.0 39 70 4 6 103 Least expensive 25% of properties Windermere Exclusive Properties | Windermere Exclusive Properties | 1-877-433-9469 Powered by Altos Research LLC | www.altosresearch.com | Copyright ©2010 Altos Research LLC
- 8. Monday September 6, 2010 Windermere Market OCEANSIDE, CA Trend Report Executive Single Family Homes Summary This Week Real-Time Market Profile Trend Median List Price $ 359,900 ±+ Asking Price Per Square Foot $ 200 ±+ The median list price in OCEANSIDE, CA this week is $359,900. Average Days on Market (DOM) 111 ±+ Percent of Properties with Price Decrease 42 % Percent Relisted (reset DOM) 11 % With inventory and days-on-market basically unchanged and the Market Action Index decreasing, the market is not sending strong Percent Flip (price increased) 10 % directional signal for the near-term outlook. Median House Size (sq ft) 1762 Median Lot Size 6,501 - 8,000 sqft Median Number of Bedrooms 3.0 Median Number of Bathrooms 2.5 Supply and Demand Market Action Index Strong Buyer's 17.0 ≠≠ The Market Action Index has been trending lower for several weeks ±+ No change == Strong upward trend ≠≠ Strong downward trend while prices have remained relatively stable. If inventory continues to grow relative to demand however, it is likely that we will see = Slight upward trend ≠ Slight downward trend downward pressure on pricing. Price Market Action Index The market seems to have paused around this plateau. The Market Action Index is a good leading indicator for the durability of this trend. Price Trends 7-Day Rolling Average 90-Day Rolling Average Buyer/Seller Cutoff The Market Action Index answers the question "How's the Market?" by measuring the current rate of sale versus the amount of the inventory. Index above 30 implies Seller's Market conditions. Below 30, conditions favor the buyer. Quartiles 7-Day Rolling Average 90-Day Rolling Average Characteristics per Quartile Investigate the market in quartiles - where each quartile is 25% of homes ordered by price. Quartile Median Price Sq. Ft. Lot Size Beds Baths Age Inventory New Absorbed DOM 6,501 - Top/First $ 589,900 2374 8,000 sqft 4.0 3.0 20 165 8 10 118 Most expensive 25% of properties 4,501 - Upper/Second $ 399,994 2161 6,500 sqft 4.0 2.5 19 166 9 14 111 Upper-middle 25% of properties 4,501 - Lower/Third $ 329,000 1624 6,500 sqft 3.0 2.2 23 166 13 15 103 Lower-middle 25% of properties 4,501 - Bottom/Fourth $ 228,500 1190 6,500 sqft 3.0 2.0 36 166 8 12 111 Least expensive 25% of properties Windermere Exclusive Properties | Windermere Exclusive Properties | 1-877-433-9469 Powered by Altos Research LLC | www.altosresearch.com | Copyright ©2010 Altos Research LLC
- 9. Monday September 6, 2010 Windermere Market SAN DIEGO, CA 92131 Trend Report Executive Single Family Homes Summary This Week Real-Time Market Profile Trend Median List Price $ 747,000 ±+ Asking Price Per Square Foot $ 272 ±+ The median list price in SAN DIEGO, CA 92131 this week is Average Days on Market (DOM) 97 ±+ $747,000. Percent of Properties with Price Decrease 52 % Percent Relisted (reset DOM) 10 % The Market Action Index has been trending down lately, while inventory is climbing. These trends imply a weakening market. Percent Flip (price increased) 3% Median House Size (sq ft) 2870 Median Lot Size 8,001 - 10,000 sqft Median Number of Bedrooms 4.0 Median Number of Bathrooms 3.0 Supply and Demand Market Action Index Strong Buyer's 15.2 ≠≠ The Market Action Index has been trending lower for several weeks ±+ No change == Strong upward trend ≠≠ Strong downward trend while prices have remained relatively stable. If inventory continues to grow relative to demand however, it is likely that we will see = Slight upward trend ≠ Slight downward trend downward pressure on pricing. Price Market Action Index We continue to see prices in this zip code bouncing around this plateau. Look for a persistent up-shift in the Market Action Index before we see prices move from these levels. Price Trends 7-Day Rolling Average 90-Day Rolling Average Buyer/Seller Cutoff The Market Action Index answers the question "How's the Market?" by measuring the current rate of sale versus the amount of the inventory. Index above 30 implies Seller's Market conditions. Below 30, conditions favor the buyer. Quartiles 7-Day Rolling Average 90-Day Rolling Average Characteristics per Quartile Investigate the market in quartiles - where each quartile is 25% of homes ordered by price. Quartile Median Price Sq. Ft. Lot Size Beds Baths Age Inventory New Absorbed DOM 0.25 - 0.50 Top/First $ 995,000 4010 acre 5.0 4.0 5 37 3 4 122 Most expensive 25% of properties 8,001 - Upper/Second $ 799,000 3185 10,000 sqft 5.0 3.0 10 37 3 2 77 Upper-middle 25% of properties 6,501 - Lower/Third $ 680,000 2523 8,000 sqft 4.0 2.5 15 37 0 2 87 Lower-middle 25% of properties 6,501 - Bottom/Fourth $ 545,000 1846 8,000 sqft 3.0 2.5 17 37 2 1 102 Least expensive 25% of properties Windermere Exclusive Properties | Windermere Exclusive Properties | 1-877-433-9469 Powered by Altos Research LLC | www.altosresearch.com | Copyright ©2010 Altos Research LLC