(Spring 2013) Detecting the Human Biometric Sensor Interaction with Microsoft Kinect
•
0 gostou•521 visualizações

This project was designed to create a program that can read data that has been captured from a Kinect camera into an excel worksheet. Then from the excel worksheet, display a linear graph that represents the distance from the camera the user’s head was located. This can be used to closely look over if an individual was the correct distance from the iris camera. This is important when trying to determine the cause of a unsuccessful capture of the iris, because you can determine if it was a human error rather than a device error.

Recomendados
Mais conteúdo relacionado
Mais de International Center for Biometric Research
Mais de International Center for Biometric Research (20)
(Spring 2013) Detecting the Human Biometric Sensor Interaction with Microsoft Kinect
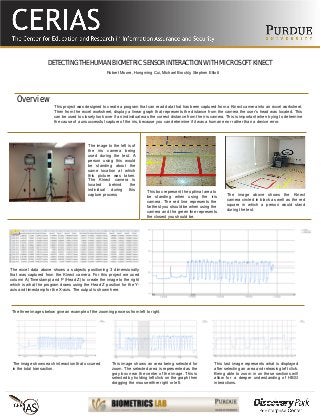
- 1. DETECTING THE HUMAN BIOMETRIC SENSOR INTERACTION WITH MICROSOFT KINECT This project was designed to create a program that can read data that has been captured from a Kinect camera into an excel worksheet. Then from the excel worksheet, display a linear graph that represents the distance from the camera the user’s head was located. This can be used to closely look over if an individual was the correct distance from the iris camera. This is important when trying to determine the cause of a unsuccessful capture of the iris, because you can determine if it was a human error rather than a device error. Robert Moore, Hongming Cui, Michael Brockly, Stephen Elliott Overview The image to the left is of the iris camera being used during the test. A person using this would be standing about the same location at which this picture was taken. The Kinect camera is located behind the individual during this capture process This box represent the optimal area to be standing when using the iris camera. The red line represents the farthest you should be when using the camera and the green line represents the closest you should be. The image above shows the Kinect camera circled in black as well as the red square in which a person would stand during the test. This image shows an area being selected for zoom. The selected area is represented as the gray box near the center of the image. This is selected by holding left click on the graph then dragging the mouse either right or left. The excel data above shows a subjects positioning 3 dimensionally that was captured from the Kinect camera. For this project we used column A (Timestamp) and P (Head Z) to create the image to the right which is what the program draws using the Head Z position for the Y- axis and timestamp for the X-axis. The output is shown here. The image shows each interaction that occurred in the total transaction. This last image represents what is displayed after selecting an area and releasing left click. Being able to zoom in on these sections will allow for a deeper understanding of HBSI interactions. The three images below give an example of the zooming process from left to right.