(Fall 2012) The Effects of User Characteristics on Iris Capture
•
0 gostou•171 visualizações

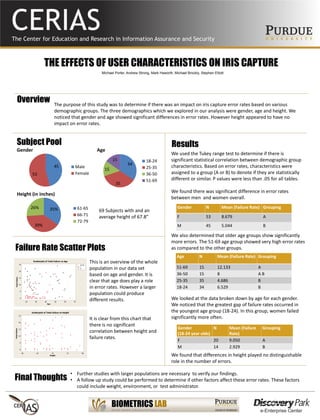
The purpose of this study was to determine if there was an impact on iris capture error rates based on various demographic groups. The three demographics which we explored in our analysis were gender, age and height. We noticed that gender and age showed significant differences in error rates. However height appeared to have no impact on error rates.
Recomendados

Recomendados
Mais conteúdo relacionado
Semelhante a (Fall 2012) The Effects of User Characteristics on Iris Capture
Semelhante a (Fall 2012) The Effects of User Characteristics on Iris Capture (20)
Mais de International Center for Biometric Research
Mais de International Center for Biometric Research (20)
Último
Último (20)
(Fall 2012) The Effects of User Characteristics on Iris Capture
- 1. THE EFFECTS OF USER CHARACTERISTICS ON IRIS CAPTURE The purpose of this study was to determine if there was an impact on iris capture error rates based on various demographic groups. The three demographics which we explored in our analysis were gender, age and height. We noticed that gender and age showed significant differences in error rates. However height appeared to have no impact on error rates. Michael Porter, Andrew Strong, Mark Haworth, Michael Brockly, Stephen Elliott Overview Subject Pool Gender Age Height (in inches) 45 53 Male Female 34 35 15 15 18-24 25-35 36-50 51-69 We used the Tukey range test to determine if there is significant statistical correlation between demographic group characteristics. Based on error rates, characteristics were assigned to a group (A or B) to denote if they are statistically different or similar. P values were less than .05 for all tables. We found there was significant difference in error rates between men and women overall. We also determined that older age groups show significantly more errors. The 51-69 age group showed very high error rates as compared to the other groups. We looked at the data broken down by age for each gender. We noticed that the greatest gap of failure rates occurred in the youngest age group (18-24). In this group, women failed significantly more often. We found that differences in height played no distinguishable role in the number of errors. Gender N Mean (Failure Rate) Grouping F 53 8.679 A M 45 5.044 B Age N Mean (Failure Rate) Grouping 51-69 15 12.133 A 36-50 15 8 A B 25-35 35 4.686 B 18-24 34 6.529 B Gender (18-24 year olds) N Mean (Failure Rate) Grouping F 20 9.050 A M 14 2.929 B Results This is an overview of the whole population in our data set based on age and gender. It is clear that age does play a role in error rates. However a larger population could produce different results. It is clear from this chart that there is no significant correlation between height and failure rates. Final Thoughts • Further studies with larger populations are necessary to verify our findings. • A follow up study could be performed to determine if other factors affect these error rates. These factors could include weight, environment, or test administrator. Failure Rate Scatter Plots 35% 39% 26% 61-65 66-71 72-79 69 Subjects with and an average height of 67.8”