SlideShare uma empresa Scribd logo
1 de 30
Baixar para ler offline
News
                                                                                   United States
                                                                                   Department
                                                                                   of Labor

Bureau of Labor Statistics                                                         Washington, D.C. 20212

Technical information:
   Household data:           (202) 691-6378                                   USDL 09-0742
                     http://www.bls.gov/cps/

  Establishment data:      (202) 691-6555                                     Transmission of material in this release
                   http://www.bls.gov/ces/                                    is embargoed until 8:30 A.M. (EDT),
Media contact:             (202) 691-5902                                     Thursday, July 2, 2009.


                                   THE EMPLOYMENT SITUATION: JUNE 2009

     Nonfarm payroll employment continued to decline in June (-467,000), and the unemployment
rate was little changed at 9.5 percent, the Bureau of Labor Statistics of the U.S. Department of Labor
reported today. Job losses were widespread across the major industry sectors, with large declines
occurring in manufacturing, professional and business services, and construction.

           Chart 1. Unemployment rate, seasonally adjusted,              Chart 2. Nonfarm payroll employment over-the-month change,
                    June 2007 – June 2009                                         seasonally adjusted, June 2007 – June 2009
 Percent                                                               Thousands
 10.0                                                                  400

  9.0                                                                  200

  8.0                                                                    0

  7.0                                                                  -200

  6.0                                                                  -400

  5.0                                                                  -600

  4.0                                                                  -800
    Jun-07 Sep-07 Dec-07 M ar-08 Jun-08 Sep-08 Dec-08 M ar-09 Jun-09      Jun-07 Sep-07 Dec-07 M ar-08 Jun-08 Sep-08 Dec-08 M ar-09 Jun-09


Unemployment (Household Survey Data)

      The number of unemployed persons (14.7 million) and the unemployment rate (9.5 percent) were
little changed in June. Since the start of the recession in December 2007, the number of unemployed
persons has increased by 7.2 million, and the unemployment rate has risen by 4.6 percentage points.
(See table A-1.)

     In June, unemployment rates for the major worker groups—adult men (10.0 percent), adult women
(7.6 percent), teenagers (24.0 percent), whites (8.7 percent), blacks (14.7 percent), and Hispanics (12.2
percent)—showed little change. The unemployment rate for Asians was 8.2 percent, not seasonally ad-
justed. (See tables A-1, A-2, and A-3.)
2

Table A. Major indicators of labor market activity, seasonally adjusted
(Numbers in thousands)
                                               Quarterly averages                   Monthly data
                                                                                                               May-June
                 Category
                                               I 2009     II 2009       Apr. 2009    May 2009      June 2009    change

          HOUSEHOLD DATA                                                  Labor force status

Civilian labor force …………….…………… 153,993                   154,912       154,731       155,081      154,926        -155
  Employment …………………….………… 141,578                         140,591       141,007       140,570      140,196        -374
  Unemployment ……………….……………       12,415                    14,321        13,724        14,511       14,729         218
Not in labor force ………………….………… 80,920                      80,547        80,541        80,371       80,729         358

                                                                        Unemployment rates

All workers ……………….……………....…                      8.1            9.2         8.9           9.4          9.5         0.1
 Adult men …………………....……...……                      8.2            9.7         9.4           9.8         10.0          .2
 Adult women ………….……………………                         6.7            7.4         7.1           7.5          7.6          .1
 Teenagers ………….………………...……                       21.3           22.7        21.5          22.7         24.0         1.3
 White ……….………….…...……………                          7.4            8.4         8.0           8.6          8.7          .1
 Black or African American ………….……                13.1           14.9        15.0          14.9         14.7         -.2
 Hispanic or Latino ethnicity ………..……             10.7           12.0        11.3          12.7         12.2         -.5

       ESTABLISHMENT DATA                                                    Employment

Nonfarm employment ……….……...……… 133,662                   p 132,111      132,481     p 132,159     p 131,692      p -467
 Goods-producing 1…...…...………………             19,826        p 19,035       19,253      p 19,038      p 18,815      p -223
   Construction ..…...…………….…………              6,590         p 6,309        6,367       p 6,319       p 6,240       p -79
   Manufacturing …………………....……               12,468        p 11,997       12,146      p 11,990      p 11,854      p -136
 Service-providing 1 ………...……..……… 113,835                p 113,075      113,228     p 113,121     p 112,877      p -244
     Retail trade 2 …...…………….…..……          14,933        p 14,821       14,840      p 14,822      p 14,801       p -21
   Professional and business service ….....… 17,048        p 16,712       16,783      p 16,735      p 16,617      p -118
   Education and health services …..…….… 19,138            p 19,218       19,175      p 19,222      p 19,256        p 34
   Leisure and hospitality …...…………….        13,235        p 13,174       13,168      p 13,186      p 13,168       p -18
   Government ………...…………………… 22,543                        p 22,592       22,616      p 22,606      p 22,554       p -52

                                                                           Hours of work 3

Total private ……...…………...……………                   33.2       p 33.1          33.1         p 33.1      p 33.0      p -0.1
 Manufacturing …………….……...………                     39.6       p 39.5          39.6         p 39.4      p 39.5        p .1
    Overtime ……...………………..…….…                     2.7        p 2.8           2.7          p 2.8       p 2.8        p .0

                                                          Indexes of aggregate weekly hours (2002=100) 3

Total private ……...………………….………                   101.7       p 99.6         100.1         p 99.8      p 99.0      p -0.8

                                                                             Earnings 3

Average hourly earnings, total private …...…    $18.46     p $18.52        $18.50     p $18.53      p $18.53     p $0.00
Average weekly earnings, total private …….      613.60     p 612.39        612.35     p 613.34      p 611.49     p -1.85
 1
   Includes other industries, not shown separately.
 2
   Quarterly averages and the over-the-month change are calculated using unrounded data.
 3
   Data relate to private production and nonsupervisory workers.
 p = preliminary.
3

     Among the unemployed, the number of job losers and persons who completed temporary jobs (9.6
million) was little changed in June after increasing by an average of 615,000 per month during the first
5 months of this year. (See table A-8.)

    The number of long-term unemployed (those jobless for 27 weeks or more) increased by 433,000
over the month to 4.4 million. In June, 3 in 10 unemployed persons were jobless for 27 weeks or more.
(See table A-9.)

Total Employment and the Labor Force (Household Survey Data)

     The civilian labor force participation rate was little changed in June at 65.7 percent. The employ-
ment-population ratio, at 59.5 percent, continued to trend down over the month. The employment-pop-
ulation ratio has declined by 3.2 percentage points since the start of the recession in December 2007.
(See table A-1.)

     The number of persons working part time for economic reasons (sometimes referred to as involun-
tary part-time workers) was little changed in June at 9.0 million. Since the start of the recession, the
number of such workers has increased by 4.4 million. (See table A-5.)

Persons Not in the Labor Force (Household Survey Data)

    About 2.2 million persons (not seasonally adjusted) were marginally attached to the labor force in
June, 618,000 more than a year earlier. These individuals wanted and were available for work and had
looked for a job sometime in the past 12 months. They were not counted as unemployed because they
had not searched for work in the 4 weeks preceding the survey. Among the marginally attached, there
were 793,000 discouraged workers in June, up by 373,000 from a year earlier. Discouraged workers are
persons not currently looking for work because they believe no jobs are available for them. The other
1.4 million persons marginally attached to the labor force in June had not searched for work in the 4
weeks preceding the survey for reasons such as school attendance or family responsibilities. (See table
A-13.)

Industry Payroll Employment (Establishment Survey Data)

     Total nonfarm payroll employment continued to decline in June (-467,000). Job losses from
April to June averaged 436,000 per month, compared with losses averaging 670,000 per month from
November to March. Since the recession began in December 2007, payroll employment has fallen
by 6.5 million. In June, job losses continued to be widespread across major industry sectors. (See
table B-1.)

    Employment in manufacturing fell by 136,000 over the month and has declined by 1.9 million
during the recession. Within the durable goods industry, motor vehicles and parts (-27,000), fabri-
cated metal products (-18,000), computer and electronic products (-16,000), and machinery (-14,000)
continued to lose jobs in June. Since the recession began, employment in motor vehicles and parts has
declined by 335,000, or about one-third.

    In June, employment in construction fell by 79,000, with losses spread throughout the industry.
Since the start of the recession, construction employment has fallen by 1.3 million. Mining employ-
ment fell by 8,000 in June, about in line with the average monthly decline since its recent peak in
October 2008.
4

     Employment in the professional and business services industry declined by 118,000 in June. This
industry has shed 1.5 million jobs since an employment peak in December 2007. Within this sector,
employment in temporary help services fell by 38,000 in June; this industry has lost 848,000 jobs since
the start of the recession.

     Retail trade employment edged down in June (-21,000); job losses in retail trade have moderated in
the past 3 months. Over the month, job losses continued in automobile dealerships (-9,000). Employ-
ment continued to fall in wholesale trade (-16,000).

    In June, financial activities employment continued to decline (-27,000). Since the start of the
recession, this industry has lost 489,000 jobs. In June, employment declined in credit intermediation
and related activities (-10,000) and in securities, commodity contracts, and investments (-6,000).

    The information industry lost 21,000 jobs over the month and 187,000 since the start of the re-
cession. Publishing accounted for about half of the employment decline in the information industry
during the recession.

    Health care employment increased by 21,000 in June. Job gains in health care have averaged
21,000 per month thus far in 2009, down from an average of 30,000 per month during 2008. Employ-
ment in federal government fell by 49,000 in June, largely due to the layoff of workers temporarily
hired to prepare for Census 2010.

    The change in total nonfarm employment for April was revised from -504,000 to -519,000, and the
change for May was revised from -345,000 to -322,000.

Weekly Hours (Establishment Survey Data)

    In June, the average workweek for production and nonsupervisory workers on private nonfarm
payrolls fell by 0.1 hour to 33.0 hours—the lowest level on record for the series, which began in 1964.
The manufacturing workweek rose by 0.1 hour to 39.5 hours, and factory overtime was unchanged at 2.8
hours. (See table B-2.)

    The index of aggregate weekly hours of production and nonsupervisory workers on private nonfarm
payrolls fell by 0.8 percent in June. The manufacturing index declined by 1.2 percent over the month.
(See table B-5.)

Hourly and Weekly Earnings (Establishment Survey Data)

    In June, average hourly earnings of production and nonsupervisory workers on private nonfarm
payrolls were unchanged at $18.53. Over the past 12 months, average hourly earnings have increased
by 2.7 percent, while weekly earnings have risen by only 0.9 percent, reflecting a decline in the average
workweek. (See table B-3.)

                                  ______________________________


     The Employment Situation for July 2009 is scheduled to be released on Friday, August 7,
at 8:30 A.M. (EDT).
5


          Upcoming Changes to The Employment Situation News Release

     Beginning with the next edition of The Employment Situation news release scheduled
for publication on August 7, 2009, the Bureau of Labor Statistics will introduce changes
in the presentation of the text section of the release. There will be no changes to the
format and content of the tables. A sample of the revamped Employment Situation will
be posted on the BLS Web site on Monday, July 6. For further information, please see
http://www.bls.gov/bls/changes_to_text_sections_of_nrs.htm.
6

          Frequently Asked Questions about Employment and Unemployment Estimates

Why are there two monthly measures of employment?

    The household survey and establishment survey both produce sample-based estimates of employ-
ment and both have strengths and limitations. The establishment survey employment series has a
smaller margin of error on the measurement of month-to-month change than the household survey
because of its much larger sample size. An over-the-month employment change of 107,000 is statisti-
cally significant in the establishment survey, while the threshold for a statistically significant change in
the household survey is about 400,000. However, the household survey has a more expansive scope
than the establishment survey because it includes the self-employed, unpaid family workers, agricul-
tural workers, and private household workers, who are excluded by the establishment survey. The
household survey also provides estimates of employment for demographic groups.

Are undocumented immigrants counted in the surveys?

   Neither the establishment nor household survey is designed to identify the legal status of workers.
Thus, while it is likely that both surveys include at least some undocumented immigrants, it is not
possible to determine how many are counted in either survey. The household survey does include
questions about whether respondents were born outside the United States. Data from these questions
show that foreign-born workers accounted for 15.6 percent of the labor force in 2008.

Why does the establishment survey have revisions?

    The establishment survey revises published estimates to improve its data series by incorporating
additional information that was not available at the time of the initial publication of the estimates.
The establishment survey revises its initial monthly estimates twice, in the immediately succeeding
2 months, to incorporate additional sample receipts from respondents in the survey and recalculated
seasonal adjustment factors. For more information on the monthly revisions, please visit
http://www.bls.gov/ces/cesrevinfo.htm.

    On an annual basis, the establishment survey incorporates a benchmark revision that re-anchors
estimates to nearly complete employment counts available from unemployment insurance tax records.
The benchmark helps to control for sampling and modeling errors in the estimates. For more informa-
tion on the annual benchmark revision, please visit http://www.bls.gov/web/cesbmart.htm.

Does the establishment survey sample include small firms?

    Yes; about 40 percent of the establishment survey sample is comprised of business establishments
with fewer than 20 employees. The establishment survey sample is designed to maximize the reliability
of the total nonfarm employment estimate; firms from all size classes and industries are appropriately
sampled to achieve that goal.

Does the establishment survey account for employment from new businesses?

   Yes; monthly establishment survey estimates include an adjustment to account for the net employ-
ment change generated by business births and deaths. The adjustment comes from an econometric
model that forecasts the monthly net jobs impact of business births and deaths based on the actual past
7

values of the net impact that can be observed with a lag from the Quarterly Census of Employment and
Wages. The establishment survey uses modeling rather than sampling for this purpose because the sur-
vey is not immediately able to bring new businesses into the sample. There is an unavoidable lag be-
tween the birth of a new firm and its appearance on the sampling frame and availability for selection.
BLS adds new businesses to the survey twice a year.

Is the count of unemployed persons limited to just those people receiving unemployment insurance
benefits?

    No; the estimate of unemployment is based on a monthly sample survey of households. All persons
who are without jobs and are actively seeking and available to work are included among the unemployed.
(People on temporary layoff are included even if they do not actively seek work.) There is no require-
ment or question relating to unemployment insurance benefits in the monthly survey.

Does the official unemployment rate exclude people who have stopped looking for work?

    Yes; however, there are separate estimates of persons outside the labor force who want a job,
including those who have stopped looking because they believe no jobs are available (discouraged
workers). In addition, alternative measures of labor underutilization (discouraged workers and other
groups not officially counted as unemployed) are published each month in the Employment Situation
news release.
Technical Note
      This news release presents statistics from two major       force. The labor force participation rate is the labor force as
surveys, the Current Population Survey (household survey)        a percent of the population, and the employment-population
and the Current Employment Statistics survey (establishment      ratio is the employed as a percent of the population.
survey). The household survey provides the information on
the labor force, employment, and unemployment that appears             Establishment survey. The sample establishments are
in the A tables, marked HOUSEHOLD DATA. It is a sample           drawn from private nonfarm businesses such as factories,
survey of about 60,000 households conducted by the U.S.          offices, and stores, as well as federal, state, and local
Census Bureau for the Bureau of Labor Statistics (BLS).          government entities. Employees on nonfarm payrolls are
      The establishment survey provides the information on       those who received pay for any part of the reference pay
the employment, hours, and earnings of workers on nonfarm        period, including persons on paid leave. Persons are counted
payrolls that appears in the B tables, marked ESTABLISH-         in each job they hold. Hours and earnings data are for
MENT DATA. This information is collected from payroll            private businesses and relate only to production workers in
records by BLS in cooperation with state agencies. The           the goods-producing sector and nonsupervisory workers in
sample includes about 160,000 businesses and government          the service-providing sector. Industries are classified on the
agencies covering approximately 400,000 individual work-         basis of their principal activity in accordance with the 2007
sites. The active sample includes about one-third of all non-    version of the North American Industry Classification
farm payroll workers. The sample is drawn from a sampling        System.
frame of unemployment insurance tax accounts.
      For both surveys, the data for a given month relate to a         Differences in employment estimates. The numerous
particular week or pay period. In the household survey, the      conceptual and methodological differences between the
reference week is generally the calendar week that contains      household and establishment surveys result in important
the 12th day of the month. In the establishment survey, the      distinctions in the employment estimates derived from the
reference period is the pay period including the 12th, which     surveys. Among these are:
may or may not correspond directly to the calendar week.
                                                                     •    The household survey includes agricultural workers,
Coverage, definitions, and differences between sur-                       the self-employed, unpaid family workers, and
veys                                                                      private household workers among the employed.
                                                                          These groups are excluded from the establishment
       Household survey. The sample is selected to reflect                survey.
the entire civilian noninstitutional population. Based on
responses to a series of questions on work and job search            •    The household survey includes people on unpaid
activities, each person 16 years and over in a sample                     leave among the employed. The establishment
household is classified as employed, unemployed, or not in                survey does not.
the labor force.
       People are classified as employed if they did any work        •    The household survey is limited to workers 16 years
at all as paid employees during the reference week; worked in             of age and older. The establishment survey is not
their own business, profession, or on their own farm; or                  limited by age.
worked without pay at least 15 hours in a family business or
farm. People are also counted as employed if they were               •    The household survey has no duplication of
temporarily absent from their jobs because of illness, bad                individuals, because individuals are counted only
weather, vacation, labor-management disputes, or personal                 once, even if they hold more than one job. In the
reasons.                                                                  establishment survey, employees working at more
       People are classified as unemployed if they meet all of            than one job and thus appearing on more than one
the following criteria: They had no employment during the                 payroll would be counted separately for each
reference week; they were available for work at that time; and            appearance.
they made specific efforts to find employment sometime
during the 4-week period ending with the reference week.         Seasonal adjustment
Persons laid off from a job and expecting recall need not be           Over the course of a year, the size of the nation's labor
looking for work to be counted as unemployed. The                force and the levels of employment and unemployment
unemployment data derived from the household survey in no        undergo sharp fluctuations due to such seasonal events as
way depend upon the eligibility for or receipt of                changes in weather, reduced or expanded production,
unemployment insurance benefits.                                 harvests, major holidays, and the opening and closing of
       The civilian labor force is the sum of employed and       schools. The effect of such seasonal variation can be very
unemployed persons. Those not classified as employed or          large; seasonal fluctuations may account for as much as 95
unemployed are not in the labor force. The unemployment          percent of the month-to-month changes in unemployment.
rate is the number unemployed as a percent of the labor
Because these seasonal events follow a more or less          430,000). These figures do not mean that the sample results
regular pattern each year, their influence on statistical trends   are off by these magnitudes, but rather that there is about a
can be eliminated by adjusting the statistics from month to        90-percent chance that the "true" over-the-month change lies
month. These adjustments make nonseasonal developments,            within this interval. Since this range includes values of less
such as declines in economic activity or increases in the          than zero, we could not say with confidence that employment
participation of women in the labor force, easier to spot. For     had, in fact, increased. If, however, the reported employment
example, the large number of youth entering the labor force        rise was half a million, then all of the values within the 90-
each June is likely to obscure any other changes that have         percent confidence interval would be greater than zero. In
taken place relative to May, making it difficult to determine if   this case, it is likely (at least a 90-percent chance) that an
the level of economic activity has risen or declined.              employment rise had, in fact, occurred. At an unemployment
However, because the effect of students finishing school in        rate of around 5.5 percent, the 90-percent confidence interval
previous years is known, the statistics for the current year can   for the monthly change in unemployment is about
be adjusted to allow for a comparable change. Insofar as the       +/-280,000, and for the monthly change in the unemployment
seasonal adjustment is made correctly, the adjusted figure         rate it is about +/-.19 percentage point.
provides a more useful tool with which to analyze changes in             In general, estimates involving many individuals or
economic activity.                                                 establishments have lower standard errors (relative to the size
      Most seasonally adjusted series are independently            of the estimate) than estimates which are based on a small
adjusted in both the household and establishment surveys.          number of observations. The precision of estimates is also
However, the adjusted series for many major estimates, such        improved when the data are cumulated over time such as for
as total payroll employment, employment in most                    quarterly and annual averages. The seasonal adjustment
supersectors, total employment, and unemployment are               process can also improve the stability of the monthly
computed by aggregating independently adjusted component           estimates.
series. For example, total unemployment is derived by                    The household and establishment surveys are also
summing the adjusted series for four major age-sex                 affected by nonsampling error. Nonsampling errors can
components; this differs from the unemployment estimate            occur for many reasons, including the failure to sample a
that would be obtained by directly adjusting the total or by       segment of the population, inability to obtain information for
combining the duration, reasons, or more detailed age              all respondents in the sample, inability or unwillingness of
categories.                                                        respondents to provide correct information on a timely basis,
      For both the household and establishment surveys, a          mistakes made by respondents, and errors made in the
concurrent seasonal adjustment methodology is used in which        collection or processing of the data.
new seasonal factors are calculated each month, using all                For example, in the establishment survey, estimates for
relevant data, up to and including the data for the current        the most recent 2 months are based on incomplete returns; for
month. In the household survey, new seasonal factors are           this reason, these estimates are labeled preliminary in the
used to adjust only the current month's data. In the               tables. It is only after two successive revisions to a monthly
establishment survey, however, new seasonal factors are used       estimate, when nearly all sample reports have been received,
each month to adjust the three most recent monthly estimates.      that the estimate is considered final.
In both surveys, revisions to historical data are made once a            Another major source of nonsampling error in the
year.                                                              establishment survey is the inability to capture, on a timely
                                                                   basis, employment generated by new firms. To correct for
Reliability of the estimates                                       this systematic underestimation of employment growth, an
      Statistics based on the household and establishment          estimation procedure with two components is used to account
surveys are subject to both sampling and nonsampling error.        for business births. The first component uses business deaths
When a sample rather than the entire population is surveyed,       to impute employment for business births. This is in-
there is a chance that the sample estimates may differ from        corporated into the sample-based link relative estimate
the "true" population values they represent. The exact             procedure by simply not reflecting sample units going out of
difference, or sampling error, varies depending on the             business, but imputing to them the same trend as the other
particular sample selected, and this variability is measured by    firms in the sample. The second component is an ARIMA
the standard error of the estimate. There is about a 90-           time series model designed to estimate the residual net
percent chance, or level of confidence, that an estimate based     birth/death employment not accounted for by the imputation.
on a sample will differ by no more than 1.6 standard errors        The historical time series used to create and test the ARIMA
from the "true" population value because of sampling error.        model was derived from the unemployment insurance
BLS analyses are generally conducted at the 90-percent level       universe micro-level database, and reflects the actual residual
of confidence.                                                     net of births and deaths over the past 5 years.
      For example, the confidence interval for the monthly               The sample-based estimates from the establishment
change in total employment from the household survey is on         survey are adjusted once a year (on a lagged basis) to
the order of plus or minus 430,000. Suppose the estimate of        universe counts of payroll employment obtained from
total employment increases by 100,000 from one month to            administrative records of the unemployment insurance
the next. The 90-percent confidence interval on the monthly        program. The difference between the March sample-based
change would range from -330,000 to 530,000 (100,000 +/-           employment estimates and the March universe counts is
known as a benchmark revision, and serves as a rough proxy    Other information
for total survey error. The new benchmarks also incorporate        Information in this release will be made available to
changes in the classification of industries. Over the past    sensory impaired individuals upon request. Voice phone:
decade, absolute benchmark revisions for total nonfarm        (202) 691-5200; TDD message referral phone: 1-800-877-
employment have averaged 0.2 percent, with a range from 0.1   8339.
percent to 0.6 percent.
HOUSEHOLD DATA                                                                                                                                            HOUSEHOLD DATA

Table A-1. Employment status of the civilian population by sex and age

(Numbers in thousands)


                                                                                   Not seasonally adjusted                          Seasonally adjusted 1
            Employment status, sex, and age
                                                                                   June      May       June      June      Feb.        Mar.      Apr.        May       June
                                                                                   2008      2009      2009      2008      2009        2009      2009        2009      2009


                                 TOTAL

Civilian noninstitutional population .................................            233,627   235,452   235,655   233,627   234,913     235,086   235,271     235,452   235,655
 Civilian labor force ........................................................    155,582   154,336   155,921   154,400   154,214     154,048   154,731     155,081   154,926
      Participation rate .....................................................       66.6      65.5      66.2      66.1      65.6        65.5      65.8        65.9      65.7
  Employed ....................................................................   146,649   140,363   140,826   145,738   141,748     140,887   141,007     140,570   140,196
      Employment-population ratio ..................................                 62.8      59.6      59.8      62.4      60.3        59.9      59.9        59.7      59.5
  Unemployed ...............................................................        8,933    13,973    15,095     8,662    12,467      13,161    13,724      14,511    14,729
      Unemployment rate ................................................              5.7       9.1       9.7       5.6       8.1         8.5       8.9         9.4       9.5
 Not in labor force ..........................................................     78,045    81,116    79,734    79,227    80,699      81,038    80,541      80,371    80,729
  Persons who currently want a job ...............................                  5,374     6,612     6,454     4,925     5,645       5,814     5,935       5,861     5,884

                 Men, 16 years and over

Civilian noninstitutional population .................................            113,029   113,953   114,060   113,029   113,666     113,758   113,857     113,953   114,060
 Civilian labor force ........................................................     83,432    82,408    83,141    82,563    81,994      81,804    82,358      82,724    82,529
      Participation rate .....................................................       73.8      72.3      72.9      73.0      72.1        71.9      72.3        72.6      72.4
  Employed ....................................................................    78,614    74,009    74,494    77,726    74,777      74,053    74,116      74,033    73,777
      Employment-population ratio ..................................                 69.6      64.9      65.3      68.8      65.8        65.1      65.1        65.0      64.7
  Unemployed ...............................................................        4,818     8,399     8,647     4,837     7,217       7,751     8,242       8,691     8,751
      Unemployment rate ................................................              5.8      10.2      10.4       5.9       8.8         9.5      10.0        10.5      10.6
 Not in labor force ..........................................................     29,597    31,545    30,919    30,467    31,672      31,954    31,498      31,229    31,532

                 Men, 20 years and over

Civilian noninstitutional population .................................            104,371   105,299   105,412   104,371   104,999     105,095   105,196     105,299   105,412
 Civilian labor force ........................................................     79,231    79,156    79,245    79,055    78,687      78,578    79,081      79,395    79,291
      Participation rate .....................................................       75.9      75.2      75.2      75.7      74.9        74.8      75.2        75.4      75.2
  Employed ....................................................................    75,402    71,645    71,738    74,949    72,293      71,655    71,678      71,593    71,387
      Employment-population ratio ..................................                 72.2      68.0      68.1      71.8      68.9        68.2      68.1        68.0      67.7
  Unemployed ...............................................................        3,829     7,511     7,507     4,106     6,394       6,923     7,403       7,802     7,904
      Unemployment rate ................................................              4.8       9.5       9.5       5.2       8.1         8.8       9.4         9.8      10.0
 Not in labor force ..........................................................     25,139    26,144    26,167    25,315    26,312      26,516    26,115      25,904    26,121

              Women, 16 years and over

Civilian noninstitutional population .................................            120,598   121,499   121,594   120,598   121,247     121,328   121,415     121,499   121,594
 Civilian labor force ........................................................     72,150    71,929    72,780    71,838    72,220      72,244    72,372      72,357    72,397
      Participation rate .....................................................       59.8      59.2      59.9      59.6      59.6        59.5      59.6        59.6      59.5
  Employed ....................................................................    68,035    66,354    66,332    68,012    66,970      66,834    66,890      66,537    66,419
      Employment-population ratio ..................................                 56.4      54.6      54.6      56.4      55.2        55.1      55.1        54.8      54.6
  Unemployed ...............................................................        4,115     5,574     6,448     3,825     5,250       5,410     5,482       5,820     5,978
      Unemployment rate ................................................              5.7       7.7       8.9       5.3       7.3         7.5       7.6         8.0       8.3
 Not in labor force ..........................................................     48,448    49,570    48,815    48,760    49,027      49,084    49,042      49,142    49,197

              Women, 20 years and over

Civilian noninstitutional population .................................            112,183   113,089   113,189   112,183   112,824     112,908   112,999     113,089   113,189
 Civilian labor force ........................................................     68,227    68,751    68,906    68,421    68,917      68,977    69,148      69,112    69,060
      Participation rate .....................................................       60.8      60.8      60.9      61.0      61.1        61.1      61.2        61.1      61.0
  Employed ....................................................................    64,904    63,809    63,480    65,169    64,271      64,148    64,226      63,895    63,810
      Employment-population ratio ..................................                 57.9      56.4      56.1      58.1      57.0        56.8      56.8        56.5      56.4
  Unemployed ...............................................................        3,323     4,942     5,426     3,252     4,646       4,828     4,922       5,217     5,249
      Unemployment rate ................................................              4.9       7.2       7.9       4.8       6.7         7.0       7.1         7.5       7.6
 Not in labor force ..........................................................     43,956    44,338    44,284    43,762    43,907      43,931    43,850      43,976    44,130

              Both sexes, 16 to 19 years

Civilian noninstitutional population .................................             17,073    17,064    17,053    17,073    17,090      17,083    17,076      17,064    17,053
 Civilian labor force ........................................................      8,124     6,430     7,770     6,924     6,610       6,493     6,501       6,573     6,575
      Participation rate .....................................................       47.6      37.7      45.6      40.6      38.7        38.0      38.1        38.5      38.6
  Employed ....................................................................     6,343     4,910     5,608     5,620     5,184       5,083     5,103       5,082     4,999
      Employment-population ratio ..................................                 37.1      28.8      32.9      32.9      30.3        29.8      29.9        29.8      29.3
  Unemployed ...............................................................        1,781     1,520     2,162     1,304     1,427       1,410     1,398       1,491     1,576
      Unemployment rate ................................................             21.9      23.6      27.8      18.8      21.6        21.7      21.5        22.7      24.0
 Not in labor force ..........................................................      8,950    10,634     9,284    10,149    10,480      10,590    10,575      10,491    10,478


   1 The population figures are not adjusted for seasonal variation; therefore, identical numbers appear in the unadjusted and seasonally adjusted columns.
   NOTE: Updated population controls are introduced annually with the release of January data.
HOUSEHOLD DATA                                                                                                                                               HOUSEHOLD DATA

Table A-2. Employment status of the civilian population by race, sex, and age

(Numbers in thousands)

                                                                                   Not seasonally adjusted                            Seasonally adjusted 1
        Employment status, race, sex, and age
                                                                                   June      May       June      June       Feb.         Mar.       Apr.       May       June
                                                                                   2008      2009      2009      2008       2009         2009       2009       2009      2009


                                 WHITE

Civilian noninstitutional population .................................            189,428   190,667   190,801   189,428    190,331      190,436    190,552    190,667   190,801
 Civilian labor force ........................................................    126,674   125,841   126,986   125,712    125,703      125,599    126,110    126,423   126,199
    Participation rate .......................................................       66.9      66.0      66.6      66.4       66.0         66.0       66.2       66.3      66.1
  Employed ....................................................................   120,191   115,444   115,772   119,417    116,481      115,693    115,977    115,561   115,202
    Employment-population ratio ....................................                 63.4      60.5      60.7      63.0       61.2         60.8       60.9       60.6      60.4
  Unemployed ...............................................................        6,483    10,398    11,214     6,295      9,222        9,906     10,133     10,862    10,997
    Unemployment rate ..................................................              5.1       8.3       8.8       5.0        7.3          7.9        8.0        8.6       8.7
 Not in labor force ..........................................................     62,753    64,826    63,815    63,716     64,628       64,837     64,441     64,244    64,601

                   Men, 20 years and over
 Civilian labor force ........................................................     65,578    65,631    65,662    65,420     65,180       65,032     65,509     65,766    65,732
   Participation rate .......................................................        76.3      75.7      75.7      76.1       75.4         75.2       75.7       75.9      75.8
  Employed ....................................................................    62,803    59,932    59,963    62,413     60,361       59,811     59,967     59,820    59,656
   Employment-population ratio ....................................                  73.0      69.2      69.1      72.6       69.8         69.1       69.3       69.0      68.8
  Unemployed ...............................................................        2,775     5,699     5,699     3,007      4,819        5,221      5,543      5,946     6,076
   Unemployment rate ..................................................               4.2       8.7       8.7       4.6        7.4          8.0        8.5        9.0       9.2

                Women, 20 years and over
 Civilian labor force ........................................................     54,346    54,875    54,900    54,567     54,967       55,115     55,227     55,192    55,068
   Participation rate .......................................................        60.2      60.3      60.3      60.4       60.5         60.7       60.8       60.7      60.5
  Employed ....................................................................    51,969    51,303    50,990    52,255     51,624       51,519     51,695     51,385    51,304
   Employment-population ratio ....................................                  57.5      56.4      56.0      57.8       56.9         56.7       56.9       56.5      56.4
  Unemployed ...............................................................        2,376     3,573     3,910     2,312      3,344        3,596      3,533      3,807     3,765
   Unemployment rate ..................................................               4.4       6.5       7.1       4.2        6.1          6.5        6.4        6.9       6.8

                 Both sexes, 16 to 19 years
 Civilian labor force ........................................................      6,750     5,335     6,424     5,725      5,556        5,452      5,374      5,465     5,400
   Participation rate .......................................................        51.6      40.9      49.3      43.8       42.5         41.7       41.1       41.9      41.4
  Employed ....................................................................     5,419     4,209     4,819     4,749      4,497        4,363      4,316      4,356     4,243
   Employment-population ratio ....................................                  41.4      32.2      36.9      36.3       34.4         33.4       33.0       33.4      32.5
  Unemployed ...............................................................        1,332     1,126     1,605       976      1,059        1,089      1,058      1,108     1,156
   Unemployment rate ..................................................              19.7      21.1      25.0      17.0       19.1         20.0       19.7       20.3      21.4

          BLACK OR AFRICAN AMERICAN

Civilian noninstitutional population .................................             27,816    28,184    28,217    27,816     28,085       28,118     28,153     28,184    28,217
 Civilian labor force ........................................................     17,926    17,649    17,911    17,708     17,703       17,542     17,816     17,737    17,700
    Participation rate .......................................................       64.4      62.6      63.5      63.7       63.0         62.4       63.3       62.9      62.7
  Employed ....................................................................    16,165    15,047    15,174    16,041     15,336       15,212     15,142     15,095    15,103
    Employment-population ratio ....................................                 58.1      53.4      53.8      57.7       54.6         54.1       53.8       53.6      53.5
  Unemployed ...............................................................        1,760     2,603     2,737     1,667      2,368        2,330      2,673      2,642     2,597
    Unemployment rate ..................................................              9.8      14.7      15.3       9.4       13.4         13.3       15.0       14.9      14.7
 Not in labor force ..........................................................      9,891    10,534    10,306    10,109     10,382       10,576     10,337     10,446    10,517

                   Men, 20 years and over
 Civilian labor force ........................................................      8,051     7,939     7,956     7,994      7,949        7,917      7,990      8,000     7,929
   Participation rate .......................................................        72.0      70.0      70.0      71.5       70.4         70.0       70.5       70.5      69.8
  Employed ....................................................................     7,292     6,621     6,672     7,223      6,762        6,700      6,620      6,656     6,633
   Employment-population ratio ....................................                  65.2      58.3      58.7      64.6       59.9         59.2       58.4       58.7      58.4
  Unemployed ...............................................................          760     1,319     1,284       772      1,187        1,218      1,370      1,345     1,297
   Unemployment rate ..................................................               9.4      16.6      16.1        9.7      14.9         15.4       17.2       16.8      16.4

                Women, 20 years and over
 Civilian labor force ........................................................      8,987     8,987     9,076     8,961      9,006        8,932      9,064      9,000     9,042
   Participation rate .......................................................        64.4      63.5      64.1      64.2       63.9         63.3       64.1       63.6      63.8
  Employed ....................................................................     8,300     7,993     8,018     8,291      8,115        8,045      8,025      7,993     8,018
   Employment-population ratio ....................................                  59.5      56.5      56.6      59.4       57.6         57.0       56.8       56.5      56.6
  Unemployed ...............................................................          687       995     1,058       671        890          887      1,038      1,007     1,024
   Unemployment rate ..................................................               7.6      11.1      11.7        7.5        9.9          9.9      11.5       11.2      11.3

                 Both sexes, 16 to 19 years
 Civilian labor force ........................................................        887       723      879       752        749          692        762         736       729
   Participation rate .......................................................        33.1      26.9      32.7      28.1       27.8         25.7       28.3       27.4      27.1
  Employed ....................................................................       573       433      484       528        459          467        497         446       453
   Employment-population ratio ....................................                  21.4      16.1      18.0      19.7       17.0         17.4       18.5       16.6      16.9
  Unemployed ...............................................................          314       290      395       224        290          225        265         290       276
   Unemployment rate ..................................................              35.4      40.1      45.0      29.8       38.8         32.5       34.7       39.4      37.9


See footnotes at end of table.
HOUSEHOLD DATA                                                                                                                                                 HOUSEHOLD DATA

Table A-2. Employment status of the civilian population by race, sex, and age — Continued

(Numbers in thousands)

                                                                                  Not seasonally adjusted                             Seasonally adjusted 1
        Employment status, race, sex, and age
                                                                                  June     May       June        June        Feb.        Mar.         Apr.        May          June
                                                                                  2008     2009      2009        2008        2009        2009         2009        2009         2009


                                 ASIAN

Civilian noninstitutional population .................................            10,728   10,855    10,897      (2)          (2)         (2)         (2)          (2)         (2)
 Civilian labor force ........................................................     7,231    7,170     7,322      (2)          (2)         (2)         (2)          (2)         (2)
    Participation rate .......................................................      67.4     66.1      67.2      (2)          (2)         (2)         (2)          (2)         (2)
  Employed ....................................................................    6,903    6,690     6,719      (2)          (2)         (2)         (2)          (2)         (2)
    Employment-population ratio ....................................                64.3     61.6      61.7      (2)          (2)         (2)         (2)          (2)         (2)
  Unemployed ...............................................................         328      480       603      (2)          (2)         (2)         (2)          (2)         (2)
    Unemployment rate ..................................................             4.5      6.7        8.2     (2)          (2)         (2)         (2)          (2)         (2)
 Not in labor force ..........................................................     3,498    3,685     3,575      (2)          (2)         (2)         (2)          (2)         (2)


   1 The population figures are not adjusted for seasonal variation; therefore,                          NOTE: Estimates for the above race groups will not sum to totals shown in
identical numbers appear in the unadjusted and seasonally adjusted columns.                            table A-1 because data are not presented for all races. Updated population
   2 Data not available.                                                                               controls are introduced annually with the release of January data.


Table A-3. Employment status of the Hispanic or Latino population by sex and age

(Numbers in thousands)

                                                                                  Not seasonally adjusted                             Seasonally adjusted 1
            Employment status, sex, and age
                                                                                  June     May       June        June        Feb.        Mar.         Apr.        May          June
                                                                                  2008     2009      2009        2008        2009        2009         2009        2009         2009


          HISPANIC OR LATINO ETHNICITY

Civilian noninstitutional population .................................            32,087   32,753    32,839     32,087       32,501      32,585       32,671      32,753      32,839
 Civilian labor force ........................................................    22,184   22,299    22,403     22,100       22,100      22,175       22,376      22,438      22,347
    Participation rate .......................................................      69.1     68.1      68.2       68.9         68.0        68.1         68.5        68.5        68.1
  Employed ....................................................................   20,499   19,673    19,685     20,391       19,684      19,640       19,854      19,595      19,623
    Employment-population ratio ....................................                63.9     60.1      59.9       63.5         60.6        60.3         60.8        59.8        59.8
  Unemployed ...............................................................       1,684    2,626     2,718      1,709        2,416       2,536        2,521       2,843       2,724
    Unemployment rate ..................................................             7.6     11.8      12.1        7.7         10.9        11.4         11.3        12.7        12.2
 Not in labor force ..........................................................     9,904   10,455    10,436      9,987       10,401      10,410       10,295      10,315      10,491

                   Men, 20 years and over
 Civilian labor force ........................................................    12,632   12,739    12,642      (2)          (2)         (2)         (2)          (2)         (2)
   Participation rate .......................................................       84.5     83.6      82.7      (2)          (2)         (2)         (2)          (2)         (2)
  Employed ....................................................................   11,849   11,330    11,290      (2)          (2)         (2)         (2)          (2)         (2)
   Employment-population ratio ....................................                 79.3     74.4      73.9      (2)          (2)         (2)         (2)          (2)         (2)
  Unemployed ...............................................................         783    1,409     1,352      (2)          (2)         (2)         (2)          (2)         (2)
   Unemployment rate ..................................................              6.2     11.1      10.7      (2)          (2)         (2)         (2)          (2)         (2)

                Women, 20 years and over
 Civilian labor force ........................................................     8,286    8,510     8,527      (2)          (2)         (2)         (2)          (2)         (2)
   Participation rate .......................................................       58.7     59.1      59.1      (2)          (2)         (2)         (2)          (2)         (2)
  Employed ....................................................................    7,680    7,619     7,542      (2)          (2)         (2)         (2)          (2)         (2)
   Employment-population ratio ....................................                 54.5     52.9      52.2      (2)          (2)         (2)         (2)          (2)         (2)
  Unemployed ...............................................................         606      891       985      (2)          (2)         (2)         (2)          (2)         (2)
   Unemployment rate ..................................................              7.3     10.5      11.5      (2)          (2)         (2)         (2)          (2)         (2)

                 Both sexes, 16 to 19 years
 Civilian labor force ........................................................     1,266    1,050     1,234      (2)          (2)         (2)         (2)          (2)         (2)
   Participation rate .......................................................       41.7     33.7      39.6      (2)          (2)         (2)         (2)          (2)         (2)
  Employed ....................................................................      970      724       854      (2)          (2)         (2)         (2)          (2)         (2)
   Employment-population ratio ....................................                 32.0     23.3      27.4      (2)          (2)         (2)         (2)          (2)         (2)
  Unemployed ...............................................................         296      326       381      (2)          (2)         (2)         (2)          (2)         (2)
   Unemployment rate ..................................................             23.4     31.0      30.8      (2)          (2)         (2)         (2)          (2)         (2)


   1 The population figures are not adjusted for seasonal variation; therefore,                          NOTE: Persons whose ethnicity is identified as Hispanic or Latino may be of
identical numbers appear in the unadjusted and seasonally adjusted columns.                            any race. Updated population controls are introduced annually with the release of
   2 Data not available.                                                                               January data.
HOUSEHOLD DATA                                                                                                                                         HOUSEHOLD DATA

Table A-4. Employment status of the civilian population 25 years and over by educational attainment

(Numbers in thousands)

                                                                                   Not seasonally adjusted                       Seasonally adjusted
                     Educational attainment
                                                                                   June     May       June     June     Feb.       Mar.      Apr.       May      June
                                                                                   2008     2009      2009     2008     2009       2009      2009       2009     2009


           Less than a high school diploma
Civilian labor force ..........................................................    12,422   12,402    12,545   12,193   11,955     11,997    12,027     12,210   12,363
  Participation rate .........................................................       46.8     46.6      47.0     45.9     46.4       45.7      45.7       45.9     46.3
 Employed ......................................................................   11,424   10,667    10,744   11,112   10,445     10,399    10,251     10,321   10,447
  Employment-population ratio ......................................                 43.0     40.1      40.3     41.8     40.5       39.6      38.9       38.8     39.2
 Unemployed .................................................................         998    1,736     1,802    1,081    1,510      1,598     1,776      1,889    1,916
  Unemployment rate ....................................................              8.0     14.0      14.4      8.9     12.6       13.3      14.8       15.5     15.5

         High school graduates, no college 1
Civilian labor force ..........................................................    37,875   38,436    38,208   38,162   38,463     38,434    38,687     38,757   38,694
  Participation rate .........................................................       62.3     62.6      62.4     62.8     62.2       62.3      63.0       63.1     63.2
 Employed ......................................................................   36,031   34,827    34,695   36,171   35,270     34,981    35,086     34,881   34,898
  Employment-population ratio ......................................                 59.3     56.7      56.7     59.5     57.1       56.7      57.1       56.8     57.0
 Unemployed .................................................................       1,844    3,609     3,514    1,991    3,193      3,454     3,601      3,875    3,796
  Unemployment rate ....................................................              4.9      9.4       9.2      5.2      8.3        9.0       9.3       10.0      9.8

          Some college or associate degree
Civilian labor force ..........................................................    36,692   36,621    36,546   36,761   37,362     36,921    36,959     36,860   36,646
  Participation rate .........................................................       71.7     71.2      70.8     71.8     72.1       71.8      71.7       71.7     71.0
 Employed ......................................................................   35,117   33,914    33,614   35,157   34,738     34,267    34,207     34,013   33,713
  Employment-population ratio ......................................                 68.6     66.0      65.1     68.7     67.1       66.6      66.4       66.2     65.3
 Unemployed .................................................................       1,575    2,707     2,932    1,605    2,624      2,653     2,752      2,847    2,933
  Unemployment rate ....................................................              4.3      7.4       8.0      4.4      7.0        7.2       7.4        7.7      8.0

             Bachelor’s degree and higher 2
Civilian labor force ..........................................................    44,677   45,438    45,242   44,958   45,027     45,401    45,442     45,500   45,527
  Participation rate .........................................................       77.5     77.7      77.3     78.0     77.6       78.1      77.7       77.8     77.7
 Employed ......................................................................   43,611   43,368    43,048   43,897   43,177     43,431    43,466     43,332   43,368
  Employment-population ratio ......................................                 75.7     74.1      73.5     76.2     74.4       74.7      74.4       74.1     74.1
 Unemployed .................................................................       1,066    2,070     2,194    1,061    1,850      1,970     1,977      2,167    2,158
  Unemployment rate ....................................................              2.4      4.6       4.8      2.4      4.1        4.3       4.4        4.8      4.7


   1 Includes persons with a high school diploma or equivalent.
   2 Includes persons with bachelor’s, master’s, professional, and doctoral degrees.
   NOTE: Updated population controls are introduced annually with the release of January data.
HOUSEHOLD DATA                                                                                                                                                HOUSEHOLD DATA

Table A-5. Employed persons by class of worker and part-time status

(In thousands)


                                                                                 Not seasonally adjusted                             Seasonally adjusted
                               Category
                                                                                 June      May       June       June         Feb.        Mar.        Apr.        May         June
                                                                                 2008      2009      2009       2008         2009        2009        2009        2009        2009


                     CLASS OF WORKER

Agriculture and related industries ...................................            2,331     2,205     2,351      2,134       2,148       2,050       2,134       2,173        2,165
 Wage and salary workers .............................................            1,401     1,278     1,366      1,250       1,244       1,167       1,209       1,256        1,232
 Self-employed workers .................................................            876       901       941        840         875         875         887         882          896
 Unpaid family workers ..................................................            53        26        43      (1)         (1)         (1)         (1)         (1)          (1)

Nonagricultural industries ...............................................      144,319   138,158   138,475    143,563     139,579     138,842     138,828     138,296     137,812
 Wage and salary workers .............................................          134,573   128,997   129,255    134,094     130,465     129,478     129,724     129,298     128,939
  Government ................................................................    20,955    21,607    21,260     21,190      21,192      20,904      21,211      21,247      21,446
  Private industries ........................................................   113,618   107,389   107,995    112,895     109,311     108,674     108,555     108,054     107,498
   Private households ...................................................           862       779       908      (1)         (1)         (1)         (1)         (1)         (1)
   Other industries ........................................................    112,756   106,610   107,087    112,080     108,574     107,898     107,813     107,238     106,631
 Self-employed workers .................................................          9,625     9,099     9,138      9,396       8,962       9,184       9,052       8,990       8,891
 Unpaid family workers ..................................................           120        63        83      (1)         (1)         (1)         (1)         (1)         (1)

         PERSONS AT WORK PART TIME 2

All industries:
   Part time for economic reasons ..................................              5,697     8,785     9,301      5,495       8,626       9,049       8,910        9,084       8,989
      Slack work or business conditions ...........................               3,806     6,647     6,616      3,905       6,443       6,857       6,699        6,794       6,783
      Could only find part-time work .................................            1,532     1,898     2,263      1,359       1,764       1,839       1,810        1,922       1,980
   Part time for noneconomic reasons ............................                18,424    19,111    17,712     19,428      18,855      18,833      19,065       18,872      18,718

Nonagricultural industries:
  Part time for economic reasons ..................................               5,608     8,663     9,190      5,390       8,543       8,942       8,826        8,928       8,845
   Slack work or business conditions ...........................                  3,749     6,552     6,537      3,839       6,390       6,773       6,650        6,681       6,699
   Could only find part-time work .................................               1,513     1,886     2,245      1,340       1,760       1,850       1,802        1,909       1,969
  Part time for noneconomic reasons ............................                 18,038    18,783    17,327     19,036      18,562      18,493      18,661       18,502      18,358


   1 Data not available.                                                                               reasons such as holidays, illness, and bad weather.
   2 Persons at work excludes employed persons who were absent from their                                 NOTE: Detail for the seasonally adjusted data shown in this table will not
jobs during the entire reference week for reasons such as vacation, illness, or                        necessarily add to totals because of the independent seasonal adjustment of the
industrial dispute. Part time for noneconomic reasons excludes persons who                             various series. Updated population controls are introduced annually with the
usually work full time but worked only 1 to 34 hours during the reference week for                     release of January data.
HOUSEHOLD DATA                                                                                                                                                  HOUSEHOLD DATA

Table A-6. Selected employment indicators

(In thousands)


                                                                                   Not seasonally adjusted                             Seasonally adjusted
                            Characteristic
                                                                                   June      May       June       June         Feb.        Mar.        Apr.        May         June
                                                                                   2008      2009      2009       2008         2009        2009        2009        2009        2009


                           AGE AND SEX

Total, 16 years and over .................................................        146,649   140,363   140,826    145,738     141,748     140,887     141,007     140,570     140,196
 16 to 19 years ...............................................................     6,343     4,910     5,608      5,620       5,184       5,083       5,103       5,082       4,999
  16 to 17 years .............................................................      2,212     1,704     1,940      1,968       1,854       1,755       1,737       1,795       1,732
  18 to 19 years .............................................................      4,130     3,206     3,667      3,653       3,348       3,300       3,353       3,260       3,251
 20 years and over .........................................................      140,307   135,453   135,218    140,118     136,564     135,804     135,904     135,488     135,197
  20 to 24 years .............................................................     14,123    12,678    13,118     13,701      13,157      13,090      13,090      12,842      12,774
  25 years and over .......................................................       126,183   122,775   122,100    126,490     123,302     122,662     122,838     122,650     122,539
   25 to 54 years ...........................................................      99,597    95,461    95,156     99,741      96,255      95,720      95,805      95,394      95,391
     25 to 34 years .........................................................      31,540    29,936    30,054     31,465      30,369      30,211      30,140      29,955      30,018
     35 to 44 years .........................................................      33,553    31,764    31,634     33,653      31,999      31,746      31,770      31,681      31,734
     45 to 54 years .........................................................      34,504    33,761    33,468     34,623      33,888      33,763      33,896      33,758      33,639
   55 years and over .....................................................         26,586    27,314    26,944     26,749      27,047      26,942      27,032      27,256      27,147

Men, 16 years and over ..................................................          78,614    74,009    74,494     77,726      74,777      74,053      74,116       74,033      73,777
 16 to 19 years ...............................................................     3,212     2,364     2,755      2,777       2,484       2,398       2,438        2,440       2,390
  16 to 17 years .............................................................      1,106       821       976        933         837         803         817          851         821
  18 to 19 years .............................................................      2,106     1,543     1,779      1,862       1,640       1,579       1,635        1,580       1,576
 20 years and over .........................................................       75,402    71,645    71,738     74,949      72,293      71,655      71,678       71,593      71,387
  20 to 24 years .............................................................      7,450     6,531     6,808      7,184       6,784       6,656       6,701        6,574       6,582
  25 years and over .......................................................        67,952    65,113    64,930     67,784      65,479      65,031      64,960       65,001      64,855
   25 to 54 years ...........................................................      53,714    50,743    50,727     53,559      51,125      50,865      50,802       50,672      50,640
     25 to 34 years .........................................................      17,367    16,090    16,257     17,279      16,449      16,288      16,199       16,082      16,194
     35 to 44 years .........................................................      18,154    17,034    16,925     18,128      17,144      17,027      17,027       17,002      16,926
     45 to 54 years .........................................................      18,193    17,618    17,545     18,152      17,532      17,550      17,576       17,588      17,520
   55 years and over .....................................................         14,238    14,371    14,202     14,225      14,354      14,166      14,157       14,329      14,214

Women, 16 years and over ............................................              68,035    66,354    66,332     68,012      66,970      66,834      66,890       66,537      66,419
 16 to 19 years ...............................................................     3,131     2,546     2,852      2,843       2,699       2,685       2,664        2,642       2,609
  16 to 17 years .............................................................      1,106       883       964      1,035       1,017         952         920          944         911
  18 to 19 years .............................................................      2,025     1,663     1,888      1,790       1,708       1,721       1,718        1,681       1,675
 20 years and over .........................................................       64,904    63,809    63,480     65,169      64,271      64,148      64,226       63,895      63,810
  20 to 24 years .............................................................      6,673     6,146     6,310      6,517       6,372       6,434       6,389        6,268       6,193
  25 years and over .......................................................        58,231    57,662    57,170     58,705      57,823      57,631      57,878       57,649      57,684
   25 to 54 years ...........................................................      45,883    44,719    44,429     46,181      45,131      44,855      45,003       44,722      44,751
     25 to 34 years .........................................................      14,173    13,846    13,796     14,186      13,920      13,922      13,941       13,873      13,825
     35 to 44 years .........................................................      15,400    14,730    14,709     15,525      14,855      14,719      14,742       14,679      14,808
     45 to 54 years .........................................................      16,311    16,143    15,923     16,471      16,356      16,214      16,320       16,170      16,118
   55 years and over .....................................................         12,348    12,943    12,742     12,524      12,693      12,776      12,875       12,927      12,933

                       MARITAL STATUS

Married men, spouse present .........................................              45,897    44,337    44,263     45,902      44,502      44,470      44,469       44,255      44,294
Married women, spouse present ....................................                 35,940    35,589    35,274     36,189      35,563      35,481      35,444       35,391      35,464
Women who maintain families ........................................                9,007     8,928     8,853      (1)         (1)         (1)         (1)          (1)         (1)

             FULL- OR PART-TIME STATUS

Full-time workers 2 .........................................................     121,845   113,083   114,014    120,486     114,853     113,665     113,725     113,318     112,942
Part-time workers 3 .........................................................      24,804    27,280    26,811     25,394      26,590      26,963      27,066      27,195      27,374

                 MULTIPLE JOBHOLDERS

Total multiple jobholders .................................................         7,694     7,265     7,067      7,780       7,626        7,656       7,748       7,292       7,160
  Percent of total employed ...........................................               5.2       5.2       5.0        5.3         5.4          5.4         5.5         5.2         5.1


   1 Data not available.                                                                                    NOTE: Detail for the seasonally adjusted data shown in this table will not
   2 Employed full-time workers are persons who usually work 35 hours or more                            necessarily add to totals because of the independent seasonal adjustment of the
per week.                                                                                                various series. Updated population controls are introduced annually with the
  3 Employed part-time workers are persons who usually work less than 35                                 release of January data.
hours per week.
HOUSEHOLD DATA                                                                                                                                                HOUSEHOLD DATA

Table A-7. Selected unemployment indicators, seasonally adjusted


                                                                                         Number of
                                                                                   unemployed persons                              Unemployment rates 1
                            Characteristic                                            (in thousands)


                                                                                  June    May      June        June        Feb.         Mar.         Apr.        May          June
                                                                                  2008    2009     2009        2008        2009         2009         2009        2009         2009


                           AGE AND SEX

Total, 16 years and over .................................................        8,662   14,511   14,729       5.6          8.1         8.5          8.9         9.4          9.5
 16 to 19 years ...............................................................   1,304    1,491    1,576      18.8         21.6        21.7         21.5        22.7         24.0
  16 to 17 years .............................................................      595      548      580      23.2         22.9        23.7         23.0        23.4         25.1
  18 to 19 years .............................................................      689      966    1,009      15.9         21.0        20.9         21.3        22.9         23.7
 20 years and over .........................................................      7,358   13,019   13,153       5.0          7.5         8.0          8.3         8.8          8.9
  20 to 24 years .............................................................    1,549    2,265    2,283      10.2         12.9        14.0         14.7        15.0         15.2
  25 years and over .......................................................       5,760   10,740   10,877       4.4          6.9         7.2          7.5         8.1          8.2
   25 to 54 years ...........................................................     4,810    8,777    8,812       4.6          7.2         7.6          7.8         8.4          8.5
     25 to 34 years .........................................................     1,841    3,514    3,359       5.5          8.7         9.0          9.7        10.5         10.1
     35 to 44 years .........................................................     1,574    2,789    2,796       4.5          6.8         7.2          7.5         8.1          8.1
     45 to 54 years .........................................................     1,395    2,474    2,657       3.9          6.2         6.6          6.4         6.8          7.3
   55 years and over .....................................................          949    1,961    2,048       3.4          5.6         6.2          6.4         6.7          7.0

Men, 16 years and over ..................................................         4,837    8,691    8,751       5.9          8.8         9.5         10.0        10.5         10.6
 16 to 19 years ...............................................................     730      889      847      20.8         24.9        25.7         25.6        26.7         26.2
  16 to 17 years .............................................................      330      301      285      26.1         26.5        28.2         26.3        26.1         25.8
  18 to 19 years .............................................................      394      609      579      17.5         24.7        24.6         25.3        27.8         26.9
 20 years and over .........................................................      4,106    7,802    7,904       5.2          8.1         8.8          9.4         9.8         10.0
  20 to 24 years .............................................................      909    1,395    1,370      11.2         14.6        16.7         17.5        17.5         17.2
  25 years and over .......................................................       3,158    6,395    6,532       4.5          7.5         7.9          8.3         9.0          9.2
   25 to 54 years ...........................................................     2,643    5,320    5,346       4.7          7.9         8.3          8.8         9.5          9.5
     25 to 34 years .........................................................     1,017    2,162    2,075       5.6          9.5        10.1         11.1        11.9         11.4
     35 to 44 years .........................................................       880    1,691    1,649       4.6          7.2         7.7          8.2         9.0          8.9
     45 to 54 years .........................................................       746    1,468    1,622       4.0          7.0         7.1          7.1         7.7          8.5
   55 years and over .....................................................          515    1,074    1,186       3.5          6.0         6.3          6.7         7.0          7.7

Women, 16 years and over ............................................             3,825    5,820    5,978       5.3          7.3         7.5          7.6         8.0          8.3
 16 to 19 years ...............................................................     574      602      729      16.8         18.3        17.8         17.4        18.6         21.8
  16 to 17 years .............................................................      265      247      295      20.4         19.8        19.4         19.9        20.7         24.4
  18 to 19 years .............................................................      295      358      430      14.1         17.0        17.2         17.1        17.5         20.4
 20 years and over .........................................................      3,252    5,217    5,249       4.8          6.7         7.0          7.1         7.5          7.6
  20 to 24 years .............................................................      640      870      913       8.9         10.9        11.0         11.5        12.2         12.8
  25 years and over .......................................................       2,602    4,345    4,345       4.2          6.2         6.5          6.6         7.0          7.0
   25 to 54 years ...........................................................     2,167    3,457    3,467       4.5          6.4         6.7          6.7         7.2          7.2
     25 to 34 years .........................................................       824    1,352    1,284       5.5          7.7         7.6          7.9         8.9          8.5
     35 to 44 years .........................................................       694    1,098    1,147       4.3          6.4         6.5          6.7         7.0          7.2
     45 to 54 years .........................................................       648    1,007    1,036       3.8          5.3         6.1          5.7         5.9          6.0
   55 years and over 2 ..................................................           439      791      874       3.4          5.3         5.8          5.4         5.8          6.4

                       MARITAL STATUS

Married men, spouse present .........................................             1,480    3,219    3,289       3.1          5.5         5.8          6.3         6.8          6.9
Married women, spouse present ....................................                1,278    2,136    2,120       3.4          5.1         5.4          5.5         5.7          5.6
Women who maintain families 2 .....................................                 768    1,102    1,173       7.9         10.3        10.8         10.0        11.0         11.7

             FULL- OR PART-TIME STATUS

Full-time workers 3 .........................................................     7,137   12,802   12,924       5.6          8.6          9.2         9.6        10.2         10.3
Part-time workers 4 .........................................................     1,463    1,737    1,724       5.4          5.8          5.9         6.1         6.0          5.9


   1 Unemployment as a percent of the civilian labor force.                                          work part time (less than 35 hours per week) or are on layoff from part-time jobs.
   2 Not seasonally adjusted.                                                                           NOTE: Detail for the seasonally adjusted data shown in this table will not
   3 Full-time workers are unemployed persons who have expressed a desire to                         necessarily add to totals because of the independent seasonal adjustment of the
work full time (35 hours or more per week) or are on layoff from full-time jobs.                     various series. Updated population controls are introduced annually with the
  4 Part-time workers are unemployed persons who have expressed a desire to                          release of January data.
HOUSEHOLD DATA                                                                                                                                          HOUSEHOLD DATA

Table A-8. Unemployed persons by reason for unemployment

(Numbers in thousands)


                                                                                       Not seasonally adjusted                    Seasonally adjusted
                                   Reason
                                                                                       June     May       June    June    Feb.      Mar.      Apr.       May     June
                                                                                       2008     2009      2009    2008    2009      2009      2009       2009    2009


                NUMBER OF UNEMPLOYED

Job losers and persons who completed temporary jobs                                    4,201    8,930     9,194   4,465   7,696      8,243    8,814      9,546   9,649
  On temporary layoff ....................................................               949    1,459     1,503   1,106   1,488      1,557    1,625      1,832   1,762
  Not on temporary layoff ..............................................               3,252    7,471     7,691   3,358   6,208      6,686    7,189      7,714   7,886
     Permanent job losers ..............................................               2,341    6,140     6,294   (1)     (1)        (1)      (1)        (1)     (1)
     Persons who completed temporary jobs ................                               912    1,331     1,397   (1)     (1)        (1)      (1)        (1)     (1)
Job leavers .....................................................................        818      851       778     847     820        887      890        910     822
Reentrants ......................................................................      2,778    3,236     3,697   2,562   2,834      2,974    3,087      3,180   3,335
New entrants ..................................................................        1,136      956     1,425     761   1,005        868      900        956     947

                  PERCENT DISTRIBUTION

Total unemployed ...........................................................           100.0    100.0     100.0   100.0   100.0      100.0    100.0      100.0   100.0
 Job losers and persons who completed temporary
  jobs .............................................................................    47.0     63.9      60.9    51.7    62.3       63.5     64.4       65.4    65.4
    On temporary layoff ..................................................              10.6     10.4      10.0    12.8    12.0       12.0     11.9       12.6    11.9
    Not on temporary layoff ............................................                36.4     53.5      51.0    38.9    50.2       51.5     52.5       52.9    53.5
 Job leavers ...................................................................         9.2      6.1       5.2     9.8     6.6        6.8      6.5        6.2     5.6
 Reentrants ....................................................................        31.1     23.2      24.5    29.7    22.9       22.9     22.5       21.8    22.6
 New entrants ................................................................          12.7      6.8       9.4     8.8     8.1        6.7      6.6        6.6     6.4

      UNEMPLOYED AS A PERCENT OF THE
            CIVILIAN LABOR FORCE

 Job losers and persons who completed temporary
  jobs .............................................................................     2.7      5.8       5.9     2.9     5.0        5.4      5.7        6.2     6.2
 Job leavers ...................................................................          .5       .6        .5      .5      .5         .6       .6         .6      .5
 Reentrants ....................................................................         1.8      2.1       2.4     1.7     1.8        1.9      2.0        2.1     2.2
 New entrants ................................................................            .7       .6        .9      .5      .7         .6       .6         .6      .6


   1 Data not available.
   NOTE: Updated population controls are introduced annually with the release of January data.
Us Department Of Labor Mass Layoffs June 2009

Mais conteúdo relacionado

Semelhante a Us Department Of Labor Mass Layoffs June 2009

September Jobs Report from the Bureau of Labor Statistics
September Jobs Report from the Bureau of Labor StatisticsSeptember Jobs Report from the Bureau of Labor Statistics
September Jobs Report from the Bureau of Labor StatisticsDavid White
 
Myanmar and Asia Economies
Myanmar and Asia EconomiesMyanmar and Asia Economies
Myanmar and Asia EconomiesKaungHtetZawSMU
 
Granite Company Overview 2013 | Nationwide Voice and Data for Businesses
Granite Company Overview 2013 | Nationwide Voice and Data for BusinessesGranite Company Overview 2013 | Nationwide Voice and Data for Businesses
Granite Company Overview 2013 | Nationwide Voice and Data for BusinessesShane Hoff
 
Urban Indian Workers' Labor Market Transitions
Urban Indian Workers' Labor Market TransitionsUrban Indian Workers' Labor Market Transitions
Urban Indian Workers' Labor Market TransitionsJyotirmoy Bhattacharya
 
qwest communications Historical Quarterly Results1Q 06_3Q08
qwest communications Historical Quarterly Results1Q 06_3Q08qwest communications Historical Quarterly Results1Q 06_3Q08
qwest communications Historical Quarterly Results1Q 06_3Q08finance19
 
Развитие финансового сектора Казахстана в посткризисный период
Развитие финансового сектора Казахстана в посткризисный периодРазвитие финансового сектора Казахстана в посткризисный период
Развитие финансового сектора Казахстана в посткризисный периодАО "Самрук-Казына"
 
CSO Quarterly National Household Survey
CSO Quarterly National Household SurveyCSO Quarterly National Household Survey
CSO Quarterly National Household SurveyExSite
 
Progressive loss report_0608_appendix
Progressive loss report_0608_appendixProgressive loss report_0608_appendix
Progressive loss report_0608_appendixfinance18
 
Slide show keropok leko
Slide show keropok lekoSlide show keropok leko
Slide show keropok lekoAtiQah NOtyh
 
enterpriseSeattle Forecast 2012 - Ken Goldstein
enterpriseSeattle Forecast 2012 - Ken GoldsteinenterpriseSeattle Forecast 2012 - Ken Goldstein
enterpriseSeattle Forecast 2012 - Ken GoldsteinenterpriseSeattle
 
Dr. Stephen Fuller - 13th Annual Economic Summit
Dr. Stephen Fuller - 13th Annual Economic SummitDr. Stephen Fuller - 13th Annual Economic Summit
Dr. Stephen Fuller - 13th Annual Economic SummitNVAR .com
 
crown holdings 2006AR
  crown holdings  2006AR  crown holdings  2006AR
crown holdings 2006ARfinance30
 

Semelhante a Us Department Of Labor Mass Layoffs June 2009 (20)

Utah Counties in Review 2010
Utah Counties in Review 2010Utah Counties in Review 2010
Utah Counties in Review 2010
 
September Jobs Report from the Bureau of Labor Statistics
September Jobs Report from the Bureau of Labor StatisticsSeptember Jobs Report from the Bureau of Labor Statistics
September Jobs Report from the Bureau of Labor Statistics
 
Myanmar and Asia Economies
Myanmar and Asia EconomiesMyanmar and Asia Economies
Myanmar and Asia Economies
 
Jan 2010 Austin Economic Indicators
Jan 2010 Austin Economic IndicatorsJan 2010 Austin Economic Indicators
Jan 2010 Austin Economic Indicators
 
Jan 2010 Austin Economic Indicators
Jan 2010 Austin Economic IndicatorsJan 2010 Austin Economic Indicators
Jan 2010 Austin Economic Indicators
 
Granite Company Overview 2013 | Nationwide Voice and Data for Businesses
Granite Company Overview 2013 | Nationwide Voice and Data for BusinessesGranite Company Overview 2013 | Nationwide Voice and Data for Businesses
Granite Company Overview 2013 | Nationwide Voice and Data for Businesses
 
Urban Indian Workers' Labor Market Transitions
Urban Indian Workers' Labor Market TransitionsUrban Indian Workers' Labor Market Transitions
Urban Indian Workers' Labor Market Transitions
 
Haiti
HaitiHaiti
Haiti
 
qwest communications Historical Quarterly Results1Q 06_3Q08
qwest communications Historical Quarterly Results1Q 06_3Q08qwest communications Historical Quarterly Results1Q 06_3Q08
qwest communications Historical Quarterly Results1Q 06_3Q08
 
Развитие финансового сектора Казахстана в посткризисный период
Развитие финансового сектора Казахстана в посткризисный периодРазвитие финансового сектора Казахстана в посткризисный период
Развитие финансового сектора Казахстана в посткризисный период
 
CSO Quarterly National Household Survey
CSO Quarterly National Household SurveyCSO Quarterly National Household Survey
CSO Quarterly National Household Survey
 
Progressive loss report_0608_appendix
Progressive loss report_0608_appendixProgressive loss report_0608_appendix
Progressive loss report_0608_appendix
 
SMS Production
SMS ProductionSMS Production
SMS Production
 
Slide show keropok leko
Slide show keropok lekoSlide show keropok leko
Slide show keropok leko
 
Chris Caton's Economic Preview for AIM NSW & ACT, 2013
Chris Caton's Economic Preview for AIM NSW & ACT, 2013Chris Caton's Economic Preview for AIM NSW & ACT, 2013
Chris Caton's Economic Preview for AIM NSW & ACT, 2013
 
enterpriseSeattle Forecast 2012 - Ken Goldstein
enterpriseSeattle Forecast 2012 - Ken GoldsteinenterpriseSeattle Forecast 2012 - Ken Goldstein
enterpriseSeattle Forecast 2012 - Ken Goldstein
 
Dr. Stephen Fuller - 13th Annual Economic Summit
Dr. Stephen Fuller - 13th Annual Economic SummitDr. Stephen Fuller - 13th Annual Economic Summit
Dr. Stephen Fuller - 13th Annual Economic Summit
 
crown holdings 2006AR
  crown holdings  2006AR  crown holdings  2006AR
crown holdings 2006AR
 
2006AR
2006AR2006AR
2006AR
 
2006AR
2006AR2006AR
2006AR
 

Mais de Breaking news

Ustream Sued by Square Ring Productions
Ustream Sued by Square Ring ProductionsUstream Sued by Square Ring Productions
Ustream Sued by Square Ring ProductionsBreaking news
 
Saez U Stopincomes 2007
Saez U Stopincomes 2007Saez U Stopincomes 2007
Saez U Stopincomes 2007Breaking news
 
Template Twitter Strategy for Government Departments
Template Twitter Strategy for Government DepartmentsTemplate Twitter Strategy for Government Departments
Template Twitter Strategy for Government DepartmentsBreaking news
 
Lawsuit Against Ruth Madoff (Irving Picard)
Lawsuit Against Ruth Madoff (Irving Picard)Lawsuit Against Ruth Madoff (Irving Picard)
Lawsuit Against Ruth Madoff (Irving Picard)Breaking news
 
Unlocking Energy Efficiency In The Us Economy
Unlocking Energy Efficiency In The Us EconomyUnlocking Energy Efficiency In The Us Economy
Unlocking Energy Efficiency In The Us EconomyBreaking news
 
Concealed Weapons Law 2009
Concealed Weapons Law 2009Concealed Weapons Law 2009
Concealed Weapons Law 2009Breaking news
 
Projection Map Of The Eclipse Path
Projection Map Of The Eclipse PathProjection Map Of The Eclipse Path
Projection Map Of The Eclipse PathBreaking news
 
Venture Capital Investment Report Q2 2009
Venture Capital Investment Report Q2 2009Venture Capital Investment Report Q2 2009
Venture Capital Investment Report Q2 2009Breaking news
 
Yahoo Q2 Earnings Press Release
Yahoo Q2 Earnings Press ReleaseYahoo Q2 Earnings Press Release
Yahoo Q2 Earnings Press ReleaseBreaking news
 
Options For Financing Health Reform Comparing The Impact Of Selected Policy O...
Options For Financing Health Reform Comparing The Impact Of Selected Policy O...Options For Financing Health Reform Comparing The Impact Of Selected Policy O...
Options For Financing Health Reform Comparing The Impact Of Selected Policy O...Breaking news
 
I 9 Audit Krispy Kreme
I 9 Audit  Krispy KremeI 9 Audit  Krispy Kreme
I 9 Audit Krispy KremeBreaking news
 
Jackson Kids Birth Certificates
Jackson Kids Birth CertificatesJackson Kids Birth Certificates
Jackson Kids Birth CertificatesBreaking news
 
Simplicity Crib Recall 2009
Simplicity Crib Recall 2009Simplicity Crib Recall 2009
Simplicity Crib Recall 2009Breaking news
 
F As In Fat Obesity Report
F As In Fat Obesity ReportF As In Fat Obesity Report
F As In Fat Obesity ReportBreaking news
 
High Court Of New Delhi Legalizes+Gay+Sex
High  Court Of New Delhi Legalizes+Gay+SexHigh  Court Of New Delhi Legalizes+Gay+Sex
High Court Of New Delhi Legalizes+Gay+SexBreaking news
 
WHITE HOUSE Staff Salaries 2009
WHITE HOUSE Staff Salaries 2009WHITE HOUSE Staff Salaries 2009
WHITE HOUSE Staff Salaries 2009Breaking news
 

Mais de Breaking news (18)

Ustream Sued by Square Ring Productions
Ustream Sued by Square Ring ProductionsUstream Sued by Square Ring Productions
Ustream Sued by Square Ring Productions
 
Saez U Stopincomes 2007
Saez U Stopincomes 2007Saez U Stopincomes 2007
Saez U Stopincomes 2007
 
Template Twitter Strategy for Government Departments
Template Twitter Strategy for Government DepartmentsTemplate Twitter Strategy for Government Departments
Template Twitter Strategy for Government Departments
 
Lawsuit Against Ruth Madoff (Irving Picard)
Lawsuit Against Ruth Madoff (Irving Picard)Lawsuit Against Ruth Madoff (Irving Picard)
Lawsuit Against Ruth Madoff (Irving Picard)
 
Unlocking Energy Efficiency In The Us Economy
Unlocking Energy Efficiency In The Us EconomyUnlocking Energy Efficiency In The Us Economy
Unlocking Energy Efficiency In The Us Economy
 
Rnc health Survey
Rnc health SurveyRnc health Survey
Rnc health Survey
 
Concealed Weapons Law 2009
Concealed Weapons Law 2009Concealed Weapons Law 2009
Concealed Weapons Law 2009
 
Projection Map Of The Eclipse Path
Projection Map Of The Eclipse PathProjection Map Of The Eclipse Path
Projection Map Of The Eclipse Path
 
Venture Capital Investment Report Q2 2009
Venture Capital Investment Report Q2 2009Venture Capital Investment Report Q2 2009
Venture Capital Investment Report Q2 2009
 
Rnc Memo 1
Rnc Memo 1Rnc Memo 1
Rnc Memo 1
 
Yahoo Q2 Earnings Press Release
Yahoo Q2 Earnings Press ReleaseYahoo Q2 Earnings Press Release
Yahoo Q2 Earnings Press Release
 
Options For Financing Health Reform Comparing The Impact Of Selected Policy O...
Options For Financing Health Reform Comparing The Impact Of Selected Policy O...Options For Financing Health Reform Comparing The Impact Of Selected Policy O...
Options For Financing Health Reform Comparing The Impact Of Selected Policy O...
 
I 9 Audit Krispy Kreme
I 9 Audit  Krispy KremeI 9 Audit  Krispy Kreme
I 9 Audit Krispy Kreme
 
Jackson Kids Birth Certificates
Jackson Kids Birth CertificatesJackson Kids Birth Certificates
Jackson Kids Birth Certificates
 
Simplicity Crib Recall 2009
Simplicity Crib Recall 2009Simplicity Crib Recall 2009
Simplicity Crib Recall 2009
 
F As In Fat Obesity Report
F As In Fat Obesity ReportF As In Fat Obesity Report
F As In Fat Obesity Report
 
High Court Of New Delhi Legalizes+Gay+Sex
High  Court Of New Delhi Legalizes+Gay+SexHigh  Court Of New Delhi Legalizes+Gay+Sex
High Court Of New Delhi Legalizes+Gay+Sex
 
WHITE HOUSE Staff Salaries 2009
WHITE HOUSE Staff Salaries 2009WHITE HOUSE Staff Salaries 2009
WHITE HOUSE Staff Salaries 2009
 

Último

2024 03 13 AZ GOP LD4 Gen Meeting Minutes_FINAL.docx
2024 03 13 AZ GOP LD4 Gen Meeting Minutes_FINAL.docx2024 03 13 AZ GOP LD4 Gen Meeting Minutes_FINAL.docx
2024 03 13 AZ GOP LD4 Gen Meeting Minutes_FINAL.docxkfjstone13
 
BDSM⚡Call Girls in Sector 143 Noida Escorts >༒8448380779 Escort Service
BDSM⚡Call Girls in Sector 143 Noida Escorts >༒8448380779 Escort ServiceBDSM⚡Call Girls in Sector 143 Noida Escorts >༒8448380779 Escort Service
BDSM⚡Call Girls in Sector 143 Noida Escorts >༒8448380779 Escort ServiceDelhi Call girls
 
BDSM⚡Call Girls in Sector 135 Noida Escorts >༒8448380779 Escort Service
BDSM⚡Call Girls in Sector 135 Noida Escorts >༒8448380779 Escort ServiceBDSM⚡Call Girls in Sector 135 Noida Escorts >༒8448380779 Escort Service
BDSM⚡Call Girls in Sector 135 Noida Escorts >༒8448380779 Escort ServiceDelhi Call girls
 
Pakistan PMLN Election Manifesto 2024.pdf
Pakistan PMLN Election Manifesto 2024.pdfPakistan PMLN Election Manifesto 2024.pdf
Pakistan PMLN Election Manifesto 2024.pdfFahimUddin61
 
BDSM⚡Call Girls in Indirapuram Escorts >༒8448380779 Escort Service
BDSM⚡Call Girls in Indirapuram Escorts >༒8448380779 Escort ServiceBDSM⚡Call Girls in Indirapuram Escorts >༒8448380779 Escort Service
BDSM⚡Call Girls in Indirapuram Escorts >༒8448380779 Escort ServiceDelhi Call girls
 
AI as Research Assistant: Upscaling Content Analysis to Identify Patterns of ...
AI as Research Assistant: Upscaling Content Analysis to Identify Patterns of ...AI as Research Assistant: Upscaling Content Analysis to Identify Patterns of ...
AI as Research Assistant: Upscaling Content Analysis to Identify Patterns of ...Axel Bruns
 
TDP As the Party of Hope For AP Youth Under N Chandrababu Naidu’s Leadership
TDP As the Party of Hope For AP Youth Under N Chandrababu Naidu’s LeadershipTDP As the Party of Hope For AP Youth Under N Chandrababu Naidu’s Leadership
TDP As the Party of Hope For AP Youth Under N Chandrababu Naidu’s Leadershipanjanibaddipudi1
 
Enjoy Night⚡Call Girls Rajokri Delhi >༒8448380779 Escort Service
Enjoy Night⚡Call Girls Rajokri Delhi >༒8448380779 Escort ServiceEnjoy Night⚡Call Girls Rajokri Delhi >༒8448380779 Escort Service
Enjoy Night⚡Call Girls Rajokri Delhi >༒8448380779 Escort ServiceDelhi Call girls
 
KAHULUGAN AT KAHALAGAHAN NG GAWAING PANSIBIKO.pptx
KAHULUGAN AT KAHALAGAHAN NG GAWAING PANSIBIKO.pptxKAHULUGAN AT KAHALAGAHAN NG GAWAING PANSIBIKO.pptx
KAHULUGAN AT KAHALAGAHAN NG GAWAING PANSIBIKO.pptxjohnandrewcarlos
 
Minto-Morley Reforms 1909 (constitution).pptx
Minto-Morley Reforms 1909 (constitution).pptxMinto-Morley Reforms 1909 (constitution).pptx
Minto-Morley Reforms 1909 (constitution).pptxAwaiskhalid96
 
29042024_First India Newspaper Jaipur.pdf
29042024_First India Newspaper Jaipur.pdf29042024_First India Newspaper Jaipur.pdf
29042024_First India Newspaper Jaipur.pdfFIRST INDIA
 
WhatsApp 📞 8448380779 ✅Call Girls In Chaura Sector 22 ( Noida)
WhatsApp 📞 8448380779 ✅Call Girls In Chaura Sector 22 ( Noida)WhatsApp 📞 8448380779 ✅Call Girls In Chaura Sector 22 ( Noida)
WhatsApp 📞 8448380779 ✅Call Girls In Chaura Sector 22 ( Noida)Delhi Call girls
 
Israel Palestine Conflict, The issue and historical context!
Israel Palestine Conflict, The issue and historical context!Israel Palestine Conflict, The issue and historical context!
Israel Palestine Conflict, The issue and historical context!Krish109503
 
如何办理(BU学位证书)美国贝翰文大学毕业证学位证书
如何办理(BU学位证书)美国贝翰文大学毕业证学位证书如何办理(BU学位证书)美国贝翰文大学毕业证学位证书
如何办理(BU学位证书)美国贝翰文大学毕业证学位证书Fi L
 
Powerful Love Spells in Phoenix, AZ (310) 882-6330 Bring Back Lost Lover
Powerful Love Spells in Phoenix, AZ (310) 882-6330 Bring Back Lost LoverPowerful Love Spells in Phoenix, AZ (310) 882-6330 Bring Back Lost Lover
Powerful Love Spells in Phoenix, AZ (310) 882-6330 Bring Back Lost LoverPsychicRuben LoveSpells
 
Gujarat-SEBCs.pdf pfpkoopapriorjfperjreie
Gujarat-SEBCs.pdf pfpkoopapriorjfperjreieGujarat-SEBCs.pdf pfpkoopapriorjfperjreie
Gujarat-SEBCs.pdf pfpkoopapriorjfperjreiebhavenpr
 
Lorenzo D'Emidio_Lavoro sullaNorth Korea .pptx
Lorenzo D'Emidio_Lavoro sullaNorth Korea .pptxLorenzo D'Emidio_Lavoro sullaNorth Korea .pptx
Lorenzo D'Emidio_Lavoro sullaNorth Korea .pptxlorenzodemidio01
 
Embed-4.pdf lkdiinlajeklhndklheduhuekjdh
Embed-4.pdf lkdiinlajeklhndklheduhuekjdhEmbed-4.pdf lkdiinlajeklhndklheduhuekjdh
Embed-4.pdf lkdiinlajeklhndklheduhuekjdhbhavenpr
 
Verified Love Spells in Little Rock, AR (310) 882-6330 Get My Ex-Lover Back
Verified Love Spells in Little Rock, AR (310) 882-6330 Get My Ex-Lover BackVerified Love Spells in Little Rock, AR (310) 882-6330 Get My Ex-Lover Back
Verified Love Spells in Little Rock, AR (310) 882-6330 Get My Ex-Lover BackPsychicRuben LoveSpells
 
₹5.5k {Cash Payment} Independent Greater Noida Call Girls In [Delhi INAYA] 🔝|...
₹5.5k {Cash Payment} Independent Greater Noida Call Girls In [Delhi INAYA] 🔝|...₹5.5k {Cash Payment} Independent Greater Noida Call Girls In [Delhi INAYA] 🔝|...
₹5.5k {Cash Payment} Independent Greater Noida Call Girls In [Delhi INAYA] 🔝|...Diya Sharma
 

Último (20)

2024 03 13 AZ GOP LD4 Gen Meeting Minutes_FINAL.docx
2024 03 13 AZ GOP LD4 Gen Meeting Minutes_FINAL.docx2024 03 13 AZ GOP LD4 Gen Meeting Minutes_FINAL.docx
2024 03 13 AZ GOP LD4 Gen Meeting Minutes_FINAL.docx
 
BDSM⚡Call Girls in Sector 143 Noida Escorts >༒8448380779 Escort Service
BDSM⚡Call Girls in Sector 143 Noida Escorts >༒8448380779 Escort ServiceBDSM⚡Call Girls in Sector 143 Noida Escorts >༒8448380779 Escort Service
BDSM⚡Call Girls in Sector 143 Noida Escorts >༒8448380779 Escort Service
 
BDSM⚡Call Girls in Sector 135 Noida Escorts >༒8448380779 Escort Service
BDSM⚡Call Girls in Sector 135 Noida Escorts >༒8448380779 Escort ServiceBDSM⚡Call Girls in Sector 135 Noida Escorts >༒8448380779 Escort Service
BDSM⚡Call Girls in Sector 135 Noida Escorts >༒8448380779 Escort Service
 
Pakistan PMLN Election Manifesto 2024.pdf
Pakistan PMLN Election Manifesto 2024.pdfPakistan PMLN Election Manifesto 2024.pdf
Pakistan PMLN Election Manifesto 2024.pdf
 
BDSM⚡Call Girls in Indirapuram Escorts >༒8448380779 Escort Service
BDSM⚡Call Girls in Indirapuram Escorts >༒8448380779 Escort ServiceBDSM⚡Call Girls in Indirapuram Escorts >༒8448380779 Escort Service
BDSM⚡Call Girls in Indirapuram Escorts >༒8448380779 Escort Service
 
AI as Research Assistant: Upscaling Content Analysis to Identify Patterns of ...
AI as Research Assistant: Upscaling Content Analysis to Identify Patterns of ...AI as Research Assistant: Upscaling Content Analysis to Identify Patterns of ...
AI as Research Assistant: Upscaling Content Analysis to Identify Patterns of ...
 
TDP As the Party of Hope For AP Youth Under N Chandrababu Naidu’s Leadership
TDP As the Party of Hope For AP Youth Under N Chandrababu Naidu’s LeadershipTDP As the Party of Hope For AP Youth Under N Chandrababu Naidu’s Leadership
TDP As the Party of Hope For AP Youth Under N Chandrababu Naidu’s Leadership
 
Enjoy Night⚡Call Girls Rajokri Delhi >༒8448380779 Escort Service
Enjoy Night⚡Call Girls Rajokri Delhi >༒8448380779 Escort ServiceEnjoy Night⚡Call Girls Rajokri Delhi >༒8448380779 Escort Service
Enjoy Night⚡Call Girls Rajokri Delhi >༒8448380779 Escort Service
 
KAHULUGAN AT KAHALAGAHAN NG GAWAING PANSIBIKO.pptx
KAHULUGAN AT KAHALAGAHAN NG GAWAING PANSIBIKO.pptxKAHULUGAN AT KAHALAGAHAN NG GAWAING PANSIBIKO.pptx
KAHULUGAN AT KAHALAGAHAN NG GAWAING PANSIBIKO.pptx
 
Minto-Morley Reforms 1909 (constitution).pptx
Minto-Morley Reforms 1909 (constitution).pptxMinto-Morley Reforms 1909 (constitution).pptx
Minto-Morley Reforms 1909 (constitution).pptx
 
29042024_First India Newspaper Jaipur.pdf
29042024_First India Newspaper Jaipur.pdf29042024_First India Newspaper Jaipur.pdf
29042024_First India Newspaper Jaipur.pdf
 
WhatsApp 📞 8448380779 ✅Call Girls In Chaura Sector 22 ( Noida)
WhatsApp 📞 8448380779 ✅Call Girls In Chaura Sector 22 ( Noida)WhatsApp 📞 8448380779 ✅Call Girls In Chaura Sector 22 ( Noida)
WhatsApp 📞 8448380779 ✅Call Girls In Chaura Sector 22 ( Noida)
 
Israel Palestine Conflict, The issue and historical context!
Israel Palestine Conflict, The issue and historical context!Israel Palestine Conflict, The issue and historical context!
Israel Palestine Conflict, The issue and historical context!
 
如何办理(BU学位证书)美国贝翰文大学毕业证学位证书
如何办理(BU学位证书)美国贝翰文大学毕业证学位证书如何办理(BU学位证书)美国贝翰文大学毕业证学位证书
如何办理(BU学位证书)美国贝翰文大学毕业证学位证书
 
Powerful Love Spells in Phoenix, AZ (310) 882-6330 Bring Back Lost Lover
Powerful Love Spells in Phoenix, AZ (310) 882-6330 Bring Back Lost LoverPowerful Love Spells in Phoenix, AZ (310) 882-6330 Bring Back Lost Lover
Powerful Love Spells in Phoenix, AZ (310) 882-6330 Bring Back Lost Lover
 
Gujarat-SEBCs.pdf pfpkoopapriorjfperjreie
Gujarat-SEBCs.pdf pfpkoopapriorjfperjreieGujarat-SEBCs.pdf pfpkoopapriorjfperjreie
Gujarat-SEBCs.pdf pfpkoopapriorjfperjreie
 
Lorenzo D'Emidio_Lavoro sullaNorth Korea .pptx
Lorenzo D'Emidio_Lavoro sullaNorth Korea .pptxLorenzo D'Emidio_Lavoro sullaNorth Korea .pptx
Lorenzo D'Emidio_Lavoro sullaNorth Korea .pptx
 
Embed-4.pdf lkdiinlajeklhndklheduhuekjdh
Embed-4.pdf lkdiinlajeklhndklheduhuekjdhEmbed-4.pdf lkdiinlajeklhndklheduhuekjdh
Embed-4.pdf lkdiinlajeklhndklheduhuekjdh
 
Verified Love Spells in Little Rock, AR (310) 882-6330 Get My Ex-Lover Back
Verified Love Spells in Little Rock, AR (310) 882-6330 Get My Ex-Lover BackVerified Love Spells in Little Rock, AR (310) 882-6330 Get My Ex-Lover Back
Verified Love Spells in Little Rock, AR (310) 882-6330 Get My Ex-Lover Back
 
₹5.5k {Cash Payment} Independent Greater Noida Call Girls In [Delhi INAYA] 🔝|...
₹5.5k {Cash Payment} Independent Greater Noida Call Girls In [Delhi INAYA] 🔝|...₹5.5k {Cash Payment} Independent Greater Noida Call Girls In [Delhi INAYA] 🔝|...
₹5.5k {Cash Payment} Independent Greater Noida Call Girls In [Delhi INAYA] 🔝|...
 

Us Department Of Labor Mass Layoffs June 2009

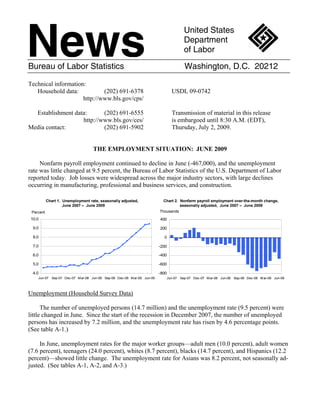
  • 1. News United States Department of Labor Bureau of Labor Statistics Washington, D.C. 20212 Technical information: Household data: (202) 691-6378 USDL 09-0742 http://www.bls.gov/cps/ Establishment data: (202) 691-6555 Transmission of material in this release http://www.bls.gov/ces/ is embargoed until 8:30 A.M. (EDT), Media contact: (202) 691-5902 Thursday, July 2, 2009. THE EMPLOYMENT SITUATION: JUNE 2009 Nonfarm payroll employment continued to decline in June (-467,000), and the unemployment rate was little changed at 9.5 percent, the Bureau of Labor Statistics of the U.S. Department of Labor reported today. Job losses were widespread across the major industry sectors, with large declines occurring in manufacturing, professional and business services, and construction. Chart 1. Unemployment rate, seasonally adjusted, Chart 2. Nonfarm payroll employment over-the-month change, June 2007 – June 2009 seasonally adjusted, June 2007 – June 2009 Percent Thousands 10.0 400 9.0 200 8.0 0 7.0 -200 6.0 -400 5.0 -600 4.0 -800 Jun-07 Sep-07 Dec-07 M ar-08 Jun-08 Sep-08 Dec-08 M ar-09 Jun-09 Jun-07 Sep-07 Dec-07 M ar-08 Jun-08 Sep-08 Dec-08 M ar-09 Jun-09 Unemployment (Household Survey Data) The number of unemployed persons (14.7 million) and the unemployment rate (9.5 percent) were little changed in June. Since the start of the recession in December 2007, the number of unemployed persons has increased by 7.2 million, and the unemployment rate has risen by 4.6 percentage points. (See table A-1.) In June, unemployment rates for the major worker groups—adult men (10.0 percent), adult women (7.6 percent), teenagers (24.0 percent), whites (8.7 percent), blacks (14.7 percent), and Hispanics (12.2 percent)—showed little change. The unemployment rate for Asians was 8.2 percent, not seasonally ad- justed. (See tables A-1, A-2, and A-3.)
  • 2. 2 Table A. Major indicators of labor market activity, seasonally adjusted (Numbers in thousands) Quarterly averages Monthly data May-June Category I 2009 II 2009 Apr. 2009 May 2009 June 2009 change HOUSEHOLD DATA Labor force status Civilian labor force …………….…………… 153,993 154,912 154,731 155,081 154,926 -155 Employment …………………….………… 141,578 140,591 141,007 140,570 140,196 -374 Unemployment ……………….…………… 12,415 14,321 13,724 14,511 14,729 218 Not in labor force ………………….………… 80,920 80,547 80,541 80,371 80,729 358 Unemployment rates All workers ……………….……………....… 8.1 9.2 8.9 9.4 9.5 0.1 Adult men …………………....……...…… 8.2 9.7 9.4 9.8 10.0 .2 Adult women ………….…………………… 6.7 7.4 7.1 7.5 7.6 .1 Teenagers ………….………………...…… 21.3 22.7 21.5 22.7 24.0 1.3 White ……….………….…...…………… 7.4 8.4 8.0 8.6 8.7 .1 Black or African American ………….…… 13.1 14.9 15.0 14.9 14.7 -.2 Hispanic or Latino ethnicity ………..…… 10.7 12.0 11.3 12.7 12.2 -.5 ESTABLISHMENT DATA Employment Nonfarm employment ……….……...……… 133,662 p 132,111 132,481 p 132,159 p 131,692 p -467 Goods-producing 1…...…...……………… 19,826 p 19,035 19,253 p 19,038 p 18,815 p -223 Construction ..…...…………….………… 6,590 p 6,309 6,367 p 6,319 p 6,240 p -79 Manufacturing …………………....…… 12,468 p 11,997 12,146 p 11,990 p 11,854 p -136 Service-providing 1 ………...……..……… 113,835 p 113,075 113,228 p 113,121 p 112,877 p -244 Retail trade 2 …...…………….…..…… 14,933 p 14,821 14,840 p 14,822 p 14,801 p -21 Professional and business service ….....… 17,048 p 16,712 16,783 p 16,735 p 16,617 p -118 Education and health services …..…….… 19,138 p 19,218 19,175 p 19,222 p 19,256 p 34 Leisure and hospitality …...……………. 13,235 p 13,174 13,168 p 13,186 p 13,168 p -18 Government ………...…………………… 22,543 p 22,592 22,616 p 22,606 p 22,554 p -52 Hours of work 3 Total private ……...…………...…………… 33.2 p 33.1 33.1 p 33.1 p 33.0 p -0.1 Manufacturing …………….……...……… 39.6 p 39.5 39.6 p 39.4 p 39.5 p .1 Overtime ……...………………..…….… 2.7 p 2.8 2.7 p 2.8 p 2.8 p .0 Indexes of aggregate weekly hours (2002=100) 3 Total private ……...………………….……… 101.7 p 99.6 100.1 p 99.8 p 99.0 p -0.8 Earnings 3 Average hourly earnings, total private …...… $18.46 p $18.52 $18.50 p $18.53 p $18.53 p $0.00 Average weekly earnings, total private ……. 613.60 p 612.39 612.35 p 613.34 p 611.49 p -1.85 1 Includes other industries, not shown separately. 2 Quarterly averages and the over-the-month change are calculated using unrounded data. 3 Data relate to private production and nonsupervisory workers. p = preliminary.
  • 3. 3 Among the unemployed, the number of job losers and persons who completed temporary jobs (9.6 million) was little changed in June after increasing by an average of 615,000 per month during the first 5 months of this year. (See table A-8.) The number of long-term unemployed (those jobless for 27 weeks or more) increased by 433,000 over the month to 4.4 million. In June, 3 in 10 unemployed persons were jobless for 27 weeks or more. (See table A-9.) Total Employment and the Labor Force (Household Survey Data) The civilian labor force participation rate was little changed in June at 65.7 percent. The employ- ment-population ratio, at 59.5 percent, continued to trend down over the month. The employment-pop- ulation ratio has declined by 3.2 percentage points since the start of the recession in December 2007. (See table A-1.) The number of persons working part time for economic reasons (sometimes referred to as involun- tary part-time workers) was little changed in June at 9.0 million. Since the start of the recession, the number of such workers has increased by 4.4 million. (See table A-5.) Persons Not in the Labor Force (Household Survey Data) About 2.2 million persons (not seasonally adjusted) were marginally attached to the labor force in June, 618,000 more than a year earlier. These individuals wanted and were available for work and had looked for a job sometime in the past 12 months. They were not counted as unemployed because they had not searched for work in the 4 weeks preceding the survey. Among the marginally attached, there were 793,000 discouraged workers in June, up by 373,000 from a year earlier. Discouraged workers are persons not currently looking for work because they believe no jobs are available for them. The other 1.4 million persons marginally attached to the labor force in June had not searched for work in the 4 weeks preceding the survey for reasons such as school attendance or family responsibilities. (See table A-13.) Industry Payroll Employment (Establishment Survey Data) Total nonfarm payroll employment continued to decline in June (-467,000). Job losses from April to June averaged 436,000 per month, compared with losses averaging 670,000 per month from November to March. Since the recession began in December 2007, payroll employment has fallen by 6.5 million. In June, job losses continued to be widespread across major industry sectors. (See table B-1.) Employment in manufacturing fell by 136,000 over the month and has declined by 1.9 million during the recession. Within the durable goods industry, motor vehicles and parts (-27,000), fabri- cated metal products (-18,000), computer and electronic products (-16,000), and machinery (-14,000) continued to lose jobs in June. Since the recession began, employment in motor vehicles and parts has declined by 335,000, or about one-third. In June, employment in construction fell by 79,000, with losses spread throughout the industry. Since the start of the recession, construction employment has fallen by 1.3 million. Mining employ- ment fell by 8,000 in June, about in line with the average monthly decline since its recent peak in October 2008.
  • 4. 4 Employment in the professional and business services industry declined by 118,000 in June. This industry has shed 1.5 million jobs since an employment peak in December 2007. Within this sector, employment in temporary help services fell by 38,000 in June; this industry has lost 848,000 jobs since the start of the recession. Retail trade employment edged down in June (-21,000); job losses in retail trade have moderated in the past 3 months. Over the month, job losses continued in automobile dealerships (-9,000). Employ- ment continued to fall in wholesale trade (-16,000). In June, financial activities employment continued to decline (-27,000). Since the start of the recession, this industry has lost 489,000 jobs. In June, employment declined in credit intermediation and related activities (-10,000) and in securities, commodity contracts, and investments (-6,000). The information industry lost 21,000 jobs over the month and 187,000 since the start of the re- cession. Publishing accounted for about half of the employment decline in the information industry during the recession. Health care employment increased by 21,000 in June. Job gains in health care have averaged 21,000 per month thus far in 2009, down from an average of 30,000 per month during 2008. Employ- ment in federal government fell by 49,000 in June, largely due to the layoff of workers temporarily hired to prepare for Census 2010. The change in total nonfarm employment for April was revised from -504,000 to -519,000, and the change for May was revised from -345,000 to -322,000. Weekly Hours (Establishment Survey Data) In June, the average workweek for production and nonsupervisory workers on private nonfarm payrolls fell by 0.1 hour to 33.0 hours—the lowest level on record for the series, which began in 1964. The manufacturing workweek rose by 0.1 hour to 39.5 hours, and factory overtime was unchanged at 2.8 hours. (See table B-2.) The index of aggregate weekly hours of production and nonsupervisory workers on private nonfarm payrolls fell by 0.8 percent in June. The manufacturing index declined by 1.2 percent over the month. (See table B-5.) Hourly and Weekly Earnings (Establishment Survey Data) In June, average hourly earnings of production and nonsupervisory workers on private nonfarm payrolls were unchanged at $18.53. Over the past 12 months, average hourly earnings have increased by 2.7 percent, while weekly earnings have risen by only 0.9 percent, reflecting a decline in the average workweek. (See table B-3.) ______________________________ The Employment Situation for July 2009 is scheduled to be released on Friday, August 7, at 8:30 A.M. (EDT).
  • 5. 5 Upcoming Changes to The Employment Situation News Release Beginning with the next edition of The Employment Situation news release scheduled for publication on August 7, 2009, the Bureau of Labor Statistics will introduce changes in the presentation of the text section of the release. There will be no changes to the format and content of the tables. A sample of the revamped Employment Situation will be posted on the BLS Web site on Monday, July 6. For further information, please see http://www.bls.gov/bls/changes_to_text_sections_of_nrs.htm.
  • 6. 6 Frequently Asked Questions about Employment and Unemployment Estimates Why are there two monthly measures of employment? The household survey and establishment survey both produce sample-based estimates of employ- ment and both have strengths and limitations. The establishment survey employment series has a smaller margin of error on the measurement of month-to-month change than the household survey because of its much larger sample size. An over-the-month employment change of 107,000 is statisti- cally significant in the establishment survey, while the threshold for a statistically significant change in the household survey is about 400,000. However, the household survey has a more expansive scope than the establishment survey because it includes the self-employed, unpaid family workers, agricul- tural workers, and private household workers, who are excluded by the establishment survey. The household survey also provides estimates of employment for demographic groups. Are undocumented immigrants counted in the surveys? Neither the establishment nor household survey is designed to identify the legal status of workers. Thus, while it is likely that both surveys include at least some undocumented immigrants, it is not possible to determine how many are counted in either survey. The household survey does include questions about whether respondents were born outside the United States. Data from these questions show that foreign-born workers accounted for 15.6 percent of the labor force in 2008. Why does the establishment survey have revisions? The establishment survey revises published estimates to improve its data series by incorporating additional information that was not available at the time of the initial publication of the estimates. The establishment survey revises its initial monthly estimates twice, in the immediately succeeding 2 months, to incorporate additional sample receipts from respondents in the survey and recalculated seasonal adjustment factors. For more information on the monthly revisions, please visit http://www.bls.gov/ces/cesrevinfo.htm. On an annual basis, the establishment survey incorporates a benchmark revision that re-anchors estimates to nearly complete employment counts available from unemployment insurance tax records. The benchmark helps to control for sampling and modeling errors in the estimates. For more informa- tion on the annual benchmark revision, please visit http://www.bls.gov/web/cesbmart.htm. Does the establishment survey sample include small firms? Yes; about 40 percent of the establishment survey sample is comprised of business establishments with fewer than 20 employees. The establishment survey sample is designed to maximize the reliability of the total nonfarm employment estimate; firms from all size classes and industries are appropriately sampled to achieve that goal. Does the establishment survey account for employment from new businesses? Yes; monthly establishment survey estimates include an adjustment to account for the net employ- ment change generated by business births and deaths. The adjustment comes from an econometric model that forecasts the monthly net jobs impact of business births and deaths based on the actual past
  • 7. 7 values of the net impact that can be observed with a lag from the Quarterly Census of Employment and Wages. The establishment survey uses modeling rather than sampling for this purpose because the sur- vey is not immediately able to bring new businesses into the sample. There is an unavoidable lag be- tween the birth of a new firm and its appearance on the sampling frame and availability for selection. BLS adds new businesses to the survey twice a year. Is the count of unemployed persons limited to just those people receiving unemployment insurance benefits? No; the estimate of unemployment is based on a monthly sample survey of households. All persons who are without jobs and are actively seeking and available to work are included among the unemployed. (People on temporary layoff are included even if they do not actively seek work.) There is no require- ment or question relating to unemployment insurance benefits in the monthly survey. Does the official unemployment rate exclude people who have stopped looking for work? Yes; however, there are separate estimates of persons outside the labor force who want a job, including those who have stopped looking because they believe no jobs are available (discouraged workers). In addition, alternative measures of labor underutilization (discouraged workers and other groups not officially counted as unemployed) are published each month in the Employment Situation news release.
  • 8. Technical Note This news release presents statistics from two major force. The labor force participation rate is the labor force as surveys, the Current Population Survey (household survey) a percent of the population, and the employment-population and the Current Employment Statistics survey (establishment ratio is the employed as a percent of the population. survey). The household survey provides the information on the labor force, employment, and unemployment that appears Establishment survey. The sample establishments are in the A tables, marked HOUSEHOLD DATA. It is a sample drawn from private nonfarm businesses such as factories, survey of about 60,000 households conducted by the U.S. offices, and stores, as well as federal, state, and local Census Bureau for the Bureau of Labor Statistics (BLS). government entities. Employees on nonfarm payrolls are The establishment survey provides the information on those who received pay for any part of the reference pay the employment, hours, and earnings of workers on nonfarm period, including persons on paid leave. Persons are counted payrolls that appears in the B tables, marked ESTABLISH- in each job they hold. Hours and earnings data are for MENT DATA. This information is collected from payroll private businesses and relate only to production workers in records by BLS in cooperation with state agencies. The the goods-producing sector and nonsupervisory workers in sample includes about 160,000 businesses and government the service-providing sector. Industries are classified on the agencies covering approximately 400,000 individual work- basis of their principal activity in accordance with the 2007 sites. The active sample includes about one-third of all non- version of the North American Industry Classification farm payroll workers. The sample is drawn from a sampling System. frame of unemployment insurance tax accounts. For both surveys, the data for a given month relate to a Differences in employment estimates. The numerous particular week or pay period. In the household survey, the conceptual and methodological differences between the reference week is generally the calendar week that contains household and establishment surveys result in important the 12th day of the month. In the establishment survey, the distinctions in the employment estimates derived from the reference period is the pay period including the 12th, which surveys. Among these are: may or may not correspond directly to the calendar week. • The household survey includes agricultural workers, Coverage, definitions, and differences between sur- the self-employed, unpaid family workers, and veys private household workers among the employed. These groups are excluded from the establishment Household survey. The sample is selected to reflect survey. the entire civilian noninstitutional population. Based on responses to a series of questions on work and job search • The household survey includes people on unpaid activities, each person 16 years and over in a sample leave among the employed. The establishment household is classified as employed, unemployed, or not in survey does not. the labor force. People are classified as employed if they did any work • The household survey is limited to workers 16 years at all as paid employees during the reference week; worked in of age and older. The establishment survey is not their own business, profession, or on their own farm; or limited by age. worked without pay at least 15 hours in a family business or farm. People are also counted as employed if they were • The household survey has no duplication of temporarily absent from their jobs because of illness, bad individuals, because individuals are counted only weather, vacation, labor-management disputes, or personal once, even if they hold more than one job. In the reasons. establishment survey, employees working at more People are classified as unemployed if they meet all of than one job and thus appearing on more than one the following criteria: They had no employment during the payroll would be counted separately for each reference week; they were available for work at that time; and appearance. they made specific efforts to find employment sometime during the 4-week period ending with the reference week. Seasonal adjustment Persons laid off from a job and expecting recall need not be Over the course of a year, the size of the nation's labor looking for work to be counted as unemployed. The force and the levels of employment and unemployment unemployment data derived from the household survey in no undergo sharp fluctuations due to such seasonal events as way depend upon the eligibility for or receipt of changes in weather, reduced or expanded production, unemployment insurance benefits. harvests, major holidays, and the opening and closing of The civilian labor force is the sum of employed and schools. The effect of such seasonal variation can be very unemployed persons. Those not classified as employed or large; seasonal fluctuations may account for as much as 95 unemployed are not in the labor force. The unemployment percent of the month-to-month changes in unemployment. rate is the number unemployed as a percent of the labor
  • 9. Because these seasonal events follow a more or less 430,000). These figures do not mean that the sample results regular pattern each year, their influence on statistical trends are off by these magnitudes, but rather that there is about a can be eliminated by adjusting the statistics from month to 90-percent chance that the "true" over-the-month change lies month. These adjustments make nonseasonal developments, within this interval. Since this range includes values of less such as declines in economic activity or increases in the than zero, we could not say with confidence that employment participation of women in the labor force, easier to spot. For had, in fact, increased. If, however, the reported employment example, the large number of youth entering the labor force rise was half a million, then all of the values within the 90- each June is likely to obscure any other changes that have percent confidence interval would be greater than zero. In taken place relative to May, making it difficult to determine if this case, it is likely (at least a 90-percent chance) that an the level of economic activity has risen or declined. employment rise had, in fact, occurred. At an unemployment However, because the effect of students finishing school in rate of around 5.5 percent, the 90-percent confidence interval previous years is known, the statistics for the current year can for the monthly change in unemployment is about be adjusted to allow for a comparable change. Insofar as the +/-280,000, and for the monthly change in the unemployment seasonal adjustment is made correctly, the adjusted figure rate it is about +/-.19 percentage point. provides a more useful tool with which to analyze changes in In general, estimates involving many individuals or economic activity. establishments have lower standard errors (relative to the size Most seasonally adjusted series are independently of the estimate) than estimates which are based on a small adjusted in both the household and establishment surveys. number of observations. The precision of estimates is also However, the adjusted series for many major estimates, such improved when the data are cumulated over time such as for as total payroll employment, employment in most quarterly and annual averages. The seasonal adjustment supersectors, total employment, and unemployment are process can also improve the stability of the monthly computed by aggregating independently adjusted component estimates. series. For example, total unemployment is derived by The household and establishment surveys are also summing the adjusted series for four major age-sex affected by nonsampling error. Nonsampling errors can components; this differs from the unemployment estimate occur for many reasons, including the failure to sample a that would be obtained by directly adjusting the total or by segment of the population, inability to obtain information for combining the duration, reasons, or more detailed age all respondents in the sample, inability or unwillingness of categories. respondents to provide correct information on a timely basis, For both the household and establishment surveys, a mistakes made by respondents, and errors made in the concurrent seasonal adjustment methodology is used in which collection or processing of the data. new seasonal factors are calculated each month, using all For example, in the establishment survey, estimates for relevant data, up to and including the data for the current the most recent 2 months are based on incomplete returns; for month. In the household survey, new seasonal factors are this reason, these estimates are labeled preliminary in the used to adjust only the current month's data. In the tables. It is only after two successive revisions to a monthly establishment survey, however, new seasonal factors are used estimate, when nearly all sample reports have been received, each month to adjust the three most recent monthly estimates. that the estimate is considered final. In both surveys, revisions to historical data are made once a Another major source of nonsampling error in the year. establishment survey is the inability to capture, on a timely basis, employment generated by new firms. To correct for Reliability of the estimates this systematic underestimation of employment growth, an Statistics based on the household and establishment estimation procedure with two components is used to account surveys are subject to both sampling and nonsampling error. for business births. The first component uses business deaths When a sample rather than the entire population is surveyed, to impute employment for business births. This is in- there is a chance that the sample estimates may differ from corporated into the sample-based link relative estimate the "true" population values they represent. The exact procedure by simply not reflecting sample units going out of difference, or sampling error, varies depending on the business, but imputing to them the same trend as the other particular sample selected, and this variability is measured by firms in the sample. The second component is an ARIMA the standard error of the estimate. There is about a 90- time series model designed to estimate the residual net percent chance, or level of confidence, that an estimate based birth/death employment not accounted for by the imputation. on a sample will differ by no more than 1.6 standard errors The historical time series used to create and test the ARIMA from the "true" population value because of sampling error. model was derived from the unemployment insurance BLS analyses are generally conducted at the 90-percent level universe micro-level database, and reflects the actual residual of confidence. net of births and deaths over the past 5 years. For example, the confidence interval for the monthly The sample-based estimates from the establishment change in total employment from the household survey is on survey are adjusted once a year (on a lagged basis) to the order of plus or minus 430,000. Suppose the estimate of universe counts of payroll employment obtained from total employment increases by 100,000 from one month to administrative records of the unemployment insurance the next. The 90-percent confidence interval on the monthly program. The difference between the March sample-based change would range from -330,000 to 530,000 (100,000 +/- employment estimates and the March universe counts is
  • 10. known as a benchmark revision, and serves as a rough proxy Other information for total survey error. The new benchmarks also incorporate Information in this release will be made available to changes in the classification of industries. Over the past sensory impaired individuals upon request. Voice phone: decade, absolute benchmark revisions for total nonfarm (202) 691-5200; TDD message referral phone: 1-800-877- employment have averaged 0.2 percent, with a range from 0.1 8339. percent to 0.6 percent.
  • 11. HOUSEHOLD DATA HOUSEHOLD DATA Table A-1. Employment status of the civilian population by sex and age (Numbers in thousands) Not seasonally adjusted Seasonally adjusted 1 Employment status, sex, and age June May June June Feb. Mar. Apr. May June 2008 2009 2009 2008 2009 2009 2009 2009 2009 TOTAL Civilian noninstitutional population ................................. 233,627 235,452 235,655 233,627 234,913 235,086 235,271 235,452 235,655 Civilian labor force ........................................................ 155,582 154,336 155,921 154,400 154,214 154,048 154,731 155,081 154,926 Participation rate ..................................................... 66.6 65.5 66.2 66.1 65.6 65.5 65.8 65.9 65.7 Employed .................................................................... 146,649 140,363 140,826 145,738 141,748 140,887 141,007 140,570 140,196 Employment-population ratio .................................. 62.8 59.6 59.8 62.4 60.3 59.9 59.9 59.7 59.5 Unemployed ............................................................... 8,933 13,973 15,095 8,662 12,467 13,161 13,724 14,511 14,729 Unemployment rate ................................................ 5.7 9.1 9.7 5.6 8.1 8.5 8.9 9.4 9.5 Not in labor force .......................................................... 78,045 81,116 79,734 79,227 80,699 81,038 80,541 80,371 80,729 Persons who currently want a job ............................... 5,374 6,612 6,454 4,925 5,645 5,814 5,935 5,861 5,884 Men, 16 years and over Civilian noninstitutional population ................................. 113,029 113,953 114,060 113,029 113,666 113,758 113,857 113,953 114,060 Civilian labor force ........................................................ 83,432 82,408 83,141 82,563 81,994 81,804 82,358 82,724 82,529 Participation rate ..................................................... 73.8 72.3 72.9 73.0 72.1 71.9 72.3 72.6 72.4 Employed .................................................................... 78,614 74,009 74,494 77,726 74,777 74,053 74,116 74,033 73,777 Employment-population ratio .................................. 69.6 64.9 65.3 68.8 65.8 65.1 65.1 65.0 64.7 Unemployed ............................................................... 4,818 8,399 8,647 4,837 7,217 7,751 8,242 8,691 8,751 Unemployment rate ................................................ 5.8 10.2 10.4 5.9 8.8 9.5 10.0 10.5 10.6 Not in labor force .......................................................... 29,597 31,545 30,919 30,467 31,672 31,954 31,498 31,229 31,532 Men, 20 years and over Civilian noninstitutional population ................................. 104,371 105,299 105,412 104,371 104,999 105,095 105,196 105,299 105,412 Civilian labor force ........................................................ 79,231 79,156 79,245 79,055 78,687 78,578 79,081 79,395 79,291 Participation rate ..................................................... 75.9 75.2 75.2 75.7 74.9 74.8 75.2 75.4 75.2 Employed .................................................................... 75,402 71,645 71,738 74,949 72,293 71,655 71,678 71,593 71,387 Employment-population ratio .................................. 72.2 68.0 68.1 71.8 68.9 68.2 68.1 68.0 67.7 Unemployed ............................................................... 3,829 7,511 7,507 4,106 6,394 6,923 7,403 7,802 7,904 Unemployment rate ................................................ 4.8 9.5 9.5 5.2 8.1 8.8 9.4 9.8 10.0 Not in labor force .......................................................... 25,139 26,144 26,167 25,315 26,312 26,516 26,115 25,904 26,121 Women, 16 years and over Civilian noninstitutional population ................................. 120,598 121,499 121,594 120,598 121,247 121,328 121,415 121,499 121,594 Civilian labor force ........................................................ 72,150 71,929 72,780 71,838 72,220 72,244 72,372 72,357 72,397 Participation rate ..................................................... 59.8 59.2 59.9 59.6 59.6 59.5 59.6 59.6 59.5 Employed .................................................................... 68,035 66,354 66,332 68,012 66,970 66,834 66,890 66,537 66,419 Employment-population ratio .................................. 56.4 54.6 54.6 56.4 55.2 55.1 55.1 54.8 54.6 Unemployed ............................................................... 4,115 5,574 6,448 3,825 5,250 5,410 5,482 5,820 5,978 Unemployment rate ................................................ 5.7 7.7 8.9 5.3 7.3 7.5 7.6 8.0 8.3 Not in labor force .......................................................... 48,448 49,570 48,815 48,760 49,027 49,084 49,042 49,142 49,197 Women, 20 years and over Civilian noninstitutional population ................................. 112,183 113,089 113,189 112,183 112,824 112,908 112,999 113,089 113,189 Civilian labor force ........................................................ 68,227 68,751 68,906 68,421 68,917 68,977 69,148 69,112 69,060 Participation rate ..................................................... 60.8 60.8 60.9 61.0 61.1 61.1 61.2 61.1 61.0 Employed .................................................................... 64,904 63,809 63,480 65,169 64,271 64,148 64,226 63,895 63,810 Employment-population ratio .................................. 57.9 56.4 56.1 58.1 57.0 56.8 56.8 56.5 56.4 Unemployed ............................................................... 3,323 4,942 5,426 3,252 4,646 4,828 4,922 5,217 5,249 Unemployment rate ................................................ 4.9 7.2 7.9 4.8 6.7 7.0 7.1 7.5 7.6 Not in labor force .......................................................... 43,956 44,338 44,284 43,762 43,907 43,931 43,850 43,976 44,130 Both sexes, 16 to 19 years Civilian noninstitutional population ................................. 17,073 17,064 17,053 17,073 17,090 17,083 17,076 17,064 17,053 Civilian labor force ........................................................ 8,124 6,430 7,770 6,924 6,610 6,493 6,501 6,573 6,575 Participation rate ..................................................... 47.6 37.7 45.6 40.6 38.7 38.0 38.1 38.5 38.6 Employed .................................................................... 6,343 4,910 5,608 5,620 5,184 5,083 5,103 5,082 4,999 Employment-population ratio .................................. 37.1 28.8 32.9 32.9 30.3 29.8 29.9 29.8 29.3 Unemployed ............................................................... 1,781 1,520 2,162 1,304 1,427 1,410 1,398 1,491 1,576 Unemployment rate ................................................ 21.9 23.6 27.8 18.8 21.6 21.7 21.5 22.7 24.0 Not in labor force .......................................................... 8,950 10,634 9,284 10,149 10,480 10,590 10,575 10,491 10,478 1 The population figures are not adjusted for seasonal variation; therefore, identical numbers appear in the unadjusted and seasonally adjusted columns. NOTE: Updated population controls are introduced annually with the release of January data.
  • 12. HOUSEHOLD DATA HOUSEHOLD DATA Table A-2. Employment status of the civilian population by race, sex, and age (Numbers in thousands) Not seasonally adjusted Seasonally adjusted 1 Employment status, race, sex, and age June May June June Feb. Mar. Apr. May June 2008 2009 2009 2008 2009 2009 2009 2009 2009 WHITE Civilian noninstitutional population ................................. 189,428 190,667 190,801 189,428 190,331 190,436 190,552 190,667 190,801 Civilian labor force ........................................................ 126,674 125,841 126,986 125,712 125,703 125,599 126,110 126,423 126,199 Participation rate ....................................................... 66.9 66.0 66.6 66.4 66.0 66.0 66.2 66.3 66.1 Employed .................................................................... 120,191 115,444 115,772 119,417 116,481 115,693 115,977 115,561 115,202 Employment-population ratio .................................... 63.4 60.5 60.7 63.0 61.2 60.8 60.9 60.6 60.4 Unemployed ............................................................... 6,483 10,398 11,214 6,295 9,222 9,906 10,133 10,862 10,997 Unemployment rate .................................................. 5.1 8.3 8.8 5.0 7.3 7.9 8.0 8.6 8.7 Not in labor force .......................................................... 62,753 64,826 63,815 63,716 64,628 64,837 64,441 64,244 64,601 Men, 20 years and over Civilian labor force ........................................................ 65,578 65,631 65,662 65,420 65,180 65,032 65,509 65,766 65,732 Participation rate ....................................................... 76.3 75.7 75.7 76.1 75.4 75.2 75.7 75.9 75.8 Employed .................................................................... 62,803 59,932 59,963 62,413 60,361 59,811 59,967 59,820 59,656 Employment-population ratio .................................... 73.0 69.2 69.1 72.6 69.8 69.1 69.3 69.0 68.8 Unemployed ............................................................... 2,775 5,699 5,699 3,007 4,819 5,221 5,543 5,946 6,076 Unemployment rate .................................................. 4.2 8.7 8.7 4.6 7.4 8.0 8.5 9.0 9.2 Women, 20 years and over Civilian labor force ........................................................ 54,346 54,875 54,900 54,567 54,967 55,115 55,227 55,192 55,068 Participation rate ....................................................... 60.2 60.3 60.3 60.4 60.5 60.7 60.8 60.7 60.5 Employed .................................................................... 51,969 51,303 50,990 52,255 51,624 51,519 51,695 51,385 51,304 Employment-population ratio .................................... 57.5 56.4 56.0 57.8 56.9 56.7 56.9 56.5 56.4 Unemployed ............................................................... 2,376 3,573 3,910 2,312 3,344 3,596 3,533 3,807 3,765 Unemployment rate .................................................. 4.4 6.5 7.1 4.2 6.1 6.5 6.4 6.9 6.8 Both sexes, 16 to 19 years Civilian labor force ........................................................ 6,750 5,335 6,424 5,725 5,556 5,452 5,374 5,465 5,400 Participation rate ....................................................... 51.6 40.9 49.3 43.8 42.5 41.7 41.1 41.9 41.4 Employed .................................................................... 5,419 4,209 4,819 4,749 4,497 4,363 4,316 4,356 4,243 Employment-population ratio .................................... 41.4 32.2 36.9 36.3 34.4 33.4 33.0 33.4 32.5 Unemployed ............................................................... 1,332 1,126 1,605 976 1,059 1,089 1,058 1,108 1,156 Unemployment rate .................................................. 19.7 21.1 25.0 17.0 19.1 20.0 19.7 20.3 21.4 BLACK OR AFRICAN AMERICAN Civilian noninstitutional population ................................. 27,816 28,184 28,217 27,816 28,085 28,118 28,153 28,184 28,217 Civilian labor force ........................................................ 17,926 17,649 17,911 17,708 17,703 17,542 17,816 17,737 17,700 Participation rate ....................................................... 64.4 62.6 63.5 63.7 63.0 62.4 63.3 62.9 62.7 Employed .................................................................... 16,165 15,047 15,174 16,041 15,336 15,212 15,142 15,095 15,103 Employment-population ratio .................................... 58.1 53.4 53.8 57.7 54.6 54.1 53.8 53.6 53.5 Unemployed ............................................................... 1,760 2,603 2,737 1,667 2,368 2,330 2,673 2,642 2,597 Unemployment rate .................................................. 9.8 14.7 15.3 9.4 13.4 13.3 15.0 14.9 14.7 Not in labor force .......................................................... 9,891 10,534 10,306 10,109 10,382 10,576 10,337 10,446 10,517 Men, 20 years and over Civilian labor force ........................................................ 8,051 7,939 7,956 7,994 7,949 7,917 7,990 8,000 7,929 Participation rate ....................................................... 72.0 70.0 70.0 71.5 70.4 70.0 70.5 70.5 69.8 Employed .................................................................... 7,292 6,621 6,672 7,223 6,762 6,700 6,620 6,656 6,633 Employment-population ratio .................................... 65.2 58.3 58.7 64.6 59.9 59.2 58.4 58.7 58.4 Unemployed ............................................................... 760 1,319 1,284 772 1,187 1,218 1,370 1,345 1,297 Unemployment rate .................................................. 9.4 16.6 16.1 9.7 14.9 15.4 17.2 16.8 16.4 Women, 20 years and over Civilian labor force ........................................................ 8,987 8,987 9,076 8,961 9,006 8,932 9,064 9,000 9,042 Participation rate ....................................................... 64.4 63.5 64.1 64.2 63.9 63.3 64.1 63.6 63.8 Employed .................................................................... 8,300 7,993 8,018 8,291 8,115 8,045 8,025 7,993 8,018 Employment-population ratio .................................... 59.5 56.5 56.6 59.4 57.6 57.0 56.8 56.5 56.6 Unemployed ............................................................... 687 995 1,058 671 890 887 1,038 1,007 1,024 Unemployment rate .................................................. 7.6 11.1 11.7 7.5 9.9 9.9 11.5 11.2 11.3 Both sexes, 16 to 19 years Civilian labor force ........................................................ 887 723 879 752 749 692 762 736 729 Participation rate ....................................................... 33.1 26.9 32.7 28.1 27.8 25.7 28.3 27.4 27.1 Employed .................................................................... 573 433 484 528 459 467 497 446 453 Employment-population ratio .................................... 21.4 16.1 18.0 19.7 17.0 17.4 18.5 16.6 16.9 Unemployed ............................................................... 314 290 395 224 290 225 265 290 276 Unemployment rate .................................................. 35.4 40.1 45.0 29.8 38.8 32.5 34.7 39.4 37.9 See footnotes at end of table.
  • 13. HOUSEHOLD DATA HOUSEHOLD DATA Table A-2. Employment status of the civilian population by race, sex, and age — Continued (Numbers in thousands) Not seasonally adjusted Seasonally adjusted 1 Employment status, race, sex, and age June May June June Feb. Mar. Apr. May June 2008 2009 2009 2008 2009 2009 2009 2009 2009 ASIAN Civilian noninstitutional population ................................. 10,728 10,855 10,897 (2) (2) (2) (2) (2) (2) Civilian labor force ........................................................ 7,231 7,170 7,322 (2) (2) (2) (2) (2) (2) Participation rate ....................................................... 67.4 66.1 67.2 (2) (2) (2) (2) (2) (2) Employed .................................................................... 6,903 6,690 6,719 (2) (2) (2) (2) (2) (2) Employment-population ratio .................................... 64.3 61.6 61.7 (2) (2) (2) (2) (2) (2) Unemployed ............................................................... 328 480 603 (2) (2) (2) (2) (2) (2) Unemployment rate .................................................. 4.5 6.7 8.2 (2) (2) (2) (2) (2) (2) Not in labor force .......................................................... 3,498 3,685 3,575 (2) (2) (2) (2) (2) (2) 1 The population figures are not adjusted for seasonal variation; therefore, NOTE: Estimates for the above race groups will not sum to totals shown in identical numbers appear in the unadjusted and seasonally adjusted columns. table A-1 because data are not presented for all races. Updated population 2 Data not available. controls are introduced annually with the release of January data. Table A-3. Employment status of the Hispanic or Latino population by sex and age (Numbers in thousands) Not seasonally adjusted Seasonally adjusted 1 Employment status, sex, and age June May June June Feb. Mar. Apr. May June 2008 2009 2009 2008 2009 2009 2009 2009 2009 HISPANIC OR LATINO ETHNICITY Civilian noninstitutional population ................................. 32,087 32,753 32,839 32,087 32,501 32,585 32,671 32,753 32,839 Civilian labor force ........................................................ 22,184 22,299 22,403 22,100 22,100 22,175 22,376 22,438 22,347 Participation rate ....................................................... 69.1 68.1 68.2 68.9 68.0 68.1 68.5 68.5 68.1 Employed .................................................................... 20,499 19,673 19,685 20,391 19,684 19,640 19,854 19,595 19,623 Employment-population ratio .................................... 63.9 60.1 59.9 63.5 60.6 60.3 60.8 59.8 59.8 Unemployed ............................................................... 1,684 2,626 2,718 1,709 2,416 2,536 2,521 2,843 2,724 Unemployment rate .................................................. 7.6 11.8 12.1 7.7 10.9 11.4 11.3 12.7 12.2 Not in labor force .......................................................... 9,904 10,455 10,436 9,987 10,401 10,410 10,295 10,315 10,491 Men, 20 years and over Civilian labor force ........................................................ 12,632 12,739 12,642 (2) (2) (2) (2) (2) (2) Participation rate ....................................................... 84.5 83.6 82.7 (2) (2) (2) (2) (2) (2) Employed .................................................................... 11,849 11,330 11,290 (2) (2) (2) (2) (2) (2) Employment-population ratio .................................... 79.3 74.4 73.9 (2) (2) (2) (2) (2) (2) Unemployed ............................................................... 783 1,409 1,352 (2) (2) (2) (2) (2) (2) Unemployment rate .................................................. 6.2 11.1 10.7 (2) (2) (2) (2) (2) (2) Women, 20 years and over Civilian labor force ........................................................ 8,286 8,510 8,527 (2) (2) (2) (2) (2) (2) Participation rate ....................................................... 58.7 59.1 59.1 (2) (2) (2) (2) (2) (2) Employed .................................................................... 7,680 7,619 7,542 (2) (2) (2) (2) (2) (2) Employment-population ratio .................................... 54.5 52.9 52.2 (2) (2) (2) (2) (2) (2) Unemployed ............................................................... 606 891 985 (2) (2) (2) (2) (2) (2) Unemployment rate .................................................. 7.3 10.5 11.5 (2) (2) (2) (2) (2) (2) Both sexes, 16 to 19 years Civilian labor force ........................................................ 1,266 1,050 1,234 (2) (2) (2) (2) (2) (2) Participation rate ....................................................... 41.7 33.7 39.6 (2) (2) (2) (2) (2) (2) Employed .................................................................... 970 724 854 (2) (2) (2) (2) (2) (2) Employment-population ratio .................................... 32.0 23.3 27.4 (2) (2) (2) (2) (2) (2) Unemployed ............................................................... 296 326 381 (2) (2) (2) (2) (2) (2) Unemployment rate .................................................. 23.4 31.0 30.8 (2) (2) (2) (2) (2) (2) 1 The population figures are not adjusted for seasonal variation; therefore, NOTE: Persons whose ethnicity is identified as Hispanic or Latino may be of identical numbers appear in the unadjusted and seasonally adjusted columns. any race. Updated population controls are introduced annually with the release of 2 Data not available. January data.
  • 14. HOUSEHOLD DATA HOUSEHOLD DATA Table A-4. Employment status of the civilian population 25 years and over by educational attainment (Numbers in thousands) Not seasonally adjusted Seasonally adjusted Educational attainment June May June June Feb. Mar. Apr. May June 2008 2009 2009 2008 2009 2009 2009 2009 2009 Less than a high school diploma Civilian labor force .......................................................... 12,422 12,402 12,545 12,193 11,955 11,997 12,027 12,210 12,363 Participation rate ......................................................... 46.8 46.6 47.0 45.9 46.4 45.7 45.7 45.9 46.3 Employed ...................................................................... 11,424 10,667 10,744 11,112 10,445 10,399 10,251 10,321 10,447 Employment-population ratio ...................................... 43.0 40.1 40.3 41.8 40.5 39.6 38.9 38.8 39.2 Unemployed ................................................................. 998 1,736 1,802 1,081 1,510 1,598 1,776 1,889 1,916 Unemployment rate .................................................... 8.0 14.0 14.4 8.9 12.6 13.3 14.8 15.5 15.5 High school graduates, no college 1 Civilian labor force .......................................................... 37,875 38,436 38,208 38,162 38,463 38,434 38,687 38,757 38,694 Participation rate ......................................................... 62.3 62.6 62.4 62.8 62.2 62.3 63.0 63.1 63.2 Employed ...................................................................... 36,031 34,827 34,695 36,171 35,270 34,981 35,086 34,881 34,898 Employment-population ratio ...................................... 59.3 56.7 56.7 59.5 57.1 56.7 57.1 56.8 57.0 Unemployed ................................................................. 1,844 3,609 3,514 1,991 3,193 3,454 3,601 3,875 3,796 Unemployment rate .................................................... 4.9 9.4 9.2 5.2 8.3 9.0 9.3 10.0 9.8 Some college or associate degree Civilian labor force .......................................................... 36,692 36,621 36,546 36,761 37,362 36,921 36,959 36,860 36,646 Participation rate ......................................................... 71.7 71.2 70.8 71.8 72.1 71.8 71.7 71.7 71.0 Employed ...................................................................... 35,117 33,914 33,614 35,157 34,738 34,267 34,207 34,013 33,713 Employment-population ratio ...................................... 68.6 66.0 65.1 68.7 67.1 66.6 66.4 66.2 65.3 Unemployed ................................................................. 1,575 2,707 2,932 1,605 2,624 2,653 2,752 2,847 2,933 Unemployment rate .................................................... 4.3 7.4 8.0 4.4 7.0 7.2 7.4 7.7 8.0 Bachelor’s degree and higher 2 Civilian labor force .......................................................... 44,677 45,438 45,242 44,958 45,027 45,401 45,442 45,500 45,527 Participation rate ......................................................... 77.5 77.7 77.3 78.0 77.6 78.1 77.7 77.8 77.7 Employed ...................................................................... 43,611 43,368 43,048 43,897 43,177 43,431 43,466 43,332 43,368 Employment-population ratio ...................................... 75.7 74.1 73.5 76.2 74.4 74.7 74.4 74.1 74.1 Unemployed ................................................................. 1,066 2,070 2,194 1,061 1,850 1,970 1,977 2,167 2,158 Unemployment rate .................................................... 2.4 4.6 4.8 2.4 4.1 4.3 4.4 4.8 4.7 1 Includes persons with a high school diploma or equivalent. 2 Includes persons with bachelor’s, master’s, professional, and doctoral degrees. NOTE: Updated population controls are introduced annually with the release of January data.
  • 15. HOUSEHOLD DATA HOUSEHOLD DATA Table A-5. Employed persons by class of worker and part-time status (In thousands) Not seasonally adjusted Seasonally adjusted Category June May June June Feb. Mar. Apr. May June 2008 2009 2009 2008 2009 2009 2009 2009 2009 CLASS OF WORKER Agriculture and related industries ................................... 2,331 2,205 2,351 2,134 2,148 2,050 2,134 2,173 2,165 Wage and salary workers ............................................. 1,401 1,278 1,366 1,250 1,244 1,167 1,209 1,256 1,232 Self-employed workers ................................................. 876 901 941 840 875 875 887 882 896 Unpaid family workers .................................................. 53 26 43 (1) (1) (1) (1) (1) (1) Nonagricultural industries ............................................... 144,319 138,158 138,475 143,563 139,579 138,842 138,828 138,296 137,812 Wage and salary workers ............................................. 134,573 128,997 129,255 134,094 130,465 129,478 129,724 129,298 128,939 Government ................................................................ 20,955 21,607 21,260 21,190 21,192 20,904 21,211 21,247 21,446 Private industries ........................................................ 113,618 107,389 107,995 112,895 109,311 108,674 108,555 108,054 107,498 Private households ................................................... 862 779 908 (1) (1) (1) (1) (1) (1) Other industries ........................................................ 112,756 106,610 107,087 112,080 108,574 107,898 107,813 107,238 106,631 Self-employed workers ................................................. 9,625 9,099 9,138 9,396 8,962 9,184 9,052 8,990 8,891 Unpaid family workers .................................................. 120 63 83 (1) (1) (1) (1) (1) (1) PERSONS AT WORK PART TIME 2 All industries: Part time for economic reasons .................................. 5,697 8,785 9,301 5,495 8,626 9,049 8,910 9,084 8,989 Slack work or business conditions ........................... 3,806 6,647 6,616 3,905 6,443 6,857 6,699 6,794 6,783 Could only find part-time work ................................. 1,532 1,898 2,263 1,359 1,764 1,839 1,810 1,922 1,980 Part time for noneconomic reasons ............................ 18,424 19,111 17,712 19,428 18,855 18,833 19,065 18,872 18,718 Nonagricultural industries: Part time for economic reasons .................................. 5,608 8,663 9,190 5,390 8,543 8,942 8,826 8,928 8,845 Slack work or business conditions ........................... 3,749 6,552 6,537 3,839 6,390 6,773 6,650 6,681 6,699 Could only find part-time work ................................. 1,513 1,886 2,245 1,340 1,760 1,850 1,802 1,909 1,969 Part time for noneconomic reasons ............................ 18,038 18,783 17,327 19,036 18,562 18,493 18,661 18,502 18,358 1 Data not available. reasons such as holidays, illness, and bad weather. 2 Persons at work excludes employed persons who were absent from their NOTE: Detail for the seasonally adjusted data shown in this table will not jobs during the entire reference week for reasons such as vacation, illness, or necessarily add to totals because of the independent seasonal adjustment of the industrial dispute. Part time for noneconomic reasons excludes persons who various series. Updated population controls are introduced annually with the usually work full time but worked only 1 to 34 hours during the reference week for release of January data.
  • 16. HOUSEHOLD DATA HOUSEHOLD DATA Table A-6. Selected employment indicators (In thousands) Not seasonally adjusted Seasonally adjusted Characteristic June May June June Feb. Mar. Apr. May June 2008 2009 2009 2008 2009 2009 2009 2009 2009 AGE AND SEX Total, 16 years and over ................................................. 146,649 140,363 140,826 145,738 141,748 140,887 141,007 140,570 140,196 16 to 19 years ............................................................... 6,343 4,910 5,608 5,620 5,184 5,083 5,103 5,082 4,999 16 to 17 years ............................................................. 2,212 1,704 1,940 1,968 1,854 1,755 1,737 1,795 1,732 18 to 19 years ............................................................. 4,130 3,206 3,667 3,653 3,348 3,300 3,353 3,260 3,251 20 years and over ......................................................... 140,307 135,453 135,218 140,118 136,564 135,804 135,904 135,488 135,197 20 to 24 years ............................................................. 14,123 12,678 13,118 13,701 13,157 13,090 13,090 12,842 12,774 25 years and over ....................................................... 126,183 122,775 122,100 126,490 123,302 122,662 122,838 122,650 122,539 25 to 54 years ........................................................... 99,597 95,461 95,156 99,741 96,255 95,720 95,805 95,394 95,391 25 to 34 years ......................................................... 31,540 29,936 30,054 31,465 30,369 30,211 30,140 29,955 30,018 35 to 44 years ......................................................... 33,553 31,764 31,634 33,653 31,999 31,746 31,770 31,681 31,734 45 to 54 years ......................................................... 34,504 33,761 33,468 34,623 33,888 33,763 33,896 33,758 33,639 55 years and over ..................................................... 26,586 27,314 26,944 26,749 27,047 26,942 27,032 27,256 27,147 Men, 16 years and over .................................................. 78,614 74,009 74,494 77,726 74,777 74,053 74,116 74,033 73,777 16 to 19 years ............................................................... 3,212 2,364 2,755 2,777 2,484 2,398 2,438 2,440 2,390 16 to 17 years ............................................................. 1,106 821 976 933 837 803 817 851 821 18 to 19 years ............................................................. 2,106 1,543 1,779 1,862 1,640 1,579 1,635 1,580 1,576 20 years and over ......................................................... 75,402 71,645 71,738 74,949 72,293 71,655 71,678 71,593 71,387 20 to 24 years ............................................................. 7,450 6,531 6,808 7,184 6,784 6,656 6,701 6,574 6,582 25 years and over ....................................................... 67,952 65,113 64,930 67,784 65,479 65,031 64,960 65,001 64,855 25 to 54 years ........................................................... 53,714 50,743 50,727 53,559 51,125 50,865 50,802 50,672 50,640 25 to 34 years ......................................................... 17,367 16,090 16,257 17,279 16,449 16,288 16,199 16,082 16,194 35 to 44 years ......................................................... 18,154 17,034 16,925 18,128 17,144 17,027 17,027 17,002 16,926 45 to 54 years ......................................................... 18,193 17,618 17,545 18,152 17,532 17,550 17,576 17,588 17,520 55 years and over ..................................................... 14,238 14,371 14,202 14,225 14,354 14,166 14,157 14,329 14,214 Women, 16 years and over ............................................ 68,035 66,354 66,332 68,012 66,970 66,834 66,890 66,537 66,419 16 to 19 years ............................................................... 3,131 2,546 2,852 2,843 2,699 2,685 2,664 2,642 2,609 16 to 17 years ............................................................. 1,106 883 964 1,035 1,017 952 920 944 911 18 to 19 years ............................................................. 2,025 1,663 1,888 1,790 1,708 1,721 1,718 1,681 1,675 20 years and over ......................................................... 64,904 63,809 63,480 65,169 64,271 64,148 64,226 63,895 63,810 20 to 24 years ............................................................. 6,673 6,146 6,310 6,517 6,372 6,434 6,389 6,268 6,193 25 years and over ....................................................... 58,231 57,662 57,170 58,705 57,823 57,631 57,878 57,649 57,684 25 to 54 years ........................................................... 45,883 44,719 44,429 46,181 45,131 44,855 45,003 44,722 44,751 25 to 34 years ......................................................... 14,173 13,846 13,796 14,186 13,920 13,922 13,941 13,873 13,825 35 to 44 years ......................................................... 15,400 14,730 14,709 15,525 14,855 14,719 14,742 14,679 14,808 45 to 54 years ......................................................... 16,311 16,143 15,923 16,471 16,356 16,214 16,320 16,170 16,118 55 years and over ..................................................... 12,348 12,943 12,742 12,524 12,693 12,776 12,875 12,927 12,933 MARITAL STATUS Married men, spouse present ......................................... 45,897 44,337 44,263 45,902 44,502 44,470 44,469 44,255 44,294 Married women, spouse present .................................... 35,940 35,589 35,274 36,189 35,563 35,481 35,444 35,391 35,464 Women who maintain families ........................................ 9,007 8,928 8,853 (1) (1) (1) (1) (1) (1) FULL- OR PART-TIME STATUS Full-time workers 2 ......................................................... 121,845 113,083 114,014 120,486 114,853 113,665 113,725 113,318 112,942 Part-time workers 3 ......................................................... 24,804 27,280 26,811 25,394 26,590 26,963 27,066 27,195 27,374 MULTIPLE JOBHOLDERS Total multiple jobholders ................................................. 7,694 7,265 7,067 7,780 7,626 7,656 7,748 7,292 7,160 Percent of total employed ........................................... 5.2 5.2 5.0 5.3 5.4 5.4 5.5 5.2 5.1 1 Data not available. NOTE: Detail for the seasonally adjusted data shown in this table will not 2 Employed full-time workers are persons who usually work 35 hours or more necessarily add to totals because of the independent seasonal adjustment of the per week. various series. Updated population controls are introduced annually with the 3 Employed part-time workers are persons who usually work less than 35 release of January data. hours per week.
  • 17. HOUSEHOLD DATA HOUSEHOLD DATA Table A-7. Selected unemployment indicators, seasonally adjusted Number of unemployed persons Unemployment rates 1 Characteristic (in thousands) June May June June Feb. Mar. Apr. May June 2008 2009 2009 2008 2009 2009 2009 2009 2009 AGE AND SEX Total, 16 years and over ................................................. 8,662 14,511 14,729 5.6 8.1 8.5 8.9 9.4 9.5 16 to 19 years ............................................................... 1,304 1,491 1,576 18.8 21.6 21.7 21.5 22.7 24.0 16 to 17 years ............................................................. 595 548 580 23.2 22.9 23.7 23.0 23.4 25.1 18 to 19 years ............................................................. 689 966 1,009 15.9 21.0 20.9 21.3 22.9 23.7 20 years and over ......................................................... 7,358 13,019 13,153 5.0 7.5 8.0 8.3 8.8 8.9 20 to 24 years ............................................................. 1,549 2,265 2,283 10.2 12.9 14.0 14.7 15.0 15.2 25 years and over ....................................................... 5,760 10,740 10,877 4.4 6.9 7.2 7.5 8.1 8.2 25 to 54 years ........................................................... 4,810 8,777 8,812 4.6 7.2 7.6 7.8 8.4 8.5 25 to 34 years ......................................................... 1,841 3,514 3,359 5.5 8.7 9.0 9.7 10.5 10.1 35 to 44 years ......................................................... 1,574 2,789 2,796 4.5 6.8 7.2 7.5 8.1 8.1 45 to 54 years ......................................................... 1,395 2,474 2,657 3.9 6.2 6.6 6.4 6.8 7.3 55 years and over ..................................................... 949 1,961 2,048 3.4 5.6 6.2 6.4 6.7 7.0 Men, 16 years and over .................................................. 4,837 8,691 8,751 5.9 8.8 9.5 10.0 10.5 10.6 16 to 19 years ............................................................... 730 889 847 20.8 24.9 25.7 25.6 26.7 26.2 16 to 17 years ............................................................. 330 301 285 26.1 26.5 28.2 26.3 26.1 25.8 18 to 19 years ............................................................. 394 609 579 17.5 24.7 24.6 25.3 27.8 26.9 20 years and over ......................................................... 4,106 7,802 7,904 5.2 8.1 8.8 9.4 9.8 10.0 20 to 24 years ............................................................. 909 1,395 1,370 11.2 14.6 16.7 17.5 17.5 17.2 25 years and over ....................................................... 3,158 6,395 6,532 4.5 7.5 7.9 8.3 9.0 9.2 25 to 54 years ........................................................... 2,643 5,320 5,346 4.7 7.9 8.3 8.8 9.5 9.5 25 to 34 years ......................................................... 1,017 2,162 2,075 5.6 9.5 10.1 11.1 11.9 11.4 35 to 44 years ......................................................... 880 1,691 1,649 4.6 7.2 7.7 8.2 9.0 8.9 45 to 54 years ......................................................... 746 1,468 1,622 4.0 7.0 7.1 7.1 7.7 8.5 55 years and over ..................................................... 515 1,074 1,186 3.5 6.0 6.3 6.7 7.0 7.7 Women, 16 years and over ............................................ 3,825 5,820 5,978 5.3 7.3 7.5 7.6 8.0 8.3 16 to 19 years ............................................................... 574 602 729 16.8 18.3 17.8 17.4 18.6 21.8 16 to 17 years ............................................................. 265 247 295 20.4 19.8 19.4 19.9 20.7 24.4 18 to 19 years ............................................................. 295 358 430 14.1 17.0 17.2 17.1 17.5 20.4 20 years and over ......................................................... 3,252 5,217 5,249 4.8 6.7 7.0 7.1 7.5 7.6 20 to 24 years ............................................................. 640 870 913 8.9 10.9 11.0 11.5 12.2 12.8 25 years and over ....................................................... 2,602 4,345 4,345 4.2 6.2 6.5 6.6 7.0 7.0 25 to 54 years ........................................................... 2,167 3,457 3,467 4.5 6.4 6.7 6.7 7.2 7.2 25 to 34 years ......................................................... 824 1,352 1,284 5.5 7.7 7.6 7.9 8.9 8.5 35 to 44 years ......................................................... 694 1,098 1,147 4.3 6.4 6.5 6.7 7.0 7.2 45 to 54 years ......................................................... 648 1,007 1,036 3.8 5.3 6.1 5.7 5.9 6.0 55 years and over 2 .................................................. 439 791 874 3.4 5.3 5.8 5.4 5.8 6.4 MARITAL STATUS Married men, spouse present ......................................... 1,480 3,219 3,289 3.1 5.5 5.8 6.3 6.8 6.9 Married women, spouse present .................................... 1,278 2,136 2,120 3.4 5.1 5.4 5.5 5.7 5.6 Women who maintain families 2 ..................................... 768 1,102 1,173 7.9 10.3 10.8 10.0 11.0 11.7 FULL- OR PART-TIME STATUS Full-time workers 3 ......................................................... 7,137 12,802 12,924 5.6 8.6 9.2 9.6 10.2 10.3 Part-time workers 4 ......................................................... 1,463 1,737 1,724 5.4 5.8 5.9 6.1 6.0 5.9 1 Unemployment as a percent of the civilian labor force. work part time (less than 35 hours per week) or are on layoff from part-time jobs. 2 Not seasonally adjusted. NOTE: Detail for the seasonally adjusted data shown in this table will not 3 Full-time workers are unemployed persons who have expressed a desire to necessarily add to totals because of the independent seasonal adjustment of the work full time (35 hours or more per week) or are on layoff from full-time jobs. various series. Updated population controls are introduced annually with the 4 Part-time workers are unemployed persons who have expressed a desire to release of January data.
  • 18. HOUSEHOLD DATA HOUSEHOLD DATA Table A-8. Unemployed persons by reason for unemployment (Numbers in thousands) Not seasonally adjusted Seasonally adjusted Reason June May June June Feb. Mar. Apr. May June 2008 2009 2009 2008 2009 2009 2009 2009 2009 NUMBER OF UNEMPLOYED Job losers and persons who completed temporary jobs 4,201 8,930 9,194 4,465 7,696 8,243 8,814 9,546 9,649 On temporary layoff .................................................... 949 1,459 1,503 1,106 1,488 1,557 1,625 1,832 1,762 Not on temporary layoff .............................................. 3,252 7,471 7,691 3,358 6,208 6,686 7,189 7,714 7,886 Permanent job losers .............................................. 2,341 6,140 6,294 (1) (1) (1) (1) (1) (1) Persons who completed temporary jobs ................ 912 1,331 1,397 (1) (1) (1) (1) (1) (1) Job leavers ..................................................................... 818 851 778 847 820 887 890 910 822 Reentrants ...................................................................... 2,778 3,236 3,697 2,562 2,834 2,974 3,087 3,180 3,335 New entrants .................................................................. 1,136 956 1,425 761 1,005 868 900 956 947 PERCENT DISTRIBUTION Total unemployed ........................................................... 100.0 100.0 100.0 100.0 100.0 100.0 100.0 100.0 100.0 Job losers and persons who completed temporary jobs ............................................................................. 47.0 63.9 60.9 51.7 62.3 63.5 64.4 65.4 65.4 On temporary layoff .................................................. 10.6 10.4 10.0 12.8 12.0 12.0 11.9 12.6 11.9 Not on temporary layoff ............................................ 36.4 53.5 51.0 38.9 50.2 51.5 52.5 52.9 53.5 Job leavers ................................................................... 9.2 6.1 5.2 9.8 6.6 6.8 6.5 6.2 5.6 Reentrants .................................................................... 31.1 23.2 24.5 29.7 22.9 22.9 22.5 21.8 22.6 New entrants ................................................................ 12.7 6.8 9.4 8.8 8.1 6.7 6.6 6.6 6.4 UNEMPLOYED AS A PERCENT OF THE CIVILIAN LABOR FORCE Job losers and persons who completed temporary jobs ............................................................................. 2.7 5.8 5.9 2.9 5.0 5.4 5.7 6.2 6.2 Job leavers ................................................................... .5 .6 .5 .5 .5 .6 .6 .6 .5 Reentrants .................................................................... 1.8 2.1 2.4 1.7 1.8 1.9 2.0 2.1 2.2 New entrants ................................................................ .7 .6 .9 .5 .7 .6 .6 .6 .6 1 Data not available. NOTE: Updated population controls are introduced annually with the release of January data.