The Hidden Farm Bill
•Transferir como PPT, PDF•
2 gostaram•2,309 visualizações

The document discusses how the farm bill consists of both visible and hidden components. Visibly, it appears as government spending categories like subsidies. However, hidden components lower price floors for commodities, which lowers market prices and results in billions lost by farmers. When only spending is considered, it misses the real story - hidden reductions have a much bigger negative impact on farmers than visible subsidies have a positive one. Making these hidden impacts visible shows that the farm bill overall benefits agribusiness at the expense of farmers.

Recomendados
Mais conteúdo relacionado
Mais procurados
Mais procurados (20)
Mais de Brad Wilson
Mais de Brad Wilson (9)
Último
Último (20)
The Hidden Farm Bill
- 1. The Hidden Farm Bill How Agribusiness Hides Behind the Myth of Subsidies
- 2. The Visible Farm Bill as a Pie Chart It is often suggested that a farm bill consists only of spending categories.
- 3. Farm Bill Spending, 2007 We often see Farm Bill spending on a bar chart.
- 4. Rice in the Farm Bill, 1942-2011 HIDDEN: Minimum Price Floors were lowered (RED); which lowered market prices (BLUE). VISIBLE: Subsidies were added in 1977 (YELLOW).
- 5. The Hidden Farm Bill: Unknown today? There is another pie, a bigger part of the farm bill, and it is not government spending.
- 6. subsidies are visible (Yellow) When you only look at Farm Bill spending, (between the BLUE and the YELLOW,) you miss the real story (RED), the real results (between BLACK and RED).
- 7. FARM SUBSIDIEs (BLUE) VISIBLE: Farmers are seen as Farm Bill winners.
- 8. Farm subsidies 2007 VISIBLE: The previous BLUE slice & bar can be subdivided.
- 9. farm bill Commodity Title 2007 Here we see a pie chart of just the farm subsidies for 2007. (It’s from a previous BLUE section, (2 slides back,) now itemized).
- 10. 2007 Only: Farm Subsidies Farm Subsidies look big when shown on a chart like this!
- 11. congress lowered price FLOORs ( red)(red) After 1952, agribusiness gained from buying cheap, at the BLUE line instead of the BLACK line. Farmers lost billions.
- 12. Value reductions Rice reductions for 2007 are seen in (GRAY). Compare the previous chart, for rice.
- 13. The Hidden Farm Bill, 2007 We can also put the hidden Farm Bill reductions on a bar chart. Rice is in gray.
- 14. Rice reductions For 2007, there is a large gap between the standard of fair rice prices, (BLACK line), and the actual rice prices (BLUE line). Subsidies compensate for only a fraction.
- 15. Farm bill reductions Rice (GRAY) and other reductions: taken from farmers and given to agribusiness.
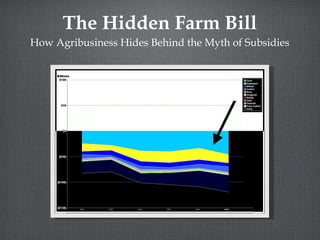
- 16. Subsidies look big on this scale! To combine VISIBLE subsidies with HIDDEN reductions, we must change the scale.
- 17. Subsidies look small on this scale We changed the scale from $0 - $4 billion, (BEFORE) to $0-$40 billion, (NOW).
- 18. The Visible and hidden farm bill Now we see the context for subsidies. Farmers have had huge reductions, from the lowering of Price Floors. Subsidies compensate for only a small part of it.
- 19. Net farm bill impacts Add subsidies (DARK BLUE) to reductions (LIGHT BLUE) to get net results (PURPLE). Reductions (from farmers) go to agribusiness buyers. How much is passed on to consumers?
- 20. Reductions are bigger than all spending By this standard of fairness, farmer reductions were bigger than ALL farm bill spending. Net Result: The HIDDEN Farm Bill is bigger than ALL of the VISIBLE farm bill.
- 21. Farm Bill summary By this standard, Net Reductions against farmers were bigger than the Nutrition Title in 2007. But what is hidden below the Nutrition Title? Low Minimum Wage and lack of full employment policies, located outside of the Farm Bill.
- 22. Fix the farm bill myths My Farm Justice Primer contains the best online introductory material to fix the biggest Farm Bill myths. These are from the best academics and groups. My blogs fill the some of the remaining gaps.
- 23. 3 Farm Justice Proposals There are three key proposals to support to correctly fix these big Farm Bill issues. We must make these HIDDEN proposals VISIBLE, and stop supporting agribusiness.