Equipment Reliability Example
•Transferir como PPTX, PDF•
1 gostou•86 visualizações

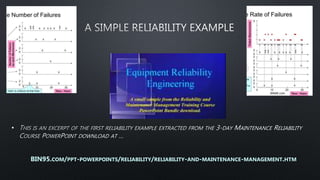
This simple equipment reliability example is used to convey the basics of reliability engineering. Learn the 4 system reliability factors that must all be addressed. Download the full 235 slide Reliability and Maintenance Management Course PowerPoint today at https://bin95.com/articles/maintenance-management/equipment-reliability-examples.htm

Recomendados
Recomendados
Mais conteúdo relacionado
Semelhante a Equipment Reliability Example
Semelhante a Equipment Reliability Example (13)
Mais de Business Industrial Network
Mais de Business Industrial Network (20)
Último
Último (20)
Equipment Reliability Example
- 2. BIN95.com If maintenance is one quarter of the solution to high reliability, what are the others? The discussion on managing reliability continues… The first is good design control, the second is accurate manufacture/assembly, and third is good operating practices. But I cannot influence those factors, I can only affect the maintenance practices. Then you will never get high reliability in your operation. All four factors must all be addressed together. The parts in your machines do not care about your organizational structure and how responsibilities are allocated to people. The parts can only respond to how they are designed, how they are fabricated and installed, how they are treated and maintained. I hear what you are saying Professor. I will need to bring this perspective back to my company. Perhaps it is best that tomorrow I explain the basics of ‘reliability’ and give you simple examples of how it is measured. You will then see the importance of the four critical factors – design control, manufacture, operation, maintenance – to equipment lifetime reliability. Thank you Professor, I’ll see you at 11am tomorrow.
- 3. BIN95.com What is Reliability? Reliability is the probability an item will function correctly when needed, for the period required, in the specified environment. The reliability of a part, or of a whole machine, or system in service depends on: 1. Robustness of the Design to Lack of Manufacturing Precision 2. Precision and Accuracy in Manufacture and Assembly 3. Roughness of Loading in Operation 4. The Quality, Relevance and Timing of Maintenance Probability is the same as ‘chance’ In other words for a set amount of time How reliable is this glass? This means what is the chance that this glass will hold water the next time you want to use it? If this glass is broken, then it will not be available to you to use – it will have failed. That is, it properly performs the job it is meant to do
- 4. BIN95.com What is the Reliability of this Glass? In other words: ‘What’s the chance it will hold water next time you use it?’ Stay with me, because understanding how to measure reliability is one of the most important concepts that you need to know of to do maintenance well. What can cause this glass to break? • It can be dropped, for example - • slip from your hand • fall off a table • slip out of a bag or carry box • It can be knocked, • hit by another glass • clanked when stacked on each other • hit by an object, like a plate or bottle • It can be crushed, • jammed hard between two objects • stepped-on • squashed under a too heavy object • It can be temperature shocked, • in the dish washer • during washing-up • Mistreated, • It can be thrown in anger • It can be smashed intentionally • Latent damage • scratched and weakened to later fail more easily • chipped and weakened to later fail more easily These many ways for the glass to break (the failure mode), are called ‘failure mechanisms’.
- 5. BIN95.com How do you Measure Reliability of a Glass? Since reliability is the ‘chance’ that the glass will still be usable, we can measure reliability ‘in reverse’ by working out the chance it will fail. Because we know the ways the glass can fail (its failure mechanisms), we can estimate it’s chance of failing (i.e. being broken – which is its failure mode) in a period of time. What is left over is the chance of not failing – its Reliability. Time or Service Chance of Failing Failure Reliability t1
- 6. BIN95.com Each ‘x’ mark is a failure at that time. What can cause this glass to break? • It can be dropped, for example - • slip from your hand • fall off a table • slip out of a bag or carry box • It can be knocked, • hit by another glass, • clanked when stacked • hit by an object, like a plate or bottle • It can be crushed, • jammed between two objects • stepped-on • It can be temperature shocked, • in the dish washer • during washing-up • Mistreated, • It can be thrown in anger • It can be smashed intentionally • Latent damage • scratched and weakened • chipped and weakened Measuring the Number of Failures 2 0 Time - Years 0 30 Number of Failures by each Mechanism 2 0 2 0 2 0 2 0 2 0 20 10 x x x x x x x x x x x x x x x x x x x x x x x x
- 7. BIN95.com What can we say about the lives of glasses in this household? • With 24 glasses broken in 30 years, the average failure rate, or failure frequency, per year is 24/30 = 0.8 glasses a year • The Mean Time To Failure (MTTF) for a glass is 1/0.8 per yr = 1.25 years i.e. glasses last on average 1-1/4 years before one is broken Measuring the Rate of Failures 2 0 Time - Years 0 30 Failed Glasses/year 2 0 2 0 2 0 2 0 2 0 20 10 x x x x x x x x x x x x x x x x x x x x x x x x 5 Use Mean Time To Failure (MTTF) to describe failure of a single part, and Mean Time Between Failure (MTBF) to describe failure of a machine, which is a collection of parts. BIN95.com
- 8. BIN95.com We need to convert rate of failure to chance of failure. • If 25 glasses were always in use in the household (glass replaced after each loss) • Chance of Failure per year = Breakages per Year Total Number of Glasses = 0.8 25 = 0.032 (or 3.2%) Converting to ‘Chance of Failure’ Time - Years 0 30 Number Remaining 0 20 10 25 24 23 21 19 18 16 15 14 13 12 11 9 8 7 5 3 2 1 We have ‘averaged’ the failure rate at 3.2 glasses for every 100, i.e. a glass broken every 1.25 years. In doing so we have lost the real truth of the situation. Look at years 3-4, and 25-26- 27-28 there were no breakages, but we have ‘assumed’ a regular rate of failure of a glass every 1.25 years. We must be careful measuring ‘chance; it is never certain. The best we can do is depict what is likely to happen, but there will always be a degree of uncertainty that it will.
- 9. BIN95.com Drawing the Failure Curve for a Glass Time - Years 0 30 Chance of Failure 20 10 100% Averaged ‘Failure’ Plot for Glasses in that Household Time - Years 0 30 Chance of Being Useful 0 20 10 100% Averaged ‘Chance of Being Useful’ Plot for Glasses in that Household Usefulness = 1 – Chance of Failure = 1 – 0.032 = 0.968 (say 97%) 3.2% Actual Breakages This failure rate of the glass reflects: • Robustness of the Design • Quality (Precision and Accuracy) in Manufacture • Roughness and Care during Use • The Quality of Maintenance Care 96.8% Once we know a glass’ chance of failure, we also know the chance it will be there when we go to use it.
- 10. BIN95.com No Maintenance for Random Failures Time - Years 0 30 Chance of Failure 20 10 100% 3% For parts where the first sign of failure is the breakage that destroys it, there is no point replacing the part until it breaks because there is nothing wrong with it until it is failed (by us). We have to carry spare parts for such parts because there is no degradation curve to monitor. Like a drinking glass, many electronic parts exhibit ‘random failure’ and suddenly fail without warning. But we now know that the failure was is not the parts’ fault – we humans did it by overloading it! Breakage of drinking glasses is a ‘random failure event’ Electronic parts failure is mostly a ‘random failure event’ We don’t actually know when the glass will fail! The past history of broken glasses lets us calculate an ‘average’ rate of failure Time - Years 0 30 Number Failed 0 20 10 25 24 23 21 19 18 16 15 14 13 12 11 9 8 7 5 3 2 1 BIN95.com
- 11. BIN95.com Random Failures are Preventable We saw that failures occur because of situational overload or material degradation leading to fatigue. Overload is caused by poor operating practices where people mistakenly impose too much stress on a part, or the part’s designer selected the wrong material, or misunderstood the part’s service duty. Material degradation is a local environment cause, and that can be controlled. X X Both causes of ‘random failure’ are controllable by us. We can prevent overloading and we can manage the local environment that a part ‘sees’. Probability Overload Condition Fatigue Condition
- 12. From the failure history you were able to get a mathematical model predicting the future. They discuss the example… Not actually predicting the future. It’s more like estimating the chance a thing will happen. How accurate is the model for use in maintenance strategy decision making? This was a very simple example intended to show you that the life of parts can be estimated with some level of confidence, especially over long periods of time. Reliability engineering is not an exact science, rather it provides evidence for making more certain risk management decisions. It’s very impressive Professor, can you give me more examples? Yes, tomorrow let’s have a look at the failures of some other common parts we use often, but these will have different failure curves to those seen so far. Download all 235 slides at BIN95.com/ppt-powerpoints/reliability/reliability-and-maintenance-management.htm