Tools to focus on manufacturing reliability
•
2 gostaram•222 visualizações

This industrial training flyer (Tools to focus on manufacturing reliability) is from our CD with 150 Maintenance training flyers on it. If you want to see what free maintenance flyers might come up in the future, or want to purchase all 150 today, please see the product page below. http://www.bin95.com/ebooks/CD_contents.htm

Recomendados
Mais conteúdo relacionado
Mais de Business Industrial Network
Mais de Business Industrial Network (20)
Último
Último (20)
Tools to focus on manufacturing reliability
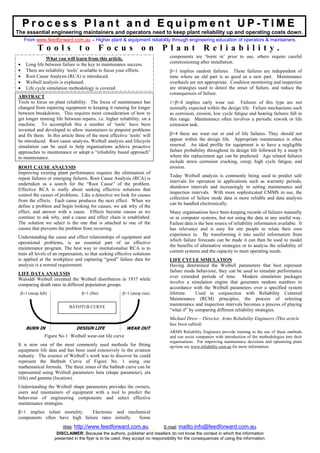
- 1. Process Plant and Equipment UP-TIME The essential engineering maintainers and operators need to keep plant reliability up and operating costs down. From www.feedforward.com.au – Higher plant & equipment reliability through engineering education of operators & maintainers. Tools to Focus on Plant Reliability. What you will learn from this article. components are ‘burnt in’ prior to use, others require careful • Long life between failure is the key to maintenance success. commissioning after installation. • There are reliability ‘tools’ available to focus your efforts. β=1 implies random failures. These failures are independent of • Root Cause Analysis (RCA) is introduced. time where an old part is as good as a new part. Maintenance • Weibull analysis is explained. overhauls are not appropriate. Condition monitoring and inspection • Life cycle simulation methodology is covered are strategies used to detect the onset of failure, and reduce the consequences of failure. ABSTRACT Tools to focus on plant reliability. The focus of maintenance has 1<β<4 implies early wear out. Failures of this type are not changed from repairing equipment to keeping it running for longer normally expected within the design life. Failure mechanisms such between breakdowns. This requires more consideration of how to as corrosion, erosion, low cycle fatigue and bearing failures fall in get longer running life between repairs, i.e. higher reliability, on a this range. Maintenance often involves a periodic rework or life machine. To accomplish this a number of ‘tools’ have been extension task. invented and developed to allow maintainers to pinpoint problems and fix them. In this article three of the most effective ‘tools’ will β>4 these are wear out or end of life failures. They should not be introduced. Root cause analysis, Weibull analysis and lifecycle appear within the design life. Appropriate maintenance is often simulation can be used to help organisations achieve proactive renewal. An ideal profile for equipment is to have a negligible approaches to maintenance or adopt a “reliability based approach” failure probability throughout its design life followed by a steep b to maintenance. where the replacement age can be predicted. Age related failures include stress corrosion cracking, creep, high cycle fatigue, and ROOT CAUSE ANALYSIS erosion. Improving existing plant performance requires the elimination of Today Weibull analysis is commonly being used to predict safe repeat failures or emerging failures. Root Cause Analysis (RCA) is intervals for operation in applications such as warranty periods, undertaken as a search for the “Root Cause” of the problem. shutdown intervals and increasingly in setting maintenance and Effective RCA is really about seeking effective solutions that inspection intervals. With more sophisticated CMMS in use, the control the causes of problems. Like a detective we look for causes collection of failure mode data is more reliable and data analysis from the effects. Each cause produces the next effect. When we can be handled electronically. define a problem and begin looking for causes, we ask why of the effect, and answer with a cause. Effects become causes as we Many organisations have been keeping records of failures manually continue to ask why, and a cause and effect chain is established. or in computer systems, but not using the data in any useful way. The solution we select is the one that is attached to one of the Failure data is the best source of reliability information available. It causes that prevents the problem from recurring. has relevance and is easy for site people to relate their own experience to. By transforming it into useful information from Understanding the cause and effect relationships of equipment and which failure forecasts can be made it can then be used to model operational problems, is an essential part of an effective the benefits of alternative strategies or to analyse the reliability of maintenance program. The best way to institutionalise RCA is to current systems and the capacity to meet operating needs. train all levels of an organisation, so that seeking effective solutions is applied at the workplace and capturing “good” failure data for LIFE CYCLE SIMULATION analysis is a normal requirement. Having determined the Weibull parameters that best represent failure mode behaviour, they can be used to simulate performance LIFE DATA ANALYSIS over extended periods of time. Modern simulation packages Waloddi Weibull invented the Weibull distribution in 1937 while involve a simulation engine that generates random numbers in comparing death rates in different population groups. accordance with the Weibull parameters over a specified system β<1 (steep fall) β=1 (flat) β>1 (steep rise) lifetime. Used in conjunction with Reliability Centered Maintenance (RCM) principles, the process of selecting BATHTUB CURVE maintenance and inspection intervals becomes a process of playing “what if” by comparing different reliability strategies. Michael Drew – Director, Arms Reliability Engineers (This article has been edited) BURN IN DESIGN LIFE WEAR OUT ARMS Reliability Engineers provide training in the use of these methods Figure No 1 Weibull wear-out life curve and can assist companies with introduction of the methodologies into their organisations. For improving maintenance decisions and optimising plant It is now one of the most commonly used methods for fitting up-time see www.reliability.com.au for more information. equipment life data and has been used extensively in the aviation industry. The essence of Weibull’s work was to discover he could represent the Bathtub Curve of Figure No. 1 using one mathematical formula. The three zones of the bathtub curve can be represented using Weibull parameters beta (shape parameter), eta (life) and gamma (location). Understanding the Weibull shape parameters provides the owners, users and maintainers of equipment with a tool to predict the behaviour of engineering components and select effective maintenance strategies. β<1 implies infant mortality. Electronic and mechanical components often have high failure rates initially. Some Web: http://www.feedforward.com.au. E-mail: mailto:info@feedforward.com.au. DISCLAIMER: Because the authors, publisher and resellers do not know the context in which the information presented in the flyer is to be used, they accept no responsibility for the consequences of using the information.