Mais conteúdo relacionado
Semelhante a Water Sense 3 2010 Income (20)
Water Sense 3 2010 Income
- 1. WaterSense
Base Case Scenario
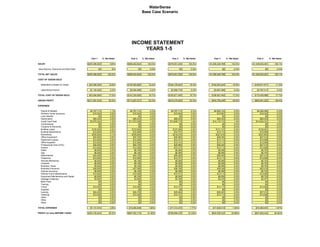
INCOME STATEMENT
YEARS 1-5
Year 1 % Net Sales Year 2 % Net Sales Year 3 % Net Sales Year 4 % Net Sales Year 5 % Net Sales
SALES $255,366,500 100% $856,402,604 100.0% $979,951,250 100.0% $1,009,349,788 103.0% $1,039,630,281 106.1%
(less Returns, Discounts and Bad Debt) $0 0% $0 0.0% $0 0.0% $0 0.0% $0 0.0%
TOTAL NET SALES $255,366,500 100.0% $856,402,604 100.0% $979,951,250 100.0% $1,009,349,788 103.0% $1,039,630,281 106.1%
COST OF GOODS SOLD
MaterialsPurchases for resale $42,384,364 16.6% $140,280,885 16.4% $160,120,625 16.3% $164,924,244 16.8% $169,871,971 17.3%
Labor/Direct Payroll $1,100,320 0.4% $3,054,698 0.4% $3,550,775 0.4% $3,657,298 0.4% $3,767,017 0.4%
TOTAL COST OF GOODS SOLD $43,484,684 17.0% $143,335,583 16.7% $163,671,400 16.7% $168,581,542 17.2% $173,638,988 17.7%
GROSS PROFIT $211,881,816 83.0% $713,067,021 83.3% $816,279,850 83.3% $840,768,246 85.8% $865,991,293 88.4%
EXPENSES
Payroll & Related $2,767,712 1.1% $2,767,712 0.3% $2,767,712 0.3% $2,850,743 0.3% $2,936,266 0.3%
Workers Comp Insurance $15,404 0.0% $15,404 0.0% $15,404 0.0% $15,867 0.0% $16,343 0.0%
Loan Interest $0 0.0% $0 0.0% $0 0.0% $0 0.0% $0 0.0%
Depreciation $95,433 0.0% $95,433 0.0% $95,433 0.0% $95,433 0.0% $95,433 0.0%
Credit Card Fees $3,570,024 1.4% $11,972,508 1.4% $13,699,718 1.4% $14,110,710 1.4% $14,534,031 1.5%
Commissions $0 0.0% $0 0.0% $0 0.0% $0 0.0% $0 0.0%
Coupons & Discounts $0 0.0% $0 0.0% $0 0.0% $0 0.0% $0 0.0%
Building Lease $120,000 0.0% $123,600 0.0% $127,308 0.0% $131,127 0.0% $135,061 0.0%
Building Maintenance $12,000 0.0% $12,360 0.0% $12,731 0.0% $13,113 0.0% $13,506 0.0%
Advertising $300,000 0.1% $309,000 0.0% $318,270 0.0% $327,818 0.0% $337,653 0.0%
Office Equipment $24,000 0.0% $24,720 0.0% $25,462 0.0% $26,225 0.0% $27,012 0.0%
Equipment Leases $12,000 0.0% $12,360 0.0% $12,731 0.0% $13,113 0.0% $13,506 0.0%
Office Supplies $12,000 0.0% $12,360 0.0% $12,731 0.0% $13,113 0.0% $13,506 0.0%
Professional Fees (CPA) $24,000 0.0% $24,720 0.0% $25,462 0.0% $26,225 0.0% $27,012 0.0%
Electric $12,000 0.0% $12,360 0.0% $12,731 0.0% $13,113 0.0% $13,506 0.0%
Water $6,000 0.0% $6,180 0.0% $6,365 0.0% $6,556 0.0% $6,753 0.0%
Gas $6,000 0.0% $6,180 0.0% $6,365 0.0% $6,556 0.0% $6,753 0.0%
Web/Internet $24,000 0.0% $24,720 0.0% $25,462 0.0% $26,225 0.0% $27,012 0.0%
Telephone $12,000 0.0% $12,360 0.0% $12,731 0.0% $13,113 0.0% $13,506 0.0%
Security Monitoring $6,000 0.0% $6,180 0.0% $6,365 0.0% $6,556 0.0% $6,753 0.0%
Licenses $6,000 0.0% $6,180 0.0% $6,365 0.0% $6,556 0.0% $6,753 0.0%
Business Taxes $6,000 0.0% $6,180 0.0% $6,365 0.0% $6,556 0.0% $6,753 0.0%
Business Insurance $36,000 0.0% $37,080 0.0% $38,192 0.0% $39,338 0.0% $40,518 0.0%
Vehicle Insurance $6,000 0.0% $6,180 0.0% $6,365 0.0% $6,556 0.0% $6,753 0.0%
Vehicle Fuel & Maintenance $12,000 0.0% $12,360 0.0% $12,731 0.0% $13,113 0.0% $13,506 0.0%
Equipment Maintenance and Repair $6,000 0.0% $6,180 0.0% $6,365 0.0% $6,556 0.0% $6,753 0.0%
Garbage Collection $3,000 0.0% $3,090 0.0% $3,183 0.0% $3,278 0.0% $3,377 0.0%
Bank Fees $0 0.0% $0 0.0% $0 0.0% $0 0.0% $0 0.0%
Training $0 0.0% $0 0.0% $0 0.0% $0 0.0% $0 0.0%
Travel $12,000 0.0% $12,360 0.0% $12,731 0.0% $13,113 0.0% $13,506 0.0%
Supplies $0 0.0% $0 0.0% $0 0.0% $0 0.0% $0 0.0%
Laundry $24,000 0.0% $24,720 0.0% $25,462 0.0% $26,225 0.0% $27,012 0.0%
Cleaning $12,000 0.0% $12,360 0.0% $12,731 0.0% $13,113 0.0% $13,506 0.0%
Other $0 0.0% $0 0.0% $0 0.0% $0 0.0% $0 0.0%
Other $0 0.0% $0 0.0% $0 0.0% $0 0.0% $0 0.0%
Other $0 0.0% $0 0.0% $0 0.0% $0 0.0% $0 0.0%
TOTAL EXPENSES $7,141,574 2.8% $15,564,848 1.82% $17,313,472 1.77% $17,830,013 1.82% $18,362,051 1.87%
PROFIT (or loss) BEFORE TAXES $204,740,242 80.2% $697,502,173 81.45% $798,966,378 81.53% $822,938,232 83.98% $847,629,242 86.50%