How to Get Started in Social Media for Art League City
Pom full
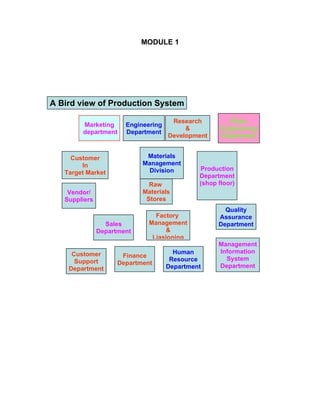
1. MODULE 1
A Bird view of Production System
Research Plant
Marketing Engineering
& Engineering
department Department
Development Department
Customer Materials
In Management
Division Production
Target Market
Department
Raw (shop floor)
Vendor/ Materials
Suppliers Stores
Quality
Factory Assurance
Sales Management Department
Department &
Liasioning
Management
Customer Human Information
Finance System
Support Resource
Department Department
Department Department
2. Introduction
• Production and operations management (POM) is the
management of an organization’s production system.
• A production system takes inputs and converts them into
outputs.
• The conversion process is the predominant activity of a
production system.
• The primary concern of an operations manager is the activities
of the conversion process.
Today's Factors Affecting POM
• Global Competition
• U.S. Quality, Customer Service, and Cost Challenges
• Computers and Advanced Production Technology
• Growth of U.S. Service Sector
• Scarcity of Production Resources
• Issues of Social Responsibility
Different Ways to Study POM
• Production as a System
• Production as an Organization Function
• Decision Making in POM
3. Production as a System
Production System
Conversion
Inputs Outputs
Subsystem
Control
Subsystem
Inputs of a Production System
• External
– Legal, Economic, Social, Technological
• Market
– Competition, Customer Desires, Product Info.
• Primary Resources
– Materials, Personnel, Capital, Utilities
Conversion Subsystem
• Physical (Manufacturing)
• Location Services (Transportation)
• Exchange Services (Retailing)
• Storage Services (Warehousing)
• Other Private Services (Insurance)
• Government Services (Federal, State, Local)
4. Outputs of a Production System
• Direct
– Products
– Services
• Indirect
– Waste
– Pollution
– Technological Advances
Production as an Organization Function
•U.S. companies cannot compete using marketing, finance,
accounting, and engineering alone.
•We focus on POM as we think of global competitiveness, because
that is where the vast majority of a firm’s workers, capital assets, and
expenses reside.
•To succeed, a firm must have a strong operations function teaming
with the other organization functions.
Decision Making in POM
•Strategic Decisions
•Operating Decisions
•Control Decisions
Strategic Decisions
•These decisions are of strategic importance and have long-term
significance for the organization.
•Examples include deciding:
–the design for a new product’s production process
–where to locate a new factory
–whether to launch a new-product development plan
5. Operating Decisions
•These decisions are necessary if the ongoing production of goods
and services is to satisfy market demands and provide profits.
•Examples include deciding:
–how much finished-goods inventory to carry
–the amount of overtime to use next week
–the details for purchasing raw material next month
Control Decisions
•These decisions concern the day-to-day activities of workers, quality
of products and services, production and overhead costs, and
machine maintenance.
•Examples include deciding:
–labor cost standards for a new product
–frequency of preventive maintenance
–new quality control acceptance criteria
What Controls the Operations System?
•Information about the outputs, the conversions, and the inputs is fed
back to management.
•This information is matched with management’s expectations
•When there is a difference, management must take corrective action
to maintain control of the system
What is Operations Management?
Defined
Operations management (OM) is defined as the design, operation,
and improvement of the systems that create and deliver the firm’s
primary products and services
6. Why Study Operations
Management?
Systematic Approach
to Org. Processes
Business Education Operations Career Opportunities
Management
Cross-Functional
Applications
•The Future of Operations
–Outsourcing everything
–Smart factories
–Talking inventory
–Industrial army of robots
–What’s in the box
–Mass customization
–Personalized recommendations
–Sign here, please
7. Operations Management Decision Types
•Strategic (long-term)
•Tactical (intermediate-term)
•Operational planning and control (short-term)
What is a Transformation Process?
Defined
A transformation process is defined as a use of resources to
transform inputs into some desired outputs Transformations
•Physical--manufacturing
•Location--transportation
•Exchange--retailing
•Storage--warehousing
•Physiological--health care
•Informational--telecommunications
8. Core Services Performance Objectives
Quality
Operations
Flexibility Speed
Management
Price (or cost
Reduction)
The Importance of Operations Management
•Synergies must exist with other functional areas of the organization
•Operations account for 60-80% of the direct expenses that burden a
firm’s profit.
9. The Basics of Operations Management
•Operations Management
–The process of managing the resources that are needed to produce
an organization’s goods and services.
–Operations managers focus on managing the “five Ps” of the firm’s
operations:
•People, plants, parts, processes, and planning and control systems.
The Production System
•Input
–A resource required for the manufacture of a product or service.
•Conversion System
–A production system that converts inputs (material and human
resources) into outputs (products or services); also the production
process or technology.
•Output
–A direct outcome (actual product or service) or indirect outcome
(taxes, wages, salaries) of a production system.
10. Types of Production system
Manufacturing System Service System
Intermittent Production
Continuous Production
Batch Production Job Production
Mass production( Flow) Processing Production
Basic Types of Production Processes
•Intermittent Production System
–Production is performed on a start-and-stop basis, such as for the
manufacture of made-to-order products.
•Mass Production
–A special type of intermittent production process using standardized
methods and single-use machines to produce long runs of
standardized items.
11. Mass Customization
–Designing, producing, and delivering customized products to
customers for at or near the cost and convenience of mass-produced
items.
–Mass customization combines high production volume with high
product variety.
–Elements of mass customization:
•Modular product design
•Modular process design
•Agile supply networks
Continuous Production Processes
–A production process, such as those used by chemical plants or
refineries, that runs for very long periods without the start-and-stop
behavior associated with intermittent production.
–Enormous capital investments are required for highly automated
facilities that use special-purpose equipment designed for high
volumes of production and little or no variation in the type of outputs.
Mass Production System (Flow)
Continuous Production
•Anticipation of demand
•May not have uniform production
•Standardized Raw material
•Big volume of limited product line
•Standard facility- high standardization.
•Fixed sequence of operation
•Material handling is easier
•High skilled operator not required
•More Human problem is foreseen
•Huge investment.
•High raw material inventory.
12. Processing Production System
•Extended form of mass production system
•F.G of one stage is fed to next stage
•More automatic machines
•One basic raw material is transferred into several products at several
stages.
•Less highly skilled workers required
•More human problems foreseen
•Highly standardized system
Batch Production System
•Highly specialized Human resource is required
•Highly specialized multi tasking machines
•Machines are shared.
•Production in batches
•Production lots are based on customer demand or order.
•No single sequence of operation
•Finished goods are heterogeneous
Custom built / job order production system
•Highly specialized Human resource is required
•Highly specialized multi tasking machines
•Machines are shared
•Raw material is not standardized
•Process is not standardized
•No scope for repetition of production
13. Comparative study of different production systems
Type Mass/ Flow Process Job Batch
Parameter
Per unitHigh Low High High
manf.cost
Size & Large V. Large Small Medium
Capital Less High Low High
Invest.
Flexibility No No More More
Technical Less Less High High
ability Skills
Orgn. Line staff Line staff Functional Functional
Structure
Industrial Automobile Chemical Construction Consumer
application Sugar Petroleum Bridges prod.
Refinery Milk proces.SPM M/c. Tools
Competitiveness, Strategy, and Productivity
Competitiveness:
How effectively an organization meets the wants and needs of
customers relative to others that offer similar goods or services
Businesses Compete Using Marketing
•Identifying consumer wants and needs
•Pricing
•Advertising and promotion
14. Businesses Compete Using Operations
•Product and service design
•Cost
•Location
•Quality
•Quick response
Businesses Compete Using Operations
•Flexibility
•Inventory management
•Supply chain management
•Service
Why Some Organizations Fail
•Too much emphasis on short-term financial performance
•Failing to take advantage of strengths and opportunities
•Failing to recognize competitive threats
•Neglecting operations strategy
Why Some Organizations Fail
•Too much emphasis in product and service design and not enough
on improvement
•Neglecting investments in capital and human resources
•Failing to establish good internal communications
•Failing to consider customer wants and needs
15. Mission/Strategy/Tactics
Mission Strategy Tactics
How does mission, strategies and tactics relate to
decision making and distinctive competencies?
Strategy
• Strategies
– Plans for achieving organizational goals
• Mission
– The reason for existence for an organization
• Mission Statement
– Answers the question “What business are we in?”
• Goals
– Provide detail and scope of mission
• Tactics
– The methods and actions taken to accomplish strategies
16. Planning and Decision Making
Mission
Goals
Organizational Strategies
Functional Goals
Operations
Finance Strategies
Marketing Strategies
Strategies
Tactics Tactics Tactics
Operating procedures Operating procedures
Operating procedures
Strategy and Tactics
• Distinctive Competencies
The special attributes or abilities that give an organization a
competitive edge.
– Price
– Quality
– Time
– Flexibility
– Service
– Location
17. Examples of Distinctive
U.S. first-class postage
Price Low Cost
Motel-6, Red Roof Inns
High-performance design Sony TV
Quality or high quality Consistent Lexus, Cadillac
quality Pepsi, Kodak, Motorola
Rapid delivery On-time Express Mail, Fedex,
Time delivery One-hour photo, UPS
Variety Burger King
Flexibility Volume Supermarkets
Superior customer Disneyland
Service service Nordstroms
Location Convenience Banks, ATMs
Operations Strategy
•Operations strategy – The approach, consistent with organization
strategy, which is used to guide the operations function.
Strategy Formulation
•Distinctive competencies
•Environmental scanning
•SWOT
•Order qualifiers
•Order winners
18. Strategy Formulation
•Order qualifiers
–Characteristics that customers perceive as minimum standards of
acceptability to be considered as a potential purchase
•Order winners
–Characteristics of an organization’s goods or services that cause it
to be perceived as better than the competition
Key External Factors
•Economic conditions
•Political conditions
•Legal environment
•Technology
•Competition
•Markets
Key Internal Factors
•Human Resources
•Facilities and equipment
•Financial resources
•Customers
•Products and services
•Technology
•Suppliers
Quality and Time Strategies
•Quality-based strategies
–Focuses on maintaining or improving the quality of an organization’s
products or services
–Quality at the source
19. •Time-based strategies
–Focuses on reduction of time needed to accomplish tasks
Operations Strategy and Competitiveness
•Operations Strategy
•A Framework for Operations Strategy
•Meeting the Competitive Challenge
•Productivity Measurement
Operations Strategy – Strategic
Alignment
Customer Needs Corporate Strategy
Alignmen
t
Core
Operations Strategy Competencie
s
Decision
s
Processes, Infrastructure, and Capabilities
3
20. Operations Priorities
• Cost
• Quality
• Delivery Speed (Also, New Product Introduction Speed)
• Delivery Flexibility
• Greenness
• Delivery Reliability
• Coping with Changes in Demand
• Other Product-Specific Criteria
21. A Framework for Organizational
Strategy Customer
Needs
Strategic New and Current
Products
Vision
Performance Priorities
and Requirements
Quality, Dependability,
Service
Speed, Flexibility, and
Enterprise
Capabilities
Operations & Supplier Capabilities
Technology Systems People R&D CIM JIT TQM Distribution
Support Platforms
Financial Management Human Resource Management Information Management
8
OPERATIONS STRATEGY OBJECTIVES
u TRANSLATE MARKET REQ’M’TS TO SPECIFIC
OPERATIONS PRIMARY MISSIONS
u ASSURE OPERATIONS IS CAPABLE TO ACCOMPLISH
PRIMARY MISSION.
1) SEGMENT MARKET BY PRODUCT GROUPS
2) IDENTIFY PRODUCT REQUIREMENTS
3) DETERMINE ORDER WINNERS AND QUALIFIERS
4) CONVERT ORDER WINNERS INTO SPECIFIC PERFORMANCE
REQMTS
22. DEVELOPING PRODUCTION AND OPERATION STRATEGY
Economic Corporate Mission Dis -advantage in
Legal
Social capturing market
Political
Assessment Distinctive Competencies
Business Strategy
of business condition Or Weaknesses
Competition
Market Product / Service Plans Hi-tech
Analysis Machines
Low prod. cost
Skilled HR
Delivery performance Competitive priorities
High quality products &
service Cost, Time, Quality & Automation
Customer service & Flexibility
Flexibility Worn out Prod. System
Production / operation Strategy
Positioning the production system
Product / service plans
Process and technology plans
Strategic allocation of resources
Facility Plan, Capacity Plan, Location and Layout.
Elements of operation strategy
Positioning the production system
A. Product Focused
B. Process Focused
• Product / Service plans
• Out sourcing plans
• Process technology plans
• Strategic allocation of resources
• Facility plans
*Capacity plans
*Location
*Layout
23. Productivity
A measure of the effective use of resources, usually expressed as the
ratio of output to input Productivity ratios are used for Planning
workforce requirements Scheduling equipment
financial analysis
MIT Commission on Industrial Productivity
1985 Recommendations - Still Very Accurate Today
•Less emphasis on short-term financial payoffs and invest more in
R&D.
•Revise corporate strategies to include responses to foreign
competition.
–greater investment in people and equipment
•Knock down communication barriers within organizations and
recognize mutuality of interests with other companies and suppliers.
MIT Commission on Industrial Productivity
1985 Recommendations
•Recognize that the labor force is a resource to be nurtured, not just a
cost to be avoided.
•Get back to basics in managing production/ operations.
–Build in quality at the design stage.
–Place more emphasis on process innovations rather than focusing
sole attention on product innovations - dramatically improve costs,
quality, speed, & flex.
24. U. S. Competitiveness Drivers
•Product/Service Development - NPD
–Teams speed development and enhance manufacturability
•Waste Reduction (LEAN/JIT Philosophy)
–WIP, space, tool costs, and human effort
•Improved Customer-Supplier Relationships
–Look for Win-Win! Taken from Japanese Keiretsu
•Early Adoption of IT Technology Including
–PC Technology – WWW - ERPS
Productivity
Outputs
Productivity =
Inputs
• Partial measures
– output/(single input)
• Multi-factor measures
– output/(multiple inputs)
• Total measure
25. – output/(total inputs)
Productivity Growth
Productivity Growth =
Current Period Productivity – Previous Period
Productivity
Previous Period Productivity
Examples of Partial Productivity Measures
Labor Units of output per labor hour
Units of output per shift
Productivity Value-added per labor hour
Machine Units of output per machine hour
Productivity machine hour
Capital Units of output per dollar input
Dollar value of output per dollar input
Productivity
Energy Units of output per kilowatt-hour
Dollar value of output per kilowatt-
Productivity
hour
26. Factors Affecting Productivity
Capita Qualit
l y
Technolog Managemen
y t
Other Factors Affecting Productivity
•Standardization
•Quality
•Use of Internet
•Computer viruses
•Searching for lost or misplaced items
•Scrap rates
•New workers
•Safety
•Shortage of IT workers
•Layoffs
•Labor turnover
•Design of the workspace
•Incentive plans that reward productivity
27. Improving Productivity
•Develop productivity measures
•Determine critical (bottleneck) operations
•Develop methods for productivity improvements
•Establish reasonable goals
•Get management support
•Measure and publicize improvements
•Don’t confuse productivity with efficiency
28. MODULE 2
Typical Phases of Product Development
•Planning
•Concept Development
•System-Level Design
•Design Detail
•Testing and Refinement
•Production Ramp-up
Economic Analysis of Project Development Costs
•Using measurable factors to help determine:
–Operational design and development decisions
–Go/no-go milestones
•Building a Base-Case Financial Model
–A financial model consisting of major cash flows
–Sensitivity Analysis for “what if” questions
Designing for the Customer
House of Quality
Ideal
Quality Function Customer Value Analysis/
Deployment Value
Product Engineering
29. Designing for the Customer: Quality Function Deployment
•Interventional teams from marketing, design engineering, and
manufacturing
•Voice of the customer
•House of Quality
Designing for the Customer: Value Analysis/Value Engineering
•Achieve equivalent or better performance at a lower cost while
maintaining all functional requirements defined by the customer
–Does the item have any design features that are not necessary?
–Can two or more parts be combined into one?
–How can we cut down the weight?
–Are there nonstandard parts that can be eliminated?
Design for Manufacturability
•Traditional Approach
–“We design it, you build it” or “Over the wall”
Concurrent Engineering
–“Let’s work together simultaneously”
Design for Manufacturing and Assembly
•Greatest improvements related to DFMA arise from simplification of
the product by reducing the number of separate parts:
•During the operation of the product, does the part move relative to all
other parts already assembled?
•Must the part be of a different material or be isolated from other parts
already assembled?
•Must the part be separate from all other parts to allow the
disassembly of the product for adjustment or maintenance?
30. Measuring Product Development
Performance
Performance Measures
Dimension
Time-to-market Freq. of new products introduced
Time to market introduction
Number stated and number completed
Actual versus plan
Percentage of sales from new products
Productivity Engineering hours per project
Cost of materials and tooling per project
Actual versus plan
Quality Conformance-reliability in use
Design-performance and customer satisfaction
Yield-factory and field
Product Design
• Standard parts
• Modular design
• Highly capable production systems
• Concurrent
engineering
Process Design
31. • Small lot sizes
• Setup time reduction
• Manufacturing cells
• Limited work in process
• Quality improvement
• Production flexibility
• Little inventory storage
Benefits of Small Lot Sizes
Reduces
inventory
Less
rework storage
Less
space
Problems are more
apparent
Increases product
flexibility
Easier to balance
operations
Production Flexibility
•Reduce downtime by reducing changeover time
•Use preventive maintenance to reduce breakdowns
•Cross-train workers to help clear bottlenecks
•Use many small units of capacity
•Use off-line buffers
•Reserve capacity for important customers
32. Quality Improvement
•Autonomation
–Automatic detection of defects during production
•Jidoka
–Japanese term for autonomation
Personnel/Organizational Elements
•Workers as assets
•Cross-trained workers
•Continuous improvement
•Cost accounting
•Leadership/project management
Manufacturing Planning and Control
•Level loading
•Pull systems
•Visual systems
•Close vendor relationships
•Reduced transaction processing
•Preventive maintenance
Pull/Push Systems
•Pull system: System for moving work where a workstation pulls
output from the preceding station as needed. (e.g. Kanban)
•Push system: System for moving work where output is pushed to the
next station as it is completed
33. Kanban Production Control System
•Kanban: Card or other device that communicates demand for work
or materials from the preceding station
•Kanban is the Japanese word meaning “signal” or “visible record”
•Paperless production control system
•Authority to pull, or produce comes
from a downstream process.
Kanban Formula
DT(1+X)
N =
C
N = Total number of containers
D = Planned usage rate of using work center
T = Average waiting time for replenishment of parts plus average
production time for a container of parts
X = Policy variable set by management - possible inefficiency in the
system
C = Capacity of a standard container
35. Product and Service Design
• Major factors in design strategy
– Cost
– Quality
– Time-to-market
– Customer satisfaction
– Competitive advantage
Product and service design – or redesign – should be
closely tied to an organization’s strategy
Product or Service Design Activities
•Translate customer wants and needs into product and service
requirements
•Refine existing products and services
•Develop new products and services
•Formulate quality goals
•Formulate cost targets
•Construct and test prototypes
•Document specifications
Reasons for Product or Service Design
•Economic
•Social and demographic
•Political, liability, or legal
•Competitive
•Technological
36. Objectives of Product and Service Design
•Main focus
–Customer satisfaction
•Secondary focus
–Function of product/service
–Cost/profit
–Quality
–Appearance
–Ease of production/assembly
–Ease of maintenance/service
Designing For Operations
Taking into account the capabilities of the organization in designing
goods and services
Legal, Ethical, and Environmental Issues
•Legal
–Product liability
–Uniform commercial code
•Ethical
–Releasing products with defects
•Environmental
–EPA
Regulations & Legal Considerations
•Product Liability - A manufacturer is liable for any injuries or
damages caused by a faulty product.
•Uniform Commercial Code - Products carry an implication of
merchantability and fitness.
37. Standardization
•Standardization
–Extent to which there is an absence of variety in a product, service
or process
•Standardized products are immediately available to customers
Advantages of Standardization
•Fewer parts to deal with in inventory & manufacturing
•Design costs are generally lower
•Reduced training costs and time
•More routine purchasing, handling, and inspection procedures
•Orders fallible from inventory
•Opportunities for long production runs and automation
•Need for fewer parts justifies increased expenditures on perfecting
designs and improving quality control procedures.
Disadvantages of Standardization
•Designs may be frozen with too many imperfections remaining.
•High cost of design changes increases resistance to improvements.
•Decreased variety results in less consumer appeal.
•Mass customization:
–A strategy of producing standardized goods or services, but
incorporating some degree degree of customization
–Delayed differentiation
–Modular design
Delayed Differentiation
•Delayed differentiation is a postponement tactic
–Producing but not quite completing a product or service until
customer preferences or specifications are known
38. Modular Design
Modular design is a form of standardization in which component parts
are subdivided into modules that are easily replaced or interchanged.
It allows:
–easier diagnosis and remedy of failures
–easier repair and replacement
–simplification of manufacturing and assembly
Reliability
•Reliability: The ability of a product, part, or system to perform its
intended function under a prescribed set of conditions
•Failure: Situation in which a product, part, or system does not
perform as intended
•Normal operating conditions: The set of conditions under which an
item’s reliability is specified
Improving Reliability
• Component design
• Production/assembly techniques
• Testing
• Redundancy/backup
• Preventive maintenance procedures
• User education
• System design
Product Design
•Product Life Cycles
•Robust Design
•Concurrent Engineering
•Computer-Aided Design
•Modular Design
39. Robust Design: Design that results in products or services that
can function over a broad range of conditions
Taguchi Approach Robust Design
•Design a robust product
–Insensitive to environmental factors either in manufacturing or in
use.
•Central feature is Parameter Design.
•Determines:
–factors that are controllable and those not controllable
–their optimal levels relative to major product advances
Degree of Newness
•Modification of an existing product/service
•Expansion of an existing product/service
•Clone of a competitor’s product/service
•New product/service
Degree of Design Change
Type of DesignNewness of theNewness to the
Change organization market
Modification Low Low
Expansion Low Low
Clone High Low
New High High
Phases in Product Development Process
40. 1. Idea generation
2. Feasibility analysis
3. Product specifications
4. Process specifications
5. Prototype development
6. Design review
7. Market test
8. Product introduction
9. Follow-up evaluation
Idea Generation
Supply chain based
Ideas Competitor based
Research based
Reverse Engineering
41. Reverse engineering is the dismantling and inspecting of a
competitor’s product to discover product improvements.
Research & Development (R&D)
• Organized efforts to increase scientific knowledge or product
innovation & may involve:
– Basic Research advances knowledge about a subject
without near-term expectations of commercial
applications.
– Applied Research achieves commercial applications.
– Development converts results of applied research into
commercial applications.
Manufacturability
• Manufacturability is the ease of fabrication and/or assembly
which is important for:
– Cost
– Productivity
– Quality
Designing for Manufacturing Beyond the overall objective to achieve
customer satisfaction while making a reasonable profit is:
Design for Manufacturing (DFM)
The designers’ consideration of the organization’s manufacturing
capabilities when designing a product.
The more general term design for operations encompasses services
as well as manufacturing
Concurrent Engineering
Concurrent engineering is the bringing together of engineering design
and manufacturing personnel early in the design phase.
Computer-Aided Design
42. • Computer-Aided Design (CAD) is product design using
computer graphics.
– increases productivity of designers, 3 to 10 times
– creates a database for manufacturing information on
product specifications
– provides possibility of engineering and cost analysis on
proposed designs
Product design
• Design for manufacturing (DFM)
• Design for assembly (DFA)
• Design for recycling (DFR)
• Remanufacturing
• Design for disassembly (DFD)
• Robust design
Recycling
•Recycling: recovering materials for future use
•Recycling reasons
–Cost savings
–Environment concerns
–Environment regulations
Service Design
•Service is an act
•Service delivery system
–Facilities
–Processes
–Skills
•Many services are bundled with products
•Service design involves
43. –The physical resources needed
–The goods that are purchased or consumed by the customer
–Explicit services
–Implicit services
•Service
–Something that is done to or for a customer
•Service delivery system
–The facilities, processes, and skills needed to provide a service
•Product bundle
–The combination of goods and services provided to a customer
•Service package
–The physical resources needed to perform the service
Differences between Product and Service Design
•Tangible – intangible
•Services created and delivered at the same time
•Services cannot be inventoried
•Services highly visible to customers
•Services have low barrier to entry
•Location important to service
Phases in Service Design
•Conceptualize
•Identify service package components
•Determine performance specifications
•Translate performance specifications into design specifications
•Translate design specifications into delivery specifications
Service Blueprinting
44. •Service blueprinting
–A method used in service design to describe and analyze a
proposed service
•A useful tool for conceptualizing a service delivery system
Major Steps in Service Blueprinting
•Establish boundaries
•Identify steps involved
•Prepare a flowchart
•Identify potential failure points
•Establish a time frame
•Analyze profitability
Characteristics of Well Designed Service Systems
•Consistent with the organization mission
•User friendly
•Robust
•Easy to sustain
•Cost effective
•Value to customers
•Effective linkages between back operations
•Single unifying theme
•Ensure reliability and high quality
Challenges of Service Design
•Variable requirements
•Difficult to describe
•High customer contact
•Service – customer encounter
45. Quality Function Deployment
•Quality Function Deployment
–Voice of the customer
–House of quality
QFD: An approach that integrates the “voice of the customer” into the
product and service development process.
Operations Strategy
1. Increase emphasis on component commonality
2. Package products and services
3. Use multiple-use platforms
4. Consider tactics for mass customization
5. Look for continual improvement
6. Shorten time to market
Shorten Time to Market
1. Use standardized components
2. Use technology
3. Use concurrent engineering
Process Selection
46. • Variety
– How much
• Flexibility
– What degree
• Volume
– Expected output
Process Types
• Job shop
– Small scale
• Batch
– Moderate volume
• Repetitive/assembly line
– High volumes of standardized goods or services
• Continuous
– Very high volumes of non-discrete goods
Process design
The complete delineation and description of specific steps in the
production process and the linkage among the steps that will enable
the production system to produce products of the
• desired quality
• required quantity
• at required time
• at the economical cost
Expected by the customer
47. Process Design
Product Idea
Feasibility Studies
Interrelationship of Product and Process
Design Design
Product
Process Design
Advanced Product Planning Organizing the process flow
Advanced Design Relation of process Design to
Production Process Design process Flow
Product evaluation and improvement Evaluating the Process Design
Product use and support
To Produce and Market New Products
Types of Process
• Project
• Job Shop
• Batch
• Assembly line
• Continuous
48. Production Technology
• The method or Technique used in Converting the Raw material
into SFG or FG Economically, Effectively and efficiently is
termed as Production Technology.
The Selection of Technology
• Time
• Cost
• Type of Product
• Volume of production
• Expected Productivity
• Technical Complexity involved
• Degree of Human skill required
• Degree of Quality required
• Availability of Technology
• The Degree of Obsolescence expected.
49. MODULE 3
Facility Planning
• Long range capacity planning,
• Facility location
• Facility layout
Strategic Capacity Planning
Defined
• Capacity can be defined as the ability to hold, receive, store, or
accommodate.
• Strategic capacity planning is an approach for determining
the overall capacity level of capital intensive resources,
including facilities, equipment, and overall labor force size.
Capacity Utilization
• Capacity utilization rate = Capacity used
Best operating level
• Capacity used
– rate of output actually achieved
• Best operating level
– capacity for which the process was designed
50. Best Operating Level
Average
unit cost
of output
Underutilization Overutilization
Best
Operating
Level
Volume
Example of Capacity Utilization
• During one week of production, a plant produced 83 units of a
product. Its historic highest or best utilization recorded was 120
units per week. What is this plant’s capacity utilization rate?
• Answer:
Capacity utilization rate = Capacity used .
Best operating level
= 83/120
=0.69 or 69%
51. Economies & Diseconomies
of Scale
Economies of Scale and the Experience Curve working
100-unit
Average plant
unit cost 200-unit
of output plant 400-unit
300-unit
plant
plant
Diseconomies of Scale start working
Volume
52. The Experience Curve
As plants produce more products, they
gain experience in the best production
methods and reduce their costs per
unit.
Cost or
price
per unit
Total accumulated production of units
Capacity Focus
• The concept of the focused factory holds that production
facilities work best when they focus on a fairly limited set of
production objectives.
• Plants Within Plants (PWP) (from Skinner)
– Extend focus concept to operating level
Capacity Flexibility
• Flexible plants
• Flexible processes
53. • Flexible workers
Capacity Planning: Balance
Stage 1 Stage 2 Stage 3
Units
per 6,000 7,000 4,500
month
Maintaining System Balance
Capacity Planning
• Frequency of Capacity Additions
• External Sources of Capacity
Determining Capacity Requirements
• Forecast sales within each individual product line.
• Calculate equipment and labor requirements to meet the
forecasts.
• Project equipment and labor availability over the planning
horizon.
54. Example of Capacity Requirements
A manufacturer produces two lines of mustard, Fancy Fine and
Generic line. Each is sold in small and family-size plastic bottles.
The following table shows forecast demand for the next four years.
Year: 1 2 3 4
FancyFine
Small (000s) 50 60 80 100
Family (000s) 35 50 70 90
Generic
Small (000s) 100 110 120 140
Family (000s) 80 90 100 110
Example of Capacity Requirements: Equipment and Labor
Requirements
Year: 1 2 3 4
Small (000s) 150 170 200 240
Family (000s) 115 140 170 200
Three 100,000 units-per-year machines are available for small-bottle
production. Two operators required per machine.
Two 120,000 units-per-year machines are available for family-sized-
bottle production. Three operators required per machine.
57. Importance of Capacity Decisions
1. Impacts ability to meet future demands
2. Affects operating costs
3. Major determinant of initial costs
4. Involves long-term commitment
5. Affects competitiveness
6. Affects ease of management
7. Globalization adds complexity
8. Impacts long range planning
Capacity
• Design capacity
– maximum output rate or service capacity an operation,
process, or facility is designed for
• Effective capacity
– Design capacity minus allowances such as personal time,
maintenance, and scrap
• Actual output
– rate of output actually achieved--cannot
exceed effective capacity.
Efficiency and Utilization
Actual output
Efficiency =
Effective capacity
Actual output
Utilization =
Design capacity
58. Both measures expressed as percentages
Determinants of Effective Capacity
• Facilities
• Product and service factors
• Process factors
• Human factors
• Operational factors
• Supply chain factors
• External factors
Strategy Formulation
• Capacity strategy for long-term demand
• Demand patterns
• Growth rate and variability
• Facilities
– Cost of building and operating
• Technological changes
– Rate and direction of technology changes
• Behavior of competitors
• Availability of capital and other inputs
Key Decisions of Capacity Planning
1. Amount of capacity needed
2. Timing of changes
3. Need to maintain balance
4. Extent of flexibility of facilities
Capacity cushion – extra demand intended to offset uncertainty
59. Steps for Capacity Planning
1. Estimate future capacity requirements
2. Evaluate existing capacity
3. Identify alternatives
4. Conduct financial analysis
5. Assess key qualitative issues
6. Select one alternative
7. Implement alternative chosen
8. Monitor results
Make or Buy
1. Available capacity
2. Expertise
3. Quality considerations
4. Nature of demand
5. Cost
6. Risk
Developing Capacity Alternatives
1. Design flexibility into systems
2. Take stage of life cycle into account
3. Take a “big picture” approach to capacity changes
4. Prepare to deal with capacity “chunks”
5. Attempt to smooth out capacity requirements
60. 6. Identify the optimal operating level
Economies of Scale
• Economies of scale
– If the output rate is less than the optimal level, increasing
output rate results in decreasing average unit costs
• Diseconomies of scale
– If the output rate is more than the optimal level, increasing
the output rate results in increasing average unit costs
Evaluating Alternatives
Production units have an optimal rate of output for minimal cost.
Average cost per
Minimum average cost per unit
unit
Minimu
m
cost
0 Rate of
output
61. Evaluating Alternatives
Average cost per unit
Minimum cost & optimal operating rate are
functions of size of production unit.
Small
plant Medium
plant Large
plant
0
Output rate
Planning Service Capacity
• Need to be near customers
– Capacity and location are closely tied
• Inability to store services
– Capacity must be matched with timing of demand
• Degree of volatility of demand
– Peak demand periods
Assumptions of Cost-Volume Analysis
1. One product is involved
2. Everything produced can be sold
3. Variable cost per unit is the same regardless of volume
62. 4. Fixed costs do not change with volume
5. Revenue per unit constant with volume
6. Revenue per unit exceeds variable cost per unit
Financial Analysis
• Cash Flow - the difference between cash received from sales
and other sources, and cash outflow for labor, material,
overhead, and taxes.
• Present Value - the sum, in current value, of all future cash
flows of an investment proposal.
Calculating Processing Requirements
Standard
Annual processing time Processing time
Product Demand per unit (hr.) needed (hr.)
#1 400 5.0 2,000
#2 300 8.0 2,400
#3 700 2.0 1,400
5,800
63. Location Planning and Analysis
Need for Location Decisions
• Marketing Strategy
• Cost of Doing Business
• Growth
• Depletion of Resources
Nature of Location Decisions
• Strategic Importance
– Long term commitment/costs
– Impact on investments, revenues, and operations
– Supply chains
• Objectives
– Profit potential
– No single location may be better than others
– Identify several locations from which to choose
• Options
– Expand existing facilities
– Add new facilities
– Move
Making Location Decisions
• Decide on the criteria
• Identify the important factors
• Develop location alternatives
64. • Evaluate the alternatives
• Make selection
Location Decision Factors
1. Regional Factors
• Location of raw materials
• Location of markets
• Labor factors
• Climate and taxes
2. Community Considerations
• Quality of life
• Services
• Attitudes
• Taxes
• Environmental regulations
• Utilities
• Developer support
3. Multiple Plant Strategies
• Product plant strategy
• Market area plant strategy
• Process plant strategy
4. Site-related Factors
• Land
• Transportation
• Environmental
• Legal
Comparison of Service and Manufacturing Considerations
65. Manufacturing/Distribution Service/Retail
Cost Focus Revenue focus
Transportation modes/costs Demographics:
age,income,etc
Energy availability, costs Population/drawing area
Labor cost/availability/skills Competition
Building/leasing costs Traffic volume/patterns
Customer access/parking
Evaluating Locations
• Cost-Profit-Volume Analysis
– Determine fixed and variable costs
– Plot total costs
– Determine lowest total costs
Location Cost-Volume Analysis
• Assumptions
– Fixed costs are constant
– Variable costs are linear
– Output can be closely estimated
– Only one product involved
Evaluating Locations
• Transportation Model
– Decision based on movement costs of raw materials or
finished goods
• Factor Rating
– Decision based on quantitative and qualitative inputs
66. • Center of Gravity Method
– Decision based on minimum distribution costs
Facility Layout
Layout: the configuration of departments, work centers, and
equipment, with particular emphasis on movement of work
(customers or materials) through the system
Importance of Layout Decisions
• Requires substantial investments of money and effort
• Involves long-term commitments
• Has significant impact on cost and efficiency of short-term
operations
The Need for Layout Decisions
Inefficient
operations
For Example: Changes in the
High Cost design
Bottleneck of products or
s
Accident
The introduction of s
new products or
services
Safety
hazards
67. The Need for Layout Design
Changes in
environmenta Changes in volume
l of
or other legal output or mix of
requirements products
Morale
Changes in problems
methods
and equipment
Basic Layout Types
• Product layouts
• Process layouts
• Fixed-Position layout
• Combination layouts
Basic Layout Types
• Product layout
– Layout that uses standardized processing operations to
achieve smooth, rapid, high-volume flow
• Process layout
– Layout that can handle varied processing requirements
• Fixed Position layout
– Layout in which the product or project remains stationary,
and workers, materials, and equipment are moved as
needed
68. Advantages of Product Layout
Figure 6.4 Product Layout
Raw
Station Station Station Station Finished
materials 1 2 3 4 item
or customer
Material Material Material Material
and/or and/or and/or and/or
labor labor labor labor
Used for Repetitive or Continuous Processing
Advantages of Product Layout
• High rate of output
• Low unit cost
• Labor specialization
• Low material handling cost
• High utilization of labor and equipment
• Established routing and scheduling
• Routing accounting and purchasing
Disadvantages of Product Layout
• Creates dull, repetitive jobs
• Poorly skilled workers may not maintain equipment or quality of
output
• Fairly inflexible to changes in volume
• Highly susceptible to shutdowns
• Needs preventive maintenance
• Individual incentive plans are impractical
69. Figure 6.7 Process Layout
Process Layout
(functional)
Dept. A Dept. C Dept. E
Dept. B Dept. D Dept. F
Used for intermittent processing
Job Shop or Batch
Product Layout
Product Layout
(sequential)
Work Work Work
Station 1 Station 2 Station 3
Used for Repetitive Processing
Repetitive or Continuous
Advantages of Process Layouts
• Can handle a variety of processing requirements
70. • Not particularly vulnerable to equipment failures
• Equipment used is less costly
• Possible to use individual incentive plans
Disadvantages of Process Layouts
• In-process inventory costs can be high
• Challenging routing and scheduling
• Equipment utilization rates are low
• Material handling slow and inefficient
• Complexities often reduce span of supervision
• Special attention for each product or customer
• Accounting and purchasing are more involved
Cellular Layouts
• Cellular Production
– Layout in which machines are grouped into a cell that can
process items that have similar processing requirements
• Group Technology
– The grouping into part families of items with similar design
or manufacturing characteristics
Functional vs. Cellular Layouts
Dimension Functional Cellular
Number of movesmany few
between
departments
Travel distances longer shorter
Travel paths variable fixed
Job waiting times greater shorter
Throughput time higher lower
Amount of work inhigher lower
process
Supervision higher lower
difficulty
Scheduling higher lower
complexity
Equipment lower higher
71. utilization
Other Service Layouts
• Warehouse and storage layouts
• Retail layouts
• Office layouts
Design Product Layouts: Line Balancing
Line Balancing is the process of assigning tasks to workstations in
such a way that the workstations have approximately
equal time requirements.
Cycle Time
Cycle time is the maximum time allowed at each workstation to
complete its set of tasks on a unit.
Determine Maximum Output
OT
Output capacity =
CT
OT = operating time per day
D = Desired output rate
OT
CT = cycle time =
D
72. Determine the Minimum Number of Workstations Required
(D)(∑ t)
N=
OT
∑ t = sum of task times
Calculate Percent Idle Time
Idle time per cycle
Percent idle time =
(N)(CT)
Efficiency = 1 – Percent idle time
Designing Process Layouts
Information Requirements:
1. List of departments
2. Projection of work flows
3. Distance between locations
4. Amount of money to be invested
5. List of special considerations
6. Location of key utilities
73. Process Layout
Millin
g
Assembl
y & Test Grindin
g
Drillin Platin
g g
Process Layout - work travels to dedicated process centers
74. MODULE 4 (08 Hours)
Capacity Management:
Job Design, Ergonomics,
Methods Study and Work Measurement,
Employee Productivity,
Learning Curve, Short-term Capacity Planning
Aggregate planning and Capacity requirement planning
(Problems in Work Measurement and Short term Capacity Planning)
Design of
Work Systems
Job Design, Ergonomics,
Methods Study and Work Measurement,
Employee Productivity,
Job Design
• Job design involves specifying the content and methods of job
– What will be done
– Who will do the job
– How the job will bob will be done
– Where the job will be done
– Ergonomics
Design of Work Systems
• Specialization
• Behavioral Approaches to Job Design
• Teams
• Methods Analysis
• Motions Study
• Working conditions
Job Design Success
Successful Job Design must be:
• Carried out by experienced personnel with the necessary training and background
• Consistent with the goals of the organization
• In written form
• Understood and agreed to by both management and employees
75. Specialization in Business: Advantages
Table 7.1
For Management For Labor
1. Simplifies 1. Low education
skill
2. High
2 Minimu
3. Low wage responsibilitie
3 Little mental
neede
Disadvantages
For Management: For Labor:
1. Difficult to motivate 1. Monotonous work
quality 2. Limited opportunities
2. Worker dissatisfaction, for advancement
possibly resulting in 3. Little control over work
absenteeism, high
4. Little opportunity for
turnover, disruptive
self-fulfillment
tactics, poor attention
to quality
Behavioral Approaches to Job Design
• Job Enlargement
– Giving a worker a larger portion of the total task by horizontal loading
• Job Rotation
– Workers periodically exchange jobs
• Job Enrichment
– Increasing responsibility for planning and coordination tasks, by vertical
loading
76. Motivation and Trust
• Motivation
– Influences quality and productivity
– Contributes to work environment
• Trust
– Influences productivity and employee-management relations
Teams
• Benefits of teams
– Higher quality
– Higher productivity
– Greater worker satisfaction
• Self-directed teams
– Groups of empowered to make certain changes in their work process
Methods Analysis
• Methods analysis
– Analyzing how a job gets done
– Begins with overall analysis
– Moves to specific details
Methods Analysis
The need for methods analysis can come
from a number of different sources:
• Changes in tools and equipment
• Changes in product design
or new products
• Changes in materials or procedures
• Other factors (e.g. accidents, quality problems)
Methods Analysis Procedure
1. Identify the operation to be studied
2. Get employee input
3. Study and document current method
4. Analyze the job
5. Propose new methods
6. Install new methods
7. Follow-up to ensure improvements have been achieved
Analyzing the Job
• Flow process chart
– Chart used to examine the overall sequence of an operation by focusing on
movements of the operator or flow of materials
• Worker-machine chart
– Chart used to determine portions of a work cycle during which an operator
and equipment are busy or idle
77. Figure 7-2
tion
nt
tion
FLOW PROCESS CHART ANALYST PAGE
me
age
pec
Job Requisition of petty cash
ay
D. Kolb 1 of 2
e ra
ve
Stor
Del
Ins
Mo
Op
Details of Method
Requisition made by department head
Put in “pick-up” basket
To accounting department
Account and signature verified
Amount approved by treasurer
Amount counted by cashier
Amount recorded by bookkeeper
Petty cash sealed in envelope
Petty cash carried to department
Petty cash checked against requisition
Receipt signed
Petty cash stored in safety box
Motion Study
Motion study is the systematic study of the human motions used to perform an operation.
Motion Study Techniques
• Motion study principles - guidelines for designing motion-efficient work
procedures
• Analysis of therbligs - basic elemental motions into which a job can be broken
down
• Micromotion study - use of motion pictures and slow motion to study motions that
otherwise would be too rapid to analyze
• Charts
Developing Work Methods
1. Eliminate unnecessary motions
2. Combine activities
3. Reduce fatigue
4. Improve the arrangement of the workplace
5. Improve the design of tools and equipment
78. Working Conditions
Temperature & Ventilation
Humidity
Illumination Color
Noise & Work
Vibration Breaks
Safet Causes of
y Accidents
Work Measurement
• Standard time
• Stopwatch time study
• Historical times
• Predetermined data
• Work Sampling
79. Compensation
• Time-based system
– Compensation based on time an employee has worked during a pay period
• Output-based (incentive) system
– Compensation based on the amount of output an employee produces
during a pay period
Form of Incentive Plan
• Accurate
• Easy to apply
• Consistent
• Easy to understand
• Fair
Compensation
• Individual Incentive Plans
• Group Incentive Plans
• Knowledge-Based Pay System
• Management Compensation
Learning Curves
• Learning curves: the time required to perform a task decreases with increasing
repetitions
Learning Effect
81. Time per unit
Average
Improvements may create a
scallop effect in the curve.
Time
Applications of Learning Curves
1. Manpower planning and scheduling
2. Negotiated purchasing
3. Pricing new products
4. Budgeting, purchasing, and inventory planning
5. Capacity Planning
Worker Learning Curves
82. Time/cycle
A
(underqualified)
s
B
(average) Standard
time
C
(overqualified)
One Training
week time
Cautions and Criticisms
• Learning rates may differ from organization to organization
• Projections based on learning curves should be viewed as approximations
• Estimates based the first unit should be checked for valid times
• At some point the curve might level off or even tip upward
• Some improvements may be more apparent than real
• For the most part, the concept does not apply to mass production
Aggregate Planning
• Operations Planning Overview
• The hierarchical planning process
• Aggregate production planning
• Examples: Chase and Level strategies
Operations Planning Overview
• Long-range planning
– Greater than three year planning horizon
– Usually with yearly increments
• Intermediate-range planning
83. – 1 to 3 years
– Usually with monthly or quarterly increments
• Short-range planning
– One year
– Usually with weekly increments
Strategic Planning
Long-
range Sales Planning
Intermediate- Aggregate Planning
range
Master Production Scheduling
Product/Service Schedule
Resource Requirements Planning Workforce &
Mat’ls, Capacity, Manpower Customer Scheduling
Short- Order Scheduling Daily Workforce &
range Production/Purchases Customer Scheduling
Hierarchical Production Planning
84. Exhibit 12.2
Decision Level Decision Process Forecasts needed
Allocates
Annual demand by
production
Corporate item and by region
among plants
Determines Monthly demand
Plant manager seasonal plan by for 15 months by
product type product type
Determines
Monthly demand
Shop monthly
for 5 months by
item production
superintendent schedules
item
Aggregate Planning
• Goal: Specify the optimal combination of
– production rate (units completed per unit of time)
– workforce level (number of workers)
– inventory on hand (inventory carried from previous period)
• Product group or broad category (Aggregation)
• Intermediate-range planning period: 6-18 months
Balancing Aggregate Demand and Aggregate Production Capacity
85. 10000
Suppose the figure to the 10000
right represents forecast 8000 7000
8000
demand in units. 5500
6000
6000
4500
4000
Now suppose this lower
figure represents the 2000
aggregate capacity of the 0
company to meet Jan
Feb
Mar Apr May Jun
demand.
10000 9000
What we want to do is 8000
balance out the production 8000
6000
rate, workforce levels, and 6000
4500 4000 4000
inventory to make these 4000
figures match up.
2000
0
Feb
Jan Mar Apr May Jun
Key Strategies for Meeting Demand
• Chase
• Level
• Some combination of the two
STRATEGIES ACTIVE WRT DEMAND
• USE MARKETING TO SMOOTH DEMAND
• EXAMPLES
• PRICE
• PRODUCT
• PLACE
• PROMOTION
Proactive Demand Management to Equate Supply and Demand
86. 10000
SEASONAL 8000
DEMAND - 6000
SNOW SKIIS 4000
2000
0
10000
CONTRA-
8000
SEASONAL
6000
DEMAND -
4000
_______________
2000
0
Proactive Demand Management to Equate Supply and Demand
10000
CYCLICAL 8000
DEMAND - 6000
NEW CARS 4000
2000
0
10000
CONTRA-CYCLICAL
8000
DEMAND -
6000
__________________
4000
2000
0
Jason Enterprises Aggregate Planning Examples: Unit Demand and Cost Data
87. Suppose we have the following unit demand and cost information:
Demand/mo Jan Feb Mar Apr May Jun
500 600 650 800 900 800
Days per month 22 19 21 21 22
Materials $100/unit
Holding costs $10/unit per mo.
Marginal cost of stockout $20/unit per mo.
Hiring and training cost $50/worker
Layoff costs $100/worker
Labor hours required . 4 hrs/unit
Straight time labor cost/OT $12.50/18.75/hour
Beginning inventory 200 units
Productive hours/worker/day 8.00
Paid straight hrs/day 8
Capacity Planning
• Capacity is the upper limit or ceiling on the load that an operating unit can handle.
• The basic questions in capacity handling are:
– What kind of capacity is needed?
– How much is needed?
– When is it needed?
Importance of Capacity Decisions
1. Impacts ability to meet future demands
2. Affects operating costs
3. Major determinant of initial costs
4. Involves long-term commitment
5. Affects competitiveness
6. Affects ease of management
7. Globalization adds complexity
8. Impacts long range planning
Capacity
• Design capacity
88. – maximum output rate or service capacity an operation, process, or facility
is designed for
• Effective capacity
– Design capacity minus allowances such as personal time, maintenance,
and scrap
• Actual output
– rate of output actually achieved--cannot
exceed effective capacity.
Efficiency and Utilization
Actual output
Efficiency =
Effective capacity
Actual output
Utilization =
Design capacity
Both measures expressed as percentages
Efficiency/Utilization Example
Design capacity = 50 trucks/day
Effective capacity = 40 trucks/day
Actual output = 36 units/day
Actual output = 36 units/day
Efficiency = = 90%
Effective capacity 40 units/ day
Utilization = Actual output = 36 units/day
= 72%
Design capacity 50 units/day
Determinants of Effective Capacity
• Facilities
89. • Product and service factors
• Process factors
• Human factors
• Operational factors
• Supply chain factors
• External factors
Strategy Formulation
• Capacity strategy for long-term demand
• Demand patterns
• Growth rate and variability
• Facilities
– Cost of building and operating
• Technological changes
– Rate and direction of technology changes
• Behavior of competitors
• Availability of capital and other inputs
Key Decisions of Capacity Planning
1. Amount of capacity needed
2. Timing of changes
3. Need to maintain balance
4. Extent of flexibility of facilities
Capacity cushion – extra demand intended to offset uncertainty
Steps for Capacity Planning
1. Estimate future capacity requirements
2. Evaluate existing capacity
3. Identify alternatives
4. Conduct financial analysis
5. Assess key qualitative issues
6. Select one alternative
7. Implement alternative chosen
8. Monitor results
Make or Buy
1. Available capacity
2. Expertise
3. Quality considerations
4. Nature of demand
5. Cost
6. Risk
Developing Capacity Alternatives
1. Design flexibility into systems
90. 2. Take stage of life cycle into account
3. Take a “big picture” approach to capacity changes
4. Prepare to deal with capacity “chunks”
5. Attempt to smooth out capacity requirements
6. Identify the optimal operating level
Economies of Scale
• Economies of scale
– If the output rate is less than the optimal level, increasing output rate
results in decreasing average unit costs
• Diseconomies of scale
– If the output rate is more than the optimal level, increasing the output rate
results in increasing average unit costs
Evaluating Alternatives
Figure 5.3
Production units have an optimal rate of output for minimal cost.
Average cost per
Minimum average cost per unit
unit
Minimu
m
cost
0 Rate of
output
Evaluating Alternatives
91. Figure 5.4
Average cost per unit
Minimum cost & optimal operating rate are
functions of size of production unit.
Small
plant Medium
plant Large
plant
0
Output rate
Planning Service Capacity
• Need to be near customers
– Capacity and location are closely tied
• Inability to store services
– Capacity must be matched with timing of demand
• Degree of volatility of demand
– Peak demand periods
Cost-Volume Relationships
92. C+
Amount ($)
V
t= t
o s
cos
lc le
Tota riab
C va
F tal
To C)
(V Fixed cost
(FC)
0
Q (volume in
units)
Cost-Volume Relationships
93. Amount ($)
al u e
ot en
T v
re
0
Q (volume in
units)
Cost-Volume Relationships
ue
en ofi
t
Amount ($)
v
re VC PrT
C
=
a l C+
ot F st
TC l co
=T T ota
+ VC
FC 3 machines
T C
C=
C +V 2 machines
F
Break-Even Problem with Step Fixed Costs
1 machine
0 BEP units
Q (volume in units)
Quantity
Step fixed costs and variable costs.
95. $
BEP
3
T
BE 2 C
T P
C 3
T
C 2
T 1
R
Quantit
Multiple break-even y
points
Assumptions of Cost-Volume Analysis
1. One product is involved
2. Everything produced can be sold
3. Variable cost per unit is the same regardless of volume
4. Fixed costs do not change with volume
5. Revenue per unit constant with volume
6. Revenue per unit exceeds variable cost per unit
Financial Analysis
• Cash Flow - the difference between cash received from sales and other sources,
and cash outflow for labor, material, overhead, and taxes.
• Present Value - the sum, in current value, of all future cash flows of an investment
proposal.
Calculating Processing Requirements
96. Standard
Annual processing time Processing time
Product Demand per unit (hr.) needed (hr.)
#1 400 5.0 2,000
#2 300 8.0 2,400
#3 700 2.0 1,400
5,800
97. MODULE 5 (10 Hours)
Materials Management:
Scope of Materials Management, functions,
information systems for Materials Management,
Purchasing functions, Stores Management,
Inventory Management,
Materials requirement planning,
Just in Time (JIT) and Enterprise Resource Planning (ERP),
(Problems in Inventory Management and Vendor Selection)
Inventory Management
Inventory
• Types of Inventory Items
– Raw materials and purchased parts from outside suppliers.
– Components: subassemblies that are awaiting final assembly.
– Work in process: all materials or components on the production floor in
various stages of production.
– Finished goods: final products waiting for purchase or to be sent to
customers.
– Supplies: all items needed but that are not part of the finished product,
such as paper clips, duplicating machine toner, and tools.
The Role of Inventory Management
• Inventory Management
– The process of ensuring that the firm has adequate inventories of all parts
and supplies needed, within the constraint of minimizing total inventory
costs.
• Inventory Costs
– Ordering (setup) costs
– Acquisition costs
– Holding (carrying) costs
– Stockout costs
Inventory Costs
• Ordering (Setup)
Costs
– The costs, usually fixed, of placing an order or setting up machines for
a production run.
• Acquisition Costs
– The total costs of all
units bought to fill an order, usually varying with the size of the
order.
• Inventory-Holding (Carrying) Costs
– All the costs associated with carrying parts or materials in inventory.
98. • Stockout Costs
– The costs associated with running out of raw materials, parts, or finished-
goods inventory.
Basic Inventory Management Systems
• ABC Inventory Management
• Inventory is divided into three dollar-volume categories—A, B, and C—with the
A parts being the most active (largest dollar volume).
– Inventory surveillance concentrates most on checking the A parts to guard
against costly stockouts.
– The idea is to focus most on the high-annual-dollar-volume A inventory
items, to a lesser extent on the B items, and even less on the C items.
Economic Order Quantity (EOQ)
• Economic Order Quantity (EOQ)
– An inventory management system based on a simple formula that is used
to determine the most economical quantity to order so that the total of
inventory and setup costs is minimized.
– Assumptions:
• Constant per unit holding and ordering costs
• Constant withdrawals from inventory
• No discounts for large quantity orders
• Constant lead time for receipt of orders
The Economic Order Quantity Model
99. Controlling For Quality And Productivity
• Quality
– The extent to which a product or service is able to meet customer needs
and expectations.
• Customer’s needs are the basic standard for measuring quality
• High quality does not have to mean high price.
• ISO 9000
– The quality standards of the International Standards Organization.
• Total Quality Management (TQM)
– A specific organization-wide program that integrates all the functions and
related processes of a business such that they are all aimed at maximizing
customer satisfaction through ongoing improvements.
– Also called: Continuous improvement, Zero defects, Six-Sigma, and
Kaizen (Japan)
• Malcolm Baldridge Award
– A prize created in 1987 by the U.S. Department of Commerce to recognize
outstanding achievement in quality control management.
Inventory: a stock or store of goods
Independent
Demand
A Dependent Demand
B(4 C(2
) )
D(2 E(1 D(3 F(2
) ) ) )
Independent demand is uncertain. Dependent demand is certain.
100. Types of Inventories
• Raw materials & purchased parts
• Partially completed goods called
work in progress
• Finished-goods inventories
– (manufacturing firms)
or merchandise
(retail stores)
• Replacement parts, tools, & supplies
• Goods-in-transit to warehouses or customers
Functions of Inventory
• To meet anticipated demand
• To smooth production requirements
• To decouple operations
• To protect against stock-outs
• To take advantage of order cycles
• To help hedge against price increases
• To permit operations
• To take advantage of quantity discounts
Objective of Inventory Control
• To achieve satisfactory levels of customer service while keeping inventory costs
within reasonable bounds
– Level of customer service
– Costs of ordering and carrying inventory
Effective Inventory Management
• A system to keep track of inventory
• A reliable forecast of demand
• Knowledge of lead times
• Reasonable estimates of
– Holding costs
– Ordering costs
– Shortage costs
• A classification system
101. Inventory Counting Systems
• Periodic System
Physical count of items made at periodic intervals
• Perpetual Inventory System
System that keeps track
of removals from inventory
continuously, thus
monitoring
current levels of
each item
• Two-Bin System - Two containers of inventory; reorder when the first is empty
• Universal Bar Code - Bar code
printed on a label that has
information about the item
to which it is attached
0
214800 232087768
Key Inventory Terms
• Lead time: time interval between ordering and receiving the order
• Holding (carrying) costs: cost to carry an item in inventory for a length of time,
usually a year
• Ordering costs: costs of ordering and receiving inventory
• Shortage costs: costs when demand exceeds supply
102. ABC Classification System
Classifying inventory according to some measure of importance and allocating control
efforts accordingly.
A - very important
B - mod. important
C - least important
Hig
h A
Annual
$ value B
of items
Lo C
w
Few Man
Number of y
Items
Cycle Counting
• A physical count of items in inventory
• Cycle counting management
– How much accuracy is needed?
– When should cycle counting be performed?
– Who should do it?
Economic Order Quantity Models
• Economic order quantity model
• Economic production model
• Quantity discount model
Assumptions of EOQ Model
• Only one product is involved
• Annual demand requirements known
• Demand is even throughout the year
• Lead time does not vary
• Each order is received in a single delivery
• There are no quantity discounts
The Inventory Cycle
103. Profile of Inventory Level Over Time
Q Usage
Quantity rate
on hand
Reorder
point
Time
Receive Place Receive Place Receive
order order order order order
Lead
time
Total Cost
Annual Annual
Total cost = carrying + ordering
cost cost
Q DS
TC = H +
2 Q
Cost Minimization Goal
104. The Total-Cost Curve is U-Shaped
Q D
TC = H+ S
2 Q
Annual Cost
Ordering Costs
Order Quantity
QO (optimal order quantity) (Q)
Deriving the EOQ
Using calculus, we take the derivative of the total cost function and set the derivative
(slope) equal to zero and solve for Q.
2DS 2(Annual Demand)(Order or Setup Cost)
Q OPT = =
H Annual Holding Cost
Minimum Total Cost
The total cost curve reaches its minimum where the carrying and ordering costs
are equal.
2DS 2(Annual Demand)(Order or Setup Cost)
Q OPT = =
H Annual Holding Cost
Economic Production Quantity (EPQ)
• Production done in batches or lots
105. • Capacity to produce a part exceeds the part’s usage or demand rate
• Assumptions of EPQ are similar to EOQ except orders are received incrementally
during production
Economic Production Quantity Assumptions
• Only one item is involved
• Annual demand is known
• Usage rate is constant
• Usage occurs continually
• Production rate is constant
• Lead time does not vary
• No quantity discounts
Economic Run Size
2 DS p
Q0 =
H p− u
Total Costs with Purchasing Cost
Annual Annual
TC carrying + ordering + Purchasing
cost
cost cost
Q DS
TC =
2
H + Q + PD
106. Total Costs with PD
Cost
Adding Purchasing cost TC with PD
doesn’t change EOQ
TC without PD
PD
0 EOQ Quantity
108. TCa
Total Cost
TCb
Decreasin
TCc g
Price
CC a,b,c
O
C
EO Quantity
Q
When to Reorder with EOQ Ordering
• Reorder Point - When the quantity on hand of an item drops to this amount, the
item is reordered
• Safety Stock - Stock that is held in excess of expected demand due to variable
demand rate and/or lead time.
• Service Level - Probability that demand will not exceed supply during lead time.
109. Determinants of the Reorder Point
• The rate of demand
• The lead time
• Demand and/or lead time variability
• Stockout risk (safety stock)
Safety Stock
Quantit
Maximum probable
demand
y
during lead time
Expected
demand
during lead time
RO
P
Safety
stock Tim
L
T e
Reorder Point