Integrating Actuals Into Financial Plans
•
0 gostou•447 visualizações

Understand the real requirements for "integrating actuals into financial plans" not simply "importing data into financial plans"... This technical white paper goes over the importance of figuring out what data to bring into your planning model as well as how to line up your actuals and plan data on a single row with the ability to compare and analyze both actuals and plan not only on a dollar-amount basis, but even more importantly by getting visibility into operational metrics for both actuals and plan data.

Recomendados
Recomendados
Mais conteúdo relacionado
Mais de Ben Lamorte
Mais de Ben Lamorte (11)
Último
Último (20)
Integrating Actuals Into Financial Plans
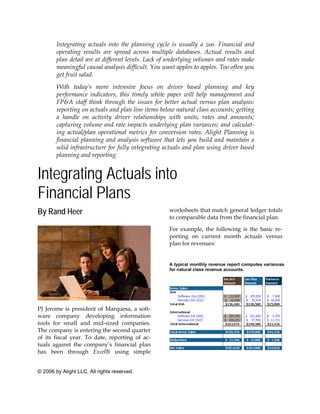
- 1. Integrating actuals into the planning cycle is usually a zoo. Financial and operating results are spread across multiple databases. Actual results and plan detail are at different levels. Lack of underlying volumes and rates make meaningful causal analysis difficult. You want apples to apples. Too often you get fruit salad. With today’s more intensive focus on driver based planning and key performance indicators, this timely white paper will help management and FP&A staff think through the issues for better actual versus plan analysis: reporting on actuals and plan line items below natural class accounts; getting a handle on activity driver relationships with units, rates and amounts; capturing volume and rate impacts underlying plan variances; and calculat- ing actual/plan operational metrics for conversion rates. Alight Planning is financial planning and analysis software that lets you build and maintain a solid infrastructure for fully integrating actuals and plan using driver based planning and reporting. Integrating Actuals into Financial Plans By Rand Heer worksheets that match general ledger totals to comparable data from the financial plan. For example, the following is the basic re- porting on current month actuals versus plan for revenues: A typical monthly revenue report computes variances for natural class revenue accounts. PJ Jerome is president of Marquesa, a soft- ware company developing information tools for small and mid-sized companies. The company is entering the second quarter of its fiscal year. To date, reporting of ac- tuals against the company’s financial plan has been through Excel® using simple © 2006 by Alight LLC. All rights reserved.
- 2. Integrating Actuals into Financial Plans A typical monthly expense report computes variances In fact, PJ usually cuts the process short for natural class expense accounts. herself. She knows she can continue asking questions, but at some time point, typically after two or three late nights by the FP&A staff and a lot of grumbling, she simply stops. Her choice is this: burn out her staff or go short on the information. She chooses the latter. The problems with integrating actuals PJ’s problem isn’t unique. Financial plan- ning staffs everywhere spend endless hours with databases, spreadsheets and other tools integrating actual and plan data for reporting and preparing rolling forecasts. Here are the problems: Financial and operating results are spread across multiple databases. Ver- satile Excel is typically the focal point for integration and reporting. Nonethe- less, managing imports to Excel and normalizing data structures consume major FP&A and IS resources and can even increase the risk of producing in- correct data. The monthly package also includes formats for comparable quarter-to-date, year-to-date Actual and plan detail are at different data and details from the CRM system for levels. Actuals financial data is readily unit sales by products by region. available from the GL at the natural class account level; lower level actuals What bothers PJ is that financial reporting detail is typically a one off research and analysis take too much time, results in project. By contrast, budgets and rolling too little analysis, does not provide mea- forecasts are usually developed with ningful insight into performance issues, and line items below the natural class ac- does not directly impact future forecasts. count level, e.g., Travel Asia Customers, The monthly operations review consumes Travel Conferences, etc. nearly two weeks including the time the finance staff spends preparing and present- ing the reports, going back to various data- bases and spreadsheets to answer follow-up questions from PJ and the management team, and adjusting the forecast based on their findings. Actual T&E is tracked at an account level, while the budget is developed at a detailed level. Page 2
- 3. Integrating Actuals into Financial Plans There is a lack of underlying activity Actual data has no impact on forecasts drivers. It‘s not just about the dollars. and plan. Once actual performance is un- Meaningful planning and analysis re- derstood, the forecast must be adjusted quires digging into the underlying driv- accordingly. Often there is no easy way to ers and rates that cause dollars to be incorporate the findings of the PJ’s analy- spent. For example, call center head- sis. For example, PJ realizes a delay in the count and salaries are substantially dri- new version of software has caused a ven by call levels. Too often the driver shortfall in sales the last couple of months. data for either or both actual and plan PJ expects the trend to continue until the are not available or too difficult to pull software is finally released in three together from disparate databases. months time. It’s not as easy as changing just one or two numbers. At the very least, Actual and plan structures get out of software sales, advanced upgrades, ser- sync. New products, cost centers and vices sales, cost of goods sold, discounts accounts are frequently added to the and commissions will all need to be recal- chart of accounts. Rolling forecasts re- culated and updated. sult in new line items being added to the planning application. Maintaining ac- What FP&A needs tual and plan structures to keep data in sync is the job that everyone hates and a What the financial planning and analysis staff resource sinkhole. It’s also the root of needs to do its job and answer questions is most data integrity issues—bad main- laid out in the statements below. These exam- tenance means bad numbers and in- ples include the essential components of a de- compatible comparisons. finitive integration of actuals with plan. This is what the FP&A staff needs: actual and plan below natural class accounts; underlying volume and rate detail for line items with reconciliation to the GL; variance analysis including volume/rate causal analysis; an easy way of incorporating actual data into the forecast and automated maintenance of everything. Page 3
- 4. Integrating Actuals into Financial Plans Actual and plan line items below natural units * price/cost = dollar amount class accounts How people think is how people should be 10 heads * $100 supplies per head able to plan. Invariably, that means plan- = $1,000 for supplies ning structures need to include the capabili- ty for any user to add line items below nat- Where underlying drivers are important to ural class accounts. Letting managers plan identify, an automatic planning structure below the account level encourages more should be available in the format: Units * detailed and relevant data, more meaning- Rate = Amount. Units and rate are the input ful and logical thinking, and capture of in- assumptions. formation that would otherwise be lost in For actuals, the driver formulation using non-linked spreadsheets or scratch notes. units and rates is often reversed. The same mentality should carry over to dollar amount / units = price or cost reporting of actuals. For the most important items, for example, detail of product sales $1,200 supplies actuals / 8 heads actual and headcount, actuals reports should be = $150 average supplies per head set up to capture the relevant line item de- tail from the CRM, personnel or other data- To provide comparable data for variance bases. For the financially sensitive items, the analysis, an actuals modeling structure GL alone should not drive the level of detail should be available in the format Amount / for planning or be the only source for ac- Units = Rate. Units and amount are typical- tuals reporting. ly the “inputs”; rate is the calculated value as, for example, calculating average selling price from units and amount. In summary, to give management and the FP&A staff complete flexibility, the plan- ning and reporting system should support: a) an optional underlying structure for units, rate and amount for any line item; Alight Planning supports plan and actual line items below revenue, expense and balance sheet accounts. b) linking any unit or rate to any other unit, rate or amount in the plan or ac- tuals reporting; Modeling for driver based planning and actual reporting c) calculating units, rate and amount in Every line item in a plan and each corres- any format—e.g. U * R = A; A / U = R; ponding actual financial result potentially and A / R = U; have an underlying relationship waiting to be modeled. The simplest expression of this d) independent linking and calculations for when planning is: actuals and plan—i.e. each one should be able to have a different formulation; Page 4
- 5. Integrating Actuals into Financial Plans The exciting result of planning and report- ing with units, rates and amounts (URA) is that traditional variance analysis and its benefits are now extended to operational ac- tivities as well as financial impacts. Funda- mental “rates” of the business—e.g. cus- tomer conversion rates, productivity rates, utilization rates, any type of activity meas- Alight Planning meets all criteria for driver based ure—all are revealed: in actuals as perfor- planning and reporting. Units, rate and amount are supported across the board. Any URA can be linked mance measures; in planning as key as- to any other URA anywhere in plan or actuals. sumptions that can be examined and ad- justed in light of actual results. Financial and operational variances In the example below, URA laid the The most fundamental FP&A activity is groundwork for getting a handle on such comparing actual and plan data and com- operational measures as Sales Per Head, puting the variance between them. The Sales Per Rep, Consulting Hours Utilization, payoff is the insights that the comparisons and Customer Acquisition Cost. give us—typically one of three stories: 1) What targets are we hitting and what are we missing, e.g., sales for specific products, headcount, spending items, capital utilization, etc. Variance analysis gives us information we can act upon to change behaviors and refocus current Alight Planning’s Key Measures interface lets you resources. view and change actual and plan financial data and activity metrics in one window. 2) What important assumptions underly- ing future plans are being proved or disproved from current experience—e.g. Causal variance analysis product mix, utilization rates, efficien- Perhaps the biggest benefit of planning and cies, etc. Variance analysis gives us in- reporting with URA is causal analysis, the formation we can use to tune forecasts mother of all variance analyses that is prac- and underlying strategies. ticed in many Fortune 500 companies. 3) What problems do we have in our ac- Causal analysis answers the generic ques- counting and/or planning systems that tion: how much of the total dollar variance are generating bad or false informa- amount is due to a variance in the underly- tion—e.g. CRM sales statistics not tying ing volumes versus a variance in the under- with the GL, expense budget errors and lying rate. The following are examples of omissions, etc. Further research on va- specific questions—including some PJ keeps riances often reveals system deficien- asking—that are answered only by causal cies. analysis. Page 5
- 6. Integrating Actuals into Financial Plans “The total variance in sales for Product A is “Consulting staff utilization is 65% versus plan $40,500. How much of that variance is be- of 80%. How much of this variance is due to a cause unit volume was higher or lower ver- difference in billable hours versus higher or low- sus a higher or lower selling price?” er consulting heads in the plan?” (This is a tougher one to think through.) “Headcount is up 10% over last month. What’s the financial impact of the headcount increase excluding salary adjustments?” (Hint: heads are the units; salaries are the rate.) Alight Planning includes “intelligent operator” columns which can be added to reports. A Causal operator column automatically computes the volume and rate variance for each line item. Shaded cells in the actual and plan columns are inputs, or in the case of actuals, imported values from other data sources. Non–shaded cells are either calculations or links to other line items. Note in the data columns: for plan the algorithm is U * R = A; for actuals it’s A / U = R. The power of causal analysis is demonstrat- With no effective causal analysis available, ed in the example above from Marquesa. the management at Marquesa would not be The total variance for the USA sales is an able to identify the financial impact of soft- unfavorable $2,013. Maybe not a big deal. ware license sales being down or that some- However, the devil is in the details: thing funny was happening in pricing, both important business issues. In fact, there are There is an unfavorable variance of material variances worth analyzing for $30,000 due to lower Software License nearly all of the USA line items. sales. The causal analysis formula for this volume variance is: (20 units actual The Marquesa example here demonstrates – 30 units plan) * $3,000 plan price. how causal analysis can be a huge tool for the FP&A staff whose main job is to explain There is an offsetting favorable variance what’s going on in the numbers. of $32,500 due to a higher actual price for Software Licenses. The causal analy- sis formula for this rate variance is: ($4,625 actual price - $3,000 plan price) * 20 actual units. Page 6
- 7. Integrating Actuals into Financial Plans The ability to leverage actuals Alight delivers a broad range of capa- bilities for importing actuals. Actuals Integrating actuals does not stop at under- may be imported from multiple dispa- standing actual performance. Once va- rate sources at any level of detail using riances in past months are understood, the any combination of underlying units, forecast must be updated and fine-tuned to rates and amounts. incorporate any new insights resulting from the analysis. Alight files incorporate planning and reporting. Whether a strategic plan, There must be an easy and intuitive way to budget or rolling forecast, the Alight incorporate the latest actual data and its plan file drives the reporting structure impact into the most current forecast. In the for defining line items, assumptions, Marquesa example, the shortfall in current and use of underlying units and rates. sales not only changes the current subscrib- As such, imported actuals data is forced er base, but may lead to a change in expec- to conform to an equivalent, comparable tations for future software, service and structure at the line item level within training sales as well as related expenses natural class accounts. This substantially such as cost of goods sold, commissions, etc. increases the level of meaningful analysis. Alight forecast and plan data can be driven from ac- Reconcile to the GL. Whether actuals tuals data by using either the “look back at actuals” or Spread features. data is available for a particular line item or not, Alight ensures integrity of the rollup to actual financials by auto- matically creating a system line item that literally plugs the difference be- tween the sum of actual line items and the imported GL account total. Shaded cells are input/imported fields including the account totals. In the example, Services Plug is a system line item that automatically reconciles the imported GL total for account 140. Actual and plan data share a common Alight provides true integration with structure. Both plan and actuals share actuals. the same common structure, i.e., line Reporting on and analyzing actuals is not a item name, rollup information, dimen- new or unique concept. Almost all products sionality, formats and notes. Each line will allow you to look at variances at a high item has an optional plan and actuals in- level. However, only Alight Planning allows terface for managing links, inputs and you to easily import, fully analyze and then other elements. leverage your actuals, all in one application. Page 7
- 8. Integrating Actuals into Financial Plans Alight supports unique actual and plan Alight Planning allows forecast and plan data to “look back at actuals” for data drivers. models by line item. Keeping actuals and plan data apples to apples for URA is facilitated by letting the user structure different URA links and data calcula- tions for each data type. For example, a plan line item may be structured U * R = A; the same line item for actuals may be calculated as R = A / U. Alight Planning allows unique modeling for actual data vs plan data by line item. In this example, Plan is U*R=A, Actual is R=A/U. Use actual data to jump start the plan or forecast. Alight allows the spreading of data from actual time periods to planned time periods using a variety of options. Using the Spread tool, you can spread a range of data, e.g., utilities for one line item or many, from actual to end of year with just a couple of clicks. In Alight, you can leverage actual data while using the Spread feature to modify any range of plan and actual input data. Rand Heer is President of Alight LLC and the Alight plans and forecasts make the creative force behind Alight Planning. He was a most of actuals data. Don’t stop once contributing author to “Business Intelligence: the variance analysis is completed. Making Better Decisions Faster” published by Alight provides the tools to leverage ac- Microsoft Press. He was also the founder of Pil- tual data when building a plan or forecast. lar Corporation and designer of Hyperion Pillar, Take advantage of Alight’s robust integra- the first enterprise software for budgets and fo- tion of actuals by creating models which recasting, and founder of FP&A Train, the orig- inal Essbase training company. “look back at actuals” for data drivers. For example, the subscriber base for fore- (800) 960-7717 casted periods can be linked to sales data www.AlightPlanning.com from actual periods or commissions can be Excel is a registered trademark of Microsoft Corporation in based on actual sales data. the United States and/or other countries. Page 8