Memorial demographic and income profile. (Houston TX).
•
0 gostou•398 visualizações

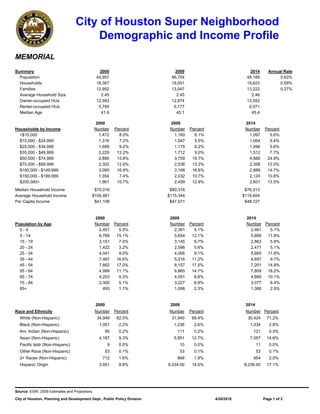
This document profiles demographic and income data for the Memorial super neighborhood in Houston from 2000 to 2014. It shows that the population grew slightly from 44,957 to 48,189 during this period. The median household income was highest in 2009 at $80,316 but fell to $76,313 by 2014. The percentage of the population that was non-Hispanic white declined from 82.5% in 2000 to 71.2% in 2014, while the Hispanic population increased from 8.8% to 17.1% over the same period.

Recomendados
Recomendados
Mais conteúdo relacionado
Destaque
Destaque (11)
Semelhante a Memorial demographic and income profile. (Houston TX).
Semelhante a Memorial demographic and income profile. (Houston TX). (20)
Mais de Champions Real Estate Group
Mais de Champions Real Estate Group (20)
Último
Último (20)
Memorial demographic and income profile. (Houston TX).
- 1. City of Houston Super Neighborhood Demographic and Income Profile MEMORIAL Summary 2000 2009 2014 Annual Rate Population 44,957 46,704 48,189 %0.63 Households 18,367 19,051 19,623 %0.59 Families 12,952 13,047 13,222 %0.27 Average Household Size 2.45 2.45 2.46 Owner-occupied HUs 12,583 12,874 13,552 Renter-occupied HUs 5,784 6,177 6,071 Median Age 41.6 45.1 45.4 2000 2009 2014 Households by Income Number Percent Number Percent Number Percent <$15,000 1,472 %8.0 1,160 %6.1 1,097 %5.6 $15,000 - $24,999 1,316 %7.2 1,047 %5.5 1,064 %5.4 $25,000 - $34,999 1,689 %9.2 1,175 %6.2 1,096 %5.6 $35,000 - $49,999 2,229 %12.2 1,712 %9.0 1,512 %7.7 $50,000 - $74,999 2,890 %15.8 3,759 %19.7 4,880 %24.9 $75,000 - $99,999 2,302 %12.6 2,536 %13.3 2,358 %12.0 $100,000 - $149,999 3,090 %16.9 3,168 %16.6 2,888 %14.7 $150,000 - $199,999 1,354 %7.4 2,032 %10.7 2,124 %10.8 $200,000+ 1,961 %10.7 2,459 %12.9 2,601 %13.3 Median Household Income $70,016 $80,316 $76,313 Average Household Income $100,461 $115,344 $119,604 Per Capita Income $41,106 $47,071 $48,727 2000 2009 2014 Population by Age Number Percent Number Percent Number Percent 0 - 4 2,451 %5.5 2,391 %5.1 2,461 %5.1 5 - 14 6,769 %15.1 5,654 %12.1 5,669 %11.8 15 - 19 3,151 %7.0 3,145 %6.7 2,863 %5.9 20 - 24 1,422 %3.2 2,596 %5.6 2,471 %5.1 25 - 34 4,041 %9.0 4,266 %9.1 5,665 %11.8 35 - 44 7,467 %16.6 5,216 %11.2 4,697 %9.7 45 - 54 7,662 %17.0 8,157 %17.5 7,201 %14.9 55 - 64 4,999 %11.1 6,865 %14.7 7,809 %16.2 65 - 74 4,203 %9.3 4,091 %8.8 4,885 %10.1 75 - 84 2,300 %5.1 3,227 %6.9 3,077 %6.4 85+ 493 %1.1 1,096 %2.3 1,389 %2.9 2000 2009 2014 Race and Ethnicity Number Percent Number Percent Number Percent White (Non-Hispanic) 34,949 %82.5 31,940 %68.4 30,424 %71.2 Black (Non-Hispanic) 1,001 %2.2 1,236 %2.6 1,334 %2.8 Am. Indian (Non-Hispanic) 95 %0.2 111 %0.2 121 %0.3 Asian (Non-Hispanic) 4,187 %9.3 5,951 %12.7 7,057 %14.6 Pacific Isldr (Non-Hispanic) 9 %0.0 10 %0.0 11 %0.0 Other Race (Non-Hispanic) 53 %0.1 53 %0.1 53 %0.1 2+ Races (Non-Hispanic) 712 %1.6 869 %1.9 954 %2.0 Hispanic Origin 3,951 %8.8 6,534.00 %14.0 8,236.00 %17.1 Source: ESRI, 2009 Estimates and Projections City of Houston, Planning and Development Dept., Public Policy Division 4/20/2010 Page 1 of 2
- 2. City of Houston Super Neighborhood Demographic and Income Profile MEMORIAL 2000 2009 Educational Attainment Number Percent Number Percent Less than 9th Grade 427 %1.4 462 %22.0 Some High School 982 %3.2 898 %22.0 High School Graduate 3,394 %11.0 3,987 %22.0 Some College 5,922 %19.1 5,717 %22.0 Associates Degree 1,250 %4.0 1,511 %22.0 Bachelors Degree 12,288 %39.7 13,088 %22.0 Graduate Degree 6,678 %21.6 7,256 %22.0 Employment (age 16+) 2000 2009 2014 Employed Civilian 20,355 19,498 20,932 Unemployed 741 1,534 1,071 Unemployment Rate %3.5 %7.3 %4.9 2009 Population by Age Age 0-4 Age 5-14 Age 15-19 Age 20-24 Age 25-34 Age 35-44 Age 45-54 Age 55-64 Age 65-74 Age 75-84 Age 85+ Age Percent 16 14 12 10 8 6 4 2 0 2014 Population by Age Age 0-4 Age 5-14 Age 15-19 Age 20-24 Age 25-34 Age 35-44 Age 45-54 Age 55-64 Age 65-74 Age 75-84 Age 85+ Age Percent 16 14 12 10 8 6 4 2 0 2009 Population by Race/Ethnicity Non-Hispanic White Non-Hispanic Black Non-Hispanic Am. Indian Non-Hispanic Asian Non-Hispanic Pac. Islndr. Non-Hispanic Other Race Non-Hispanic 2+ Races Hispanic Race/Ethnicity Percent 60 50 40 30 20 10 0 2009 Annual Average Household Income Less than $15K $15K - $25K $25K - $35K $35K - $50K $50K - $75K $75K - $100K $100K - $150K $150K - $200K $200K or More Household Income 18 16 14 12 10 8 6 4 2 0 Source: ESRI, 2009 Estimates and Projections City of Houston, Planning and Development Dept., Public Policy Division 4/20/2010 Page 2 of 2