Dati statistici mercato auto europa settembre 2012
•
0 gostou•552 visualizações

Dati statistici mercato auto europa settembre 2012

Recomendados
Recomendados
Mais conteúdo relacionado
Mais procurados
Mais procurados (17)
Destaque
Destaque (20)
Semelhante a Dati statistici mercato auto europa settembre 2012
Semelhante a Dati statistici mercato auto europa settembre 2012 (20)
Mais de Autoblog.it
Mais de Autoblog.it (20)
Último
Último (20)
Dati statistici mercato auto europa settembre 2012
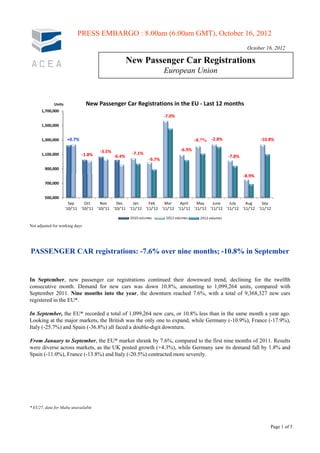
- 1. PRESS EMBARGO : 8.00am (6.00am GMT), October 16, 2012 October 16, 2012 New Passenger Car Registrations European Union E U i Units New Passenger Car Registrations in the EU ‐ Last 12 months 1,700,000 ‐7.0% 1,500,000 1,300,000 +0.7% -8.7% ‐2.8% ‐10.8% ‐3.5% ‐6.9% 1,100,000 ‐1.8% ‐7.1% ‐6.4% ‐7.8% ‐9.7% 900,000 ‐8.9% 700,000 500,000 Sep Oct Nov Dec Jan Feb Mar April May June July Aug Sep '10/'11 '10/'11 '10/'11 '10/'11 '11/'12 '11/'12 '11/'12 '11/'12 '11/'12 '11/'12 '11/'12 '11/'12 '11/'12 Series1 Series2 Not adjusted for working days PASSENGER CAR registrations: -7.6% over nine months; -10.8% in September In September ne passenger car registrations contin ed their do n ard trend declining for the t elfth September, new continued downward trend, twelfth consecutive month. Demand for new cars was down 10.8%, amounting to 1,099,264 units, compared with September 2011. Nine months into the year, the downturn reached 7.6%, with a total of 9,368,327 new cars registered in the EU*. In September, the EU* recorded a total of 1,099,264 new cars, or 10.8% less than in the same month a year ago. Looking at the major markets, the British was the only one to expand, while Germany (-10.9%), France (-17.9%), Italy (-25.7%) and Spain (-36.8%) all faced a double-digit downturn. From January to September, the EU* market shrank by 7.6%, compared to the first nine months of 2011. Results were diverse across markets, as the UK posted growth (+4.3%), while Germany saw its demand fall by 1.8% and Spain (-11.0%), France (-13.8%) and Italy (-20.5%) contracted more severely. * EU27, data for Malta unavailable Page 1 of 5
- 2. P r e s s R e l e a s e Association des PRESS EMBARGO FOR ALL DATA : Constructeurs 8.00 A.M.(6.00 A.M GMT), October 16, 2012 Européens d'Automobiles PROVISIONAL Av. des Nerviens 85 NEW PASSENGER CAR REGISTRATIONS BY MARKET B-1040 Bruxelles EUROPEAN UNION* Tel (32 2) 732 55 50 Fax (32 2) 738 73 10 (32 2) 738 73 11 16/10/12 September September % Chg Jan - Sep Jan - Sep % Chg '12 '11 12/11 '12 '11 12/11 AUSTRIA 27,094 30,755 -11.9 266,890 273,539 -2.4 BELGIUM 33,660 41,427 -18.7 386,733 440,546 -12.2 BULGARIA 1,347 1,718 -21.6 14,252 14,354 -0.7 CYPRUS 702 1,003 -30.0 8,892 11,026 -19.4 CZECH REPUBLIC 12,475 12,978 -3.9 131,059 127,485 +2.8 DENMARK 13,923 13,849 +0.5 128,493 127,230 +1.0 ESTONIA 1,442 1,417 +1.8 13,314 11,405 +16.7 FINLAND 7,994 10,111 -20.9 88,926 100,109 -11.2 FRANCE 137,536 167,526 -17.9 1,431,509 1,661,271 -13.8 GERMANY 250,082 280,689 -10.9 2,358,798 2,401,736 -1.8 GREECE 3,463 6,718 -48.5 45,535 79,231 -42.5 HUNGARY 3,521 3,500 +0.6 39,317 33,815 +16.3 IRELAND 2,487 2,767 -10.1 76,630 87,163 -12.1 ITALY 109,178 147,021 -25.7 1,090,627 1,371,117 -20.5 LATVIA 744 926 -19.7 7,995 7,777 +2.8 LITHUANIA 980 1,197 -18.1 9,190 9,956 -7.7 LUXEMBURG 3,340 3,466 3.6 -3.6 39,090 39,609 1.3 -1.3 NETHERLANDS 32,090 44,382 -27.7 428,191 453,882 -5.7 POLAND 18,885 21,136 -10.7 207,063 202,544 +2.2 PORTUGAL 6,358 9,205 -30.9 74,461 123,464 -39.7 ROMANIA 4,736 6,875 -31.1 49,128 55,881 -12.1 SLOVAKIA 7,329 4,998 +46.6 53,845 49,954 +7.8 SLOVENIA 3,203 4,523 -29.2 38,707 46,378 -16.5 SPAIN 35,146 55,572 -36.8 555,362 623,921 -11.0 SWEDEN 21,937 26,605 -17.5 203,711 227,636 -10.5 UNITED KINGDOM 359,612 332,476 +8.2 1,620,609 1,553,094 +4.3 EUROPEAN UNION (EU27)* 1,099,264 1,232,840 -10.8 9,368,327 10,134,123 -7.6 EU15 1,043,900 1,172,569 -11.0 8,795,565 9,563,548 -8.0 EU11* 55,364 60,271 -8.1 572,762 570,575 +0.4 ICELAND 470 283 +66.1 6,371 4,082 +56.1 NORWAY 11,134 11,737 -5.1 104,199 102,895 +1.3 SWITZERLAND 21,166 26,479 -20.1 245,526 232,738 +5.5 EFTA 32,770 38,499 -14.9 356,096 339,715 +4.8 EU27*+EFTA 1,132,034 1,271,339 -11.0 9,724,423 10,473,838 -7.2 EU15+EFTA 1,076,670 1,211,068 -11.1 9,151,661 9,903,263 -7.6 (*) data for Malta currently not available. For further information, please contact: Ms. Quynh-Nhu Huynh - Director Economics & Statistics - E-mail: qh@acea.be - Tel. (32) 2 738 73 55 New Passenger Car Registrations in September Results in the EU 2003 ‐ 2012 Units Percentage 1,500,000 +10.0 +6.5 1,400,000 +5.0 +2.1 ‐0.1 1,300,000 +0.7 +0.0 ‐1.5 ‐1.5 1,200,000 ‐5.0 ‐8.3 ‐9.9 1,100,000 ‐10.0 ‐10.8 1,000,000 ‐15.0 Sep‐03 Sep‐04 Sep‐05 Sep‐06 Sep‐07 Sep‐08 Sep‐09 Sep‐10 Sep‐11 Sep‐12 New Passenger Car Registrations New Passenger Car Registrations % change year on year % change year‐on‐year Next press release: Friday, November 16, 2012 This information is available on the ACEA website: http://www.acea.be Page 2 of 5
- 3. P r e s s R e l e a s e PROVISIONAL NEW PASSENGER CAR REGISTRATIONS BY MANUFACTURER EUROPEAN UNION (EU)* 16/10/12 September January - September %Share Units Units % Chg %Share Units Units % Chg '12 '11 '12 '11 12/11 '12 '11 '12 '11 12/11 ALL BRANDS** 1,099,264 1,232,840 -10.8 9,368,327 10,134,123 -7.6 VW Group 23.8 23.1 261,874 284,549 -8.0 24.7 23.1 2,311,410 2,339,391 -1.2 VOLKSWAGEN 11.9 12.3 130,983 151,994 -13.8 12.8 12.3 1,196,261 1,244,246 -3.9 AUDI 5.7 5.1 63,173 62,314 +1.4 5.6 5.0 526,402 502,361 +4.8 SEAT 2.0 2.1 21,489 25,787 -16.7 2.1 2.3 193,737 232,219 -16.6 SKODA 3.8 3.6 42,314 44,236 -4.3 3.8 3.5 359,462 359,019 +0.1 Others (1) 0.4 0.0 3,915 218 +1695.9 0.4 0.0 35,548 1,546 +2199.4 PSA Group 10.9 10.5 119,482 129,991 -8.1 12.0 12.7 1,120,538 1,287,370 -13.0 PEUGEOT 6.1 5.7 66,803 70,711 -5.5 6.5 6.9 604,935 700,654 -13.7 CITROEN 4.8 4.8 52,679 59,280 -11.1 5.5 5.8 515,603 586,716 -12.1 RENAULT Group 7.0 8.8 76,572 108,633 -29.5 8.4 9.5 790,324 960,864 -17.7 RENAULT 5.6 7.4 61,257 90,743 -32.5 6.6 7.7 615,075 780,983 -21.2 DACIA 1.4 1.5 15,315 17,890 -14.4 1.9 1.8 175,249 179,881 -2.6 GM Group 8.5 9.1 93,716 111,888 -16.2 8.3 8.8 779,235 890,717 -12.5 OPEL/VAUXHALL 7.5 7.9 82,035 97,227 -15.6 6.9 7.5 642,586 759,316 -15.4 CHEVROLET 1.1 1.2 11,665 14,623 -20.2 1.5 1.3 136,416 131,033 +4.1 GM (US) 0.0 0.0 16 38 -57.9 0.0 0.0 233 368 -36.7 FORD 8.2 8.6 90,363 106,180 -14.9 7.6 8.1 716,482 819,903 -12.6 FIAT Group 6.0 6.6 65,925 80,864 -18.5 6.5 7.3 609,264 736,306 -17.3 FIAT 4.5 4.8 49,498 58,562 -15.5 4.7 5.3 443,852 534,993 -17.0 LANCIA/CHRYSLER 0.7 0.7 7,372 8,951 -17.6 0.8 0.8 73,515 77,998 -5.7 ALFA ROMEO 0.6 0.9 6,767 10,487 -35.5 0.7 1.0 69,675 101,940 -31.7 JEEP 0.2 0.2 2,027 2,556 -20.7 0.2 0.2 19,209 16,344 +17.5 Others (2) 0.0 0.0 261 308 -15.3 0.0 0.0 3,013 5,031 -40.1 BMW Group 7.4 6.3 80,915 77,497 +4.4 6.2 5.8 579,097 591,865 -2.2 BMW 5.8 4.7 63,532 57,486 +10.5 4.9 4.6 463,055 469,306 -1.3 MINI 1.6 1.6 17,383 20,011 -13.1 1.2 1.2 116,042 122,559 -5.3 DAIMLER 5.4 5.2 59,125 63,492 -6.9 5.1 4.9 481,564 497,541 -3.2 MERCEDES 4.9 4.7 53,757 57,463 -6.4 4.6 4.3 428,411 437,480 -2.1 SMART 0.5 0.5 5,368 6,029 -11.0 0.6 0.6 53,153 60,061 -11.5 TOYOTA Group 4.5 4.0 49,712 49,313 +0.8 4.2 3.9 395,576 397,990 -0.6 TOYOTA 4.3 3.8 47,040 46,240 +1.7 4.0 3.7 375,180 379,155 -1.0 LEXUS 0.2 0.2 2,672 3,073 -13.0 0.2 0.2 20,396 18,835 +8.3 NISSAN 3.9 4.1 42,926 49,983 -14.1 3.5 3.4 328,265 348,104 -5.7 HYUNDAI 3.5 3.0 38,679 37,217 +3.9 3.4 2.9 317,393 290,462 +9.3 KIA 3.1 2.7 33,907 32,805 +3.4 2.7 2.1 250,892 209,025 +20.0 VOLVO CAR CORP. 1.7 1.8 18,777 22,736 -17.4 1.7 1.8 157,021 179,050 -12.3 SUZUKI 1.3 1.4 14,575 16,884 -13.7 1.2 1.3 115,020 129,149 -10.9 HONDA 1.7 1.4 18,569 17,596 +5.5 1.1 1.1 105,645 110,002 -4.0 JAGUAR LAND ROVER 1.5 1.2 16,080 14,207 +13.2 1.0 0.7 92,763 70,818 +31.0 LAND ROVER 1.1 0.8 12,292 9,998 +22.9 0.8 0.5 74,564 53,063 +40.5 JAGUAR 0.3 0.3 3,788 4,209 -10.0 0.2 0.2 18,199 17,755 +2.5 MAZDA 1.1 1.3 11,932 15,857 -24.8 1.0 1.0 92,412 106,166 -13.0 MITSUBISHI 0.5 0.7 5,386 8,459 -36.3 0.6 0.8 53,445 80,742 -33.8 OTHER** 0.1 0.4 749 4,689 -84.0 0.8 0.9 71,981 88,658 -18.8 (1) VW Group: VW 'other' include Bentley, Bugatti, Lamborghini, and since Aug '12 Porsche For further information, please contact: (2) FIAT Group: FIAT 'other' include Dodge, Ferrari, Maserati Ms. Quynh-Nhu Huynh - Director Economics & Statistics (*) data for Malta n.a. E-mail: qh@acea.be - Tel. (32) 2 738 73 55 (**) ACEA estimates Page 3 of 5
- 4. P r e s s R e l e a s e PROVISIONAL NEW PASSENGER CAR REGISTRATIONS BY MANUFACTURER EU* + EFTA Countries 16/10/12 September January - September %Share Units Units % Chg %Share Units Units % Chg '12 '11 '12 '11 12/11 '12 '11 '12 '11 12/11 ALL BRANDS** 1,132,034 1,271,339 -11.0 9,724,423 10,473,838 -7.2 VW Group 23.8 23.2 269,953 294,816 -8.4 24.8 23.2 2,411,087 2,427,899 -0.7 VOLKSWAGEN 11.9 12.4 134,690 157,075 -14.3 12.8 12.3 1,244,076 1,289,216 -3.5 AUDI 5.8 5.1 65,186 64,334 +1.3 5.6 5.0 549,425 521,393 +5.4 SEAT 1.9 2.1 21,862 26,417 -17.2 2.1 2.3 200,460 238,012 -15.8 SKODA 3.9 3.7 44,110 46,758 -5.7 3.9 3.6 379,307 377,578 +0.5 Others (1) 0.4 0.0 4,105 232 +1669.4 0.4 0.0 37,819 1,700 +2124.6 PSA Group 10.8 10.5 121,898 133,372 -8.6 11.8 12.6 1,147,092 1,316,671 -12.9 PEUGEOT 6.0 5.7 68,109 72,916 -6.6 6.4 6.9 619,435 717,589 -13.7 CITROEN 4.8 4.8 53,789 60,456 -11.0 5.4 5.7 527,657 599,082 -11.9 RENAULT Group 6.9 8.7 78,299 110,402 -29.1 8.3 9.3 807,132 978,753 -17.5 RENAULT 5.5 7.2 62,632 91,961 -31.9 6.5 7.6 627,855 794,578 -21.0 DACIA 1.4 1.5 15,667 18,441 -15.0 1.8 1.8 179,277 184,175 -2.7 GM Group 8.4 9.0 95,398 113,873 -16.2 8.2 8.7 797,112 909,181 -12.3 OPEL/VAUXHALL 7.4 7.8 83,428 98,825 -15.6 6.8 7.4 657,416 775,103 -15.2 CHEVROLET 1.1 1.2 11,954 14,996 -20.3 1.4 1.3 139,341 133,579 +4.3 GM (US) 0.0 0.0 16 52 -69.2 0.0 0.0 355 499 -28.9 FORD 8.2 8.6 92,603 108,849 -14.9 7.6 8.0 738,527 842,396 -12.3 FIAT Group 5.9 6.5 66,991 82,209 -18.5 6.4 7.2 623,791 749,920 -16.8 FIAT 4.4 44 4.7 47 50,137 50 137 59,312 59 312 -15.5 15 5 4.6 46 5.2 52 451,877 451 877 542,550 542 550 -16.7 16 7 LANCIA/CHRYSLER 0.7 0.7 7,428 9,037 -17.8 0.8 0.8 74,464 78,691 -5.4 ALFA ROMEO 0.6 0.8 6,941 10,786 -35.6 0.7 1.0 72,172 105,446 -31.6 JEEP 0.2 0.2 2,194 2,703 -18.8 0.2 0.2 21,233 17,423 +21.9 Others (2) 0.0 0.0 291 371 -21.6 0.0 0.1 4,045 5,810 -30.4 BMW Group 7.4 6.3 83,261 79,970 +4.1 6.2 5.9 602,020 612,948 -1.8 BMW 5.8 4.7 65,585 59,526 +10.2 5.0 4.6 482,092 486,405 -0.9 MINI 1.6 1.6 17,676 20,444 -13.5 1.2 1.2 119,928 126,543 -5.2 DAIMLER 5.4 5.1 60,803 65,099 -6.6 5.1 4.9 499,293 511,398 -2.4 MERCEDES 4.9 4.6 55,269 58,877 -6.1 4.6 4.3 444,721 449,614 -1.1 SMART 0.5 0.5 5,534 6,222 -11.1 0.6 0.6 54,572 61,784 -11.7 TOYOTA Group 4.6 4.1 52,412 51,930 +0.9 4.3 4.0 421,159 421,092 +0.0 TOYOTA 4.4 3.8 49,640 48,690 +2.0 4.1 3.8 399,522 401,112 -0.4 LEXUS 0.2 0.3 2,772 3,240 -14.4 0.2 0.2 21,637 19,980 +8.3 NISSAN 3.9 4.0 43,838 51,478 -14.8 3.5 3.4 339,009 357,513 -5.2 HYUNDAI 3.5 3.0 39,860 38,598 +3.3 3.4 2.9 331,093 301,965 +9.6 KIA 3.1 2.6 35,131 33,499 +4.9 2.7 2.0 257,760 213,898 +20.5 VOLVO CAR CORP. 1.8 1.9 20,300 24,480 -17.1 1.8 1.8 171,493 193,507 -11.4 SUZUKI 1.3 1.4 15,184 17,951 -15.4 1.3 1.3 121,899 137,368 -11.3 HONDA 1.7 1.5 19,045 18,489 +3.0 1.1 1.1 111,257 116,072 -4.1 MAZDA 1.1 1.3 12,523 16,455 -23.9 1.0 1.1 99,403 113,168 -12.2 JAGUAR LAND ROVER 1.4 1.1 16,367 14,463 +13.2 1.0 0.7 95,763 72,409 +32.3 LAND ROVER 1.1 0.8 12,554 10,166 +23.5 0.8 0.5 77,240 54,289 +42.3 JAGUAR 0.3 0.3 3,813 4,297 -11.3 0.2 0.2 18,523 18,120 +2.2 MITSUBISHI 0.5 0.7 6,012 9,375 -35.9 0.6 0.9 60,512 91,147 -33.6 OTHER** 0.2 0.5 2,156 6,031 -64.2 0.9 1.0 89,021 106,534 -16.4 (1) VW Group: VW 'other' include Bentley, Bugatti, Lamborghini, and since Aug '12 Porsche For further information, please contact: (2) FIAT Group: FIAT 'other' include Dodge, Ferrari, Maserati Ms. Quynh-Nhu Huynh - Director Economics & Statistics (*) data for Malta n.a. E-mail: qh@acea.be - Tel. (32) 2 738 73 55 (**) ACEA estimates Page 4 of 5
- 5. P r e s s R e l e a s e PROVISIONAL NEW PASSENGER CAR REGISTRATIONS BY MANUFACTURER WESTERN EUROPE (EU15 + EFTA Countries) 16/10/12 September January - September %Share Units Units % Chg %Share Units Units % Chg '12 '11 '12 '11 12/11 '12 '11 '12 '11 12/11 ALL BRANDS** 1,076,670 1,211,068 -11.1 9,151,661 9,903,263 -7.6 VW Group 23.5 22.8 252,655 275,538 -8.3 24.5 22.8 2,241,643 2,261,967 -0.9 VOLKSWAGEN 12.0 12.4 129,272 150,436 -14.1 13.0 12.5 1,190,033 1,235,628 -3.7 AUDI 5.9 5.2 63,694 63,186 +0.8 5.9 5.2 535,858 510,440 +5.0 SEAT 2.0 2.1 21,003 25,516 -17.7 2.1 2.3 193,181 228,182 -15.3 SKODA 3.2 3.0 34,708 36,171 -4.0 3.1 2.9 285,893 286,050 -0.1 Other(1) 0.4 0.0 3,978 229 +1637.1 0.4 0.0 36,678 1,667 +2100.2 PSA Group 10.9 10.6 117,708 128,780 -8.6 12.1 12.8 1,102,954 1,268,825 -13.1 PEUGEOT 6.1 5.8 65,703 70,466 -6.8 6.5 7.0 594,429 690,290 -13.9 CITROEN 4.8 4.8 52,005 58,314 -10.8 5.6 5.8 508,525 578,535 -12.1 GM Group 8.4 8.9 90,801 108,344 -16.2 8.2 8.7 748,755 857,434 -12.7 OPEL/VAUXHALL 7.5 7.8 80,449 94,998 -15.3 6.8 7.5 626,375 738,645 -15.2 CHEVROLET 1.0 1.1 10,337 13,295 -22.2 1.3 1.2 122,049 118,304 +3.2 GM (US) 0.0 0.0 15 51 -70.6 0.0 0.0 331 485 -31.8 RENAULT Group 6.7 8.5 71,722 102,441 -30.0 8.1 9.1 742,472 902,650 -17.7 RENAULT 5.5 7.3 59,655 88,179 -32.3 6.5 7.6 592,723 750,998 -21.1 DACIA 1.1 1.2 12,067 14,262 -15.4 1.6 1.5 149,749 151,652 -1.3 FORD 8.3 8.6 88,961 103,800 -14.3 7.6 8.1 698,769 798,059 -12.4 FIAT Group 6.0 6.6 64,700 79,861 -19.0 6.6 7.3 600,940 725,309 -17.1 FIAT 4.5 4.7 48,296 57,352 -15.8 4.7 5.3 433,682 521,629 -16.9 LANCIA/CHRYSLER 0.7 0.7 7,279 8,948 -18.7 0.8 0.8 73,122 78,024 -6.3 ALFA ROMEO 0.6 0.9 6,776 10,573 -35.9 0.8 1.0 70,160 103,304 -32.1 JEEP 0.2 0.2 2,042 2,618 -22.0 0.2 0.2 19,720 16,772 +17.6 Other (2) 0.0 0.0 307 370 -17.0 0.0 0.1 4,256 5,580 -23.7 BMW Group 7.6 6.5 81,533 78,293 +4.1 6.4 6.0 586,060 598,153 -2.0 BMW 5.9 4.8 63,980 58,023 +10.3 5.1 4.8 467,704 473,101 -1.1 MINI 1.6 1.7 17,553 20,270 -13.4 1.3 1.3 118,356 125,052 -5.4 DAIMLER 5.5 5.3 59,458 63,941 -7.0 5.3 5.1 488,856 500,662 -2.4 MERCEDES 5.0 4.8 53,939 57,737 -6.6 4.7 4.4 434,420 439,074 -1.1 SMART 0.5 0.5 5,519 6,204 -11.0 0.6 0.6 54,436 61,588 -11.6 TOYOTA Group 4.6 4.0 49,201 49,047 +0.3 4.3 4.0 389,771 392,518 -0.7 TOYOTA 4.3 3.8 46,552 45,929 +1.4 4.0 3.8 369,297 373,596 -1.2 LEXUS 0.2 0.3 2,649 3,118 -15.0 0.2 0.2 20,474 18,922 +8.2 NISSAN 3.9 4.0 41,838 48,859 -14.4 3.5 3.4 319,183 338,090 -5.6 HYUNDAI 3.4 2.9 36,333 35,672 +1.9 3.2 2.8 296,233 273,512 +8.3 KIA 2.9 2.4 31,640 29,629 +6.8 2.5 1.9 226,708 185,574 +22.2 VOLVO CAR CORP. 1.8 1.9 19,363 23,600 -18.0 1.8 1.9 163,865 185,397 -11.6 SUZUKI 1.3 1.4 13,850 16,452 -15.8 1.2 1.3 108,575 124,693 -12.9 HONDA 1.7 1.4 17,815 17,538 +1.6 1.1 1.1 100,682 105,702 -4.7 MAZDA 1.1 1.3 11,967 15,891 -24.7 1.0 1.1 94,027 107,682 -12.7 JAGUAR LAND ROV 1.5 1.2 16,157 14,325 +12.8 1.0 0.7 93,685 71,182 +31.6 LAND ROVER 1.2 0.8 12,385 10,053 +23.2 0.8 0.5 75,477 53,253 +41.7 JAGUAR 0.4 0.4 3,772 4,272 -11.7 0.2 0.2 18,208 17,929 +1.6 MITSUBISHI 0.5 0.7 5,475 8,572 -36.1 0.6 0.8 53,956 82,718 -34.8 OTHER** 0.5 0.9 5,493 10,485 -47.6 1.0 1.2 94,526 123,136 -23.2 (1) VW Group: VW 'other' include Bentley, Bugatti, Lamborghini, and since Aug '12 Porsche For further information, please contact: (2) FIAT Group: FIAT 'other' include Dodge, Ferrari, Maserati Ms. Quynh-Nhu Huynh - Director Economics & Statistics E-mail: qh@acea.be - Tel. (32) 2 738 73 55 (**) ACEA estimates Page 5 of 5