Mais conteúdo relacionado
Semelhante a De assignment-finalized-28112017 5 (20)
Mais de Arthur Wilson (20)
De assignment-finalized-28112017 5
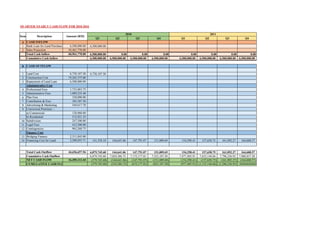
- 1. Q1 Q2 Q3 Q4 Q1 Q2 Q3 Q4
A
1 6,500,000.00
2
6,500,000.00 0.00 0.00 0.00 0.00 0.00 0.00 0.00
6,500,000.00 6,500,000.00 6,500,000.00 6,500,000.00 6,500,000.00 6,500,000.00 6,500,000.00 6,500,000.00
B
1 6,738,187.50
2
3
4
5
6
7
8
9
10
11
12
13
14 141,558.18 144,641.06 147,791.07 151,009.69 154,298.41 157,658.75 161,092.27 164,600.57
6,879,745.68 144,641.06 147,791.07 151,009.69 154,298.41 157,658.75 161,092.27 164,600.57
6,879,745.68 7,024,386.73 7,172,177.81 7,323,187.50 7,477,485.91 7,635,144.66 7,796,236.93 7,960,837.50
(379,745.68) (144,641.06) (147,791.07) (151,009.69) (154,298.41) (157,658.75) (161,092.27) (164,600.57)
(379,745.68) (524,386.73) (672,177.81) (823,187.50) (977,485.91) (1,135,144.66) (1,296,236.93) ###########
NET CASH FLOW 16,305,112.44
CUMULATIVE CASH FLOW
Total Cash Outflow 44,656,657.56
Cumulative Cash Outflow
Finance Cost
Bridging Finance 2,311,845.00
Financing Cost for Land 3,508,055.71
Subdivision 247,500.00
Legal Fees 412,500.00
Contingencies 963,268.75
Conversion Premium :-
a) Commercial 120,960.00
b) Residential 512,921.25
Plan Fees 330,000.00
Contribution & Fees 385,307.50
Advertising & Marketing 544,617.70
Administrative Cost
Professional Fees 1,733,883.75
Administrative Fees 1,089,235.40
Land Cost 6,738,187.50
Construction Cost 19,265,375.00
Repayment of Land Loan 6,500,000.00
Bank Loan for Land Purchase 6,500,000.00
Sales Projection 54,461,770.00
Total Cash Inflow 60,961,770.00
Cumulative Cash Inflow
CASH OUTFLOW
CASH INFLOW
QUARTER-YEARLY CASH FLOW FOR 2010-2016
Item Description Amount (RM)
2010 2011
- 2. A
1
2
B
1
2
3
4
5
6
7
8
9
10
11
12
13
14
NET CASH FLOW
CUMULATIVE CASH FLOW
Total Cash Outflow
Cumulative Cash Outflow
Finance Cost
Bridging Finance
Financing Cost for Land
Subdivision
Legal Fees
Contingencies
Conversion Premium :-
a) Commercial
b) Residential
Plan Fees
Contribution & Fees
Advertising & Marketing
Administrative Cost
Professional Fees
Administrative Fees
Land Cost
Construction Cost
Repayment of Land Loan
Bank Loan for Land Purchase
Sales Projection
Total Cash Inflow
Cumulative Cash Inflow
CASH OUTFLOW
CASH INFLOW
QUARTER-YEARLY CASH FLOW FOR 2010-2016
Item Description
Q1 Q2 Q3 Q4 Q1 Q2 Q3 Q4
2,024,082.50 1,877,477.25 3,722,402.75 7,492,467.07
0.00 0.00 0.00 0.00 2,024,082.50 1,877,477.25 3,722,402.75 7,492,467.07
6,500,000.00 6,500,000.00 6,500,000.00 6,500,000.00 8,524,082.50 10,401,559.75 14,123,962.50 21,616,429.57
1,759,012.50 1,759,012.50 1,902,605.36 3,503,067.41
1,040,330.25 346,776.75
136,154.43 136,154.43 136,154.43 136,154.43
330,000.00
385,307.50
68,077.21 68,077.21 68,077.21 68,077.21
120,960.00
512,921.25
247,500.00
412,500.00
120,408.59 120,408.59 120,408.59 120,408.59
288,980.63 288,980.63 288,980.63 288,980.63
168,185.27 171,848.04 175,590.58 179,414.62 183,321.94 187,314.36 191,393.73 195,561.93
168,185.27 171,848.04 175,590.58 179,414.62 5,605,474.30 2,559,947.72 2,707,619.94 4,659,026.95
8,129,022.77 8,300,870.81 8,476,461.38 8,655,876.00 14,261,350.30 16,821,298.02 19,528,917.96 24,187,944.91
(168,185.27) (171,848.04) (175,590.58) (179,414.62) (3,581,391.80) (682,470.47) 1,014,782.81 2,833,440.11
(1,629,022.77) (1,800,870.81) ########### (2,155,876.00) (5,737,267.80) (6,419,738.27) (5,404,955.46) (2,571,515.34)
20132012
- 3. A
1
2
B
1
2
3
4
5
6
7
8
9
10
11
12
13
14
NET CASH FLOW
CUMULATIVE CASH FLOW
Total Cash Outflow
Cumulative Cash Outflow
Finance Cost
Bridging Finance
Financing Cost for Land
Subdivision
Legal Fees
Contingencies
Conversion Premium :-
a) Commercial
b) Residential
Plan Fees
Contribution & Fees
Advertising & Marketing
Administrative Cost
Professional Fees
Administrative Fees
Land Cost
Construction Cost
Repayment of Land Loan
Bank Loan for Land Purchase
Sales Projection
Total Cash Inflow
Cumulative Cash Inflow
CASH OUTFLOW
CASH INFLOW
QUARTER-YEARLY CASH FLOW FOR 2010-2016
Item Description
Q1 Q2 Q3 Q4 Q1 Q2 Q3 Q4
6,899,409.84 7,759,218.93 4,670,045.03 5,720,452.01 11,573,126.13 1,361,544.25
6,899,409.84 7,759,218.93 4,670,045.03 5,720,452.01 11,573,126.13 0.00 1,361,544.25 0.00
28,515,839.41 36,275,058.34 40,945,103.37 46,665,555.38 58,238,681.50 58,238,681.50 59,600,225.75 59,600,225.75
2,737,238.84 1,999,331.10 1,905,596.88 1,898,616.67 1,319,259.38
6,500,000.00
346,776.75
136,154.43 136,154.43 136,154.43 136,154.43
68,077.21 68,077.21 68,077.21 68,077.21
120,408.59 120,408.59 120,408.59 120,408.59
288,980.63 288,980.63 288,980.63 288,980.63
199,820.92 204,172.65 208,619.16 213,162.51
3,550,680.61 2,817,124.61 2,727,836.89 9,572,176.78 1,319,259.38 0.00 0.00 0.00
27,738,625.52 30,555,750.13 33,283,587.03 42,855,763.81 44,175,023.18 44,175,023.18 44,175,023.18 44,175,023.18
3,348,729.23 4,942,094.31 1,942,208.14 (3,851,724.77) 10,253,866.75 0.00 1,361,544.25 0.00
777,213.89 5,719,308.20 7,661,516.34 3,809,791.57 14,063,658.32 14,063,658.32 15,425,202.57 15,425,202.57
2014 2015
- 4. A
1
2
B
1
2
3
4
5
6
7
8
9
10
11
12
13
14
NET CASH FLOW
CUMULATIVE CASH FLOW
Total Cash Outflow
Cumulative Cash Outflow
Finance Cost
Bridging Finance
Financing Cost for Land
Subdivision
Legal Fees
Contingencies
Conversion Premium :-
a) Commercial
b) Residential
Plan Fees
Contribution & Fees
Advertising & Marketing
Administrative Cost
Professional Fees
Administrative Fees
Land Cost
Construction Cost
Repayment of Land Loan
Bank Loan for Land Purchase
Sales Projection
Total Cash Inflow
Cumulative Cash Inflow
CASH OUTFLOW
CASH INFLOW
QUARTER-YEARLY CASH FLOW FOR 2010-2016
Item Description
Q1 Q2 Q3 Q4 Q1 Q2 Q3 Q4
1,361,544.25
0.00 0.00 0.00 0.00 1,361,544.25 0.00 0.00 0.00
59,600,225.75 59,600,225.75 59,600,225.75 59,600,225.75 60,961,770.00 60,961,770.00 60,961,770.00 60,961,770.00
481,634.38
0.00 0.00 481,634.38 0.00 0.00 0.00 0.00 0.00
44,175,023.18 44,175,023.18 44,656,657.56 44,656,657.56 44,656,657.56 44,656,657.56 44,656,657.56 44,656,657.56
0.00 0.00 (481,634.38) 0.00 1,361,544.25 0.00 0.00 0.00
15,425,202.57 15,425,202.57 14,943,568.19 14,943,568.19 16,305,112.44 16,305,112.44 16,305,112.44 16,305,112.44
2016 2017