Mais conteúdo relacionado
Semelhante a State Bridge Profile Georgia 2014 (11)
State Bridge Profile Georgia 2014
- 1. © 2015 The American Road & Transportation Builders Association (ARTBA). All rights reserved. No part of this document may be reproduced or
transmitted in any form or by any means, electronic, mechanical, photocopying, recording, or otherwise, without prior written permission of
ARTBA.
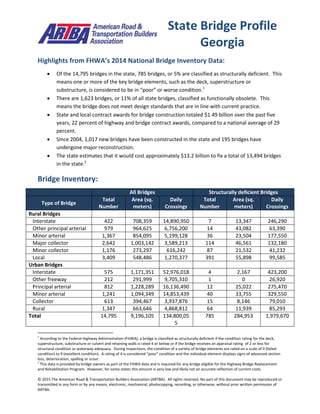
Highlights from FHWA’s 2014 National Bridge Inventory Data:
Of the 14,795 bridges in the state, 785 bridges, or 5% are classified as structurally deficient. This
means one or more of the key bridge elements, such as the deck, superstructure or
substructure, is considered to be in “poor” or worse condition.1
There are 1,623 bridges, or 11% of all state bridges, classified as functionally obsolete. This
means the bridge does not meet design standards that are in line with current practice.
State and local contract awards for bridge construction totaled $1.49 billion over the past five
years, 22 percent of highway and bridge contract awards, compared to a national average of 29
percent.
Since 2004, 1,017 new bridges have been constructed in the state and 195 bridges have
undergone major reconstruction.
The state estimates that it would cost approximately $13.2 billion to fix a total of 13,494 bridges
in the state.2
Bridge Inventory:
All Bridges Structurally deficient Bridges
Type of Bridge
Total
Number
Area (sq.
meters)
Daily
Crossings
Total
Number
Area (sq.
meters)
Daily
Crossings
Rural Bridges
Interstate 422 708,359 14,890,950 7 13,347 246,290
Other principal arterial 979 964,625 6,756,200 14 43,082 63,390
Minor arterial 1,367 854,095 5,199,128 36 23,504 177,550
Major collector 2,642 1,003,142 3,589,213 114 46,561 132,180
Minor collector 1,176 273,297 616,242 87 21,532 41,232
Local 3,409 548,486 1,270,377 391 55,898 99,585
Urban Bridges
Interstate 575 1,171,351 52,976,018 4 2,167 423,200
Other freeway 212 291,999 9,705,310 1 0 26,920
Principal arterial 812 1,228,289 16,136,490 12 25,022 275,470
Minor arterial 1,241 1,094,349 14,853,439 40 33,755 329,550
Collector 613 394,467 3,937,876 15 8,146 79,010
Rural 1,347 663,646 4,868,812 64 11,939 85,293
Total 14,795 9,196,105 134,800,055 785 284,953 1,979,670
1
According to the Federal Highway Administration (FHWA), a bridge is classified as structurally deficient if the condition rating for the deck,
superstructure, substructure or culvert and retaining walls is rated 4 or below or if the bridge receives an appraisal rating of 2 or less for
structural condition or waterway adequacy. During inspections, the condition of a variety of bridge elements are rated on a scale of 0 (failed
condition) to 9 (excellent condition). A rating of 4 is considered “poor” condition and the individual element displays signs of advanced section
loss, deterioration, spalling or scour.
2
This data is provided by bridge owners as part of the FHWA data and is required for any bridge eligible for the Highway Bridge Replacement
and Rehabilitation Program. However, for some states this amount is very low and likely not an accurate reflection of current costs.
State Bridge Profile
Georgia
- 2. © 2015 The American Road & Transportation Builders Association (ARTBA). All rights reserved. No part of this document may be reproduced or
transmitted in any form or by any means, electronic, mechanical, photocopying, recording, or otherwise, without prior written permission of
ARTBA.
Proposed bridge work:
Type of Work Number Cost (millions) Daily Crossings Area (sq. meters)
Bridge replacement 1,436 $979.5 4,099,132 500,586
Widening & rehabilitation 1,240 $1,259.6 8,206,080 742,492
Rehabilitation 12 $16.0 221,016 11,696
Deck rehabilitation/replacement 5 $5.0 49,378 4,966
Other work 10,801 $10,912.4 104,452,620 7,005,021
Top 10 Most Traveled Structurally Deficient Bridges in the State:
County
Year
Built
Daily
Crossings
Type of Bridge Location
Fulton 1966 137,730 Urban Interstate I-285 over South Utoy Creek
Cherokee 1976 105,710 Urban Interstate I-75 NB over Clark Creek
Cobb 1977 101,490 Urban Interstate I-75 NB over Clark Creek
Clayton 1959 78,270 Urban Interstate I-75 SB ramp to I-285 E over Mud Creek
Coweta 1969 62,330 Rural Interstate I-85 NB over Transco Gas Lines
Coweta 1969 62,330 Rural Interstate I-85 SB over Transco gas lines
Dooly 1960 41,740 Rural Interstate I-75 over Pennahatchee Creek
Newton 1964 40,200 Rural Interstate I-20 WB over the Alcovy River
Lowndes 1961 37,290 Rural Interstate I-75 over Bevel Creek
Bibb 1924 34,880
Urban other
principal arterial
US-41 SB and SR 49 over Rocky Creek
Sources: All data is from the 2014 National Bridge Inventory, released by the Federal Highway Administration in January 2015.
Note that specific conditions on bridge may have changed as a result of recent work. Cost estimates of bridge work provided as
part of the data and have been adjusted to 2014$ for inflation and estimated project costs. Contract awards data is for state
and local government awards and comes from McGraw Hill. Note that additional bridge investment may be a part of other
contract awards if a smaller bridge project is included with a highway project, and that would not be accounted for in the total
in this profile.