Mais conteúdo relacionado
Semelhante a ARTBA Labor Report May 2014 (16)
ARTBA Labor Report May 2014
- 1. © 2014 by the American Road & Transportation Builders Association (ARTBA). All rights reserved. No part of this document may be reproduced or
transmitted in any form or by any means, electronic, mechanical, photocopying, recording, or otherwise, without prior written permission of ARTBA.
1219 28
th
Street, N.W., Washington, D.C. 20007 • Tel: 202-289-4434 • Fax: 202-289-4435 • www.artba.org
Economics
&
Research
Mar-14 Mar-13 Gain/ Loss % Change
Highway, Street & Bridge Contractors - All
Employees 255.7 243.4 12.3 5.1%
Highway, Street & Bridge Contractors -
Production Workers 197.8 188.5 9.3 4.9%
Stone Mining & Quarrying 37.6 37.1 0.5 1.3%
Construction Sand & Gravel Mining 23.1 22.8 0.3 1.3%
Ready-Mix Concrete 76.4 77.5 -1.1 -1.4%
Construction Machinery 72.5 73.4 -0.9 -1.2%
Transportation Construction & Related Industry Employment
(in thousands)
285.2
252.5 236.5
236.0
246.7 243.4 255.7
0
50
100
150
200
250
300
350
400
2008 2009 2010 2011 2012 2013 2014
Highway, Street & Bridge Contractors Total Employment
- March (in thousands)
227.2
196.1
178.5 182.6 193.1 188.5
197.8
0
50
100
150
200
250
300
350
2008 2009 2010 2011 2012 2013 2014
Highway, Street & Bridge Production Worker
Employment - March (in thousands)
$21.05
$22.12 $22.47 $22.40
$23.35 $23.53 $23.63
$21.44
$22.49 $23.01 $23.38 $23.82 $24.11 $24.44
$16
$18
$20
$22
$24
$26
$28
$30
2008 2009 2010 2011 2012 2013 2014
Average February Hourly Wage of ProductionWorkers in Highway,
Street& Bridge Construction vs.All Construction
(not seasonally adjusted)
Highway, Street & Bridge Hourly Wage
Construction Average Hourly Wage
-15%
-10%
-5%
0%
5%
10%
|
2008 2009 2010 2011 2012 2013 2014
Annual Percent Change - Highway & Bridge Contractor
Employment - 2008 through YTD
Prepared by ARTBA: The Leading Source of U.S. Transportation Construction Market Research
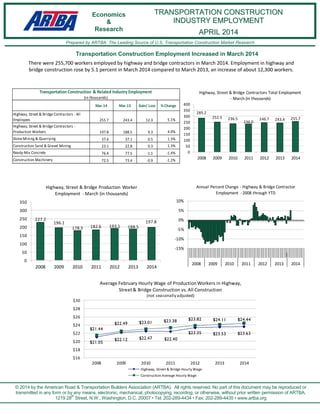
Transportation Construction Employment Increased in March 2014
There were 255,700 workers employed by highway and bridge contractors in March 2014. Employment in highway and
bridge construction rose by 5.1 percent in March 2014 compared to March 2013, an increase of about 12,300 workers.
TTRRAANNSSPPOORRTTAATTIIOONN CCOONNSSTTRRUUCCTTIIOONN
IINNDDUUSSTTRRYY EEMMPPLLOOYYMMEENNTT
AAPPRRIILL 22001144
- 2. © 2014 by the American Road & Transportation Builders Association (ARTBA). All rights reserved. No part of this document may be reproduced or
transmitted in any form or by any means, electronic, mechanical, photocopying, recording, or otherwise, without prior written permission of ARTBA.
1219 28
th
Street, N.W., Washington, D.C. 20007 • Tel: 202-289-4434 • Fax: 202-289-4435 • www.artba.org
Economics
&
Research
Mar-14 Mar-13 Gain/ Loss % Change
Highway, Street & Bridge Contractors, Avg.
Weekly Hours 41.8 41.4 0.4 1.0%
Construction Industry Production Workers,
Avg. Weekly Hours 39.1 39.3 -0.2 -0.5%
Highway, Street & Bridge Contractors, Avg.
Weekly Earnings $987.73 $974.14 $13.59 1.4%
Construction Industry Production Workers,
Avg. Weekly Earnings $955.60 $947.52 $8.08 0.9%
Average Weekly Earnings and Hours on the Job - Production Workers
Type of Contractor Mar-14 Mar-13 Gain/ Loss % Change
Residential Building 622.9 574.7 48.2 8.4%
Nonresidential Building 664.2 651.4 12.8 2.0%
Highway, Street & Bridge 255.7 243.4 12.3 5.1%
Utility System Construction 423.4 424.1 -0.7 -0.2%
Land Subdivision 42.9 40.0 2.9 7.3%
Other Heavy Construction 100.4 94.2 6.2 6.6%
Building Foundation & Exterior Contractors 673.4 657.4 16.0 2.4%
Building Equipment Contractors 1,742.0 1,694.5 47.5 2.8%
Building Finishing Contractors 639.2 633.2 6.0 0.9%
Other Specialty Trade Contractors 490.6 488.0 2.6 0.5%
Total Construction Industry 5,654.7 5,500.9 153.8 2.8%
Composition of Construction Industry Employment (in thousands)
Residential Building
11.0%
Nonresidential
Building
11.7%
Highway, Street&
Bridge
4.5%
UtilitySystem
Construction
7.5%
Land Subdivision
0.8%
Other Heavy
Construction
1.8%
Building
Foundation&
Exterior
Contractors
11.9%
BuildingEquipment
Contractors
30.8%
BuildingFinishing
Contractors
11.3%
Other Specialty
Trade Contractors
8.7%
Composition of Construction Industry Employment - March 2014
Source: U.S. Bureau of Labor Statistics
TTRRAANNSSPPOORRTTAATTIIOONN CCOONNSSTTRRUUCCTTIIOONN
IINNDDUUSSTTRRYY EEMMPPLLOOYYMMEENNTT
AAPPRRIILL 22001144