SlideShare uma empresa Scribd logo
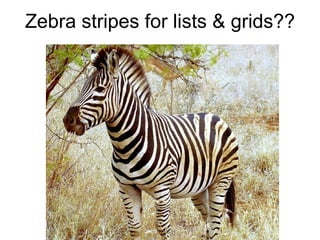
Zebra stripes for lists & grids??
To stripe or not to stripe? VS.
Uniformity  of data nature The data in the grid (or list) is  uniform  by its (data) nature. There is  no difference  between row 7 and row 22. The representation of the same information must be the same… Because otherwise there is a question: –  if all rows are equivalent – why to represent them in different ways?!
Non-uniformity  of data view The data representation in the grid (or list) is  not uniform   by visual design. There is  difference  between row 7 and row 22. The representation of the same information is not the same… And there is a question again: –  if all rows are equivalent – why to represent them in different ways?!
Conclusion.   Zebra is a problem! Fundamental nature & universe principle screwed up. It is like painting 50% of people clothes to one color and another 50% of people clothes to another color. Visualization contradicts with nature.
Solution.  Don’t paint! Simply, don’t paint presumably. Data shows itself. It is like not painting people clothes at all  , but let them wear what they like. Everybody shows her/him-self. No force, everybody shows up as they are.
Study by ‘A List Apart’ mag link ,[object Object],[object Object],[object Object],[object Object],[object Object],[object Object],link  to the tested table image
What if table visual design was better? Would study by ‘A List Apart’ mag give different numbers? link ,[object Object],[object Object],[object Object],[object Object],link  to the tested table image Zebra lovers might result to ~25% or less!
What other studies say? link  to E.Tufte board, with multiple ruminations and opinions. There are good arguments that zebra is for referees   with reference to ‘Envisioning Information’ book ( link  to Amazon) link  to zebras 
What to do with holes in the grid?
What to do with holes in the grid? Rework IxD. Because if grid has much white space then grid is a wrong way of information delivery in that case.
The End. Rethink the issue of mismatch between data nature and its view…and  stop zebra’ing  by selecting  right info delivery patterns!  May be not a grid.
Questions? Vasyl Mylko [email_address]

Mais conteúdo relacionado

Semelhante a To Zebra or Not To Zebra?

Spherule Diagrams: A Matrix-based Set Visualization Compared with Euler Diagrams
Spherule Diagrams: A Matrix-based Set Visualization Compared with Euler DiagramsSpherule Diagrams: A Matrix-based Set Visualization Compared with Euler Diagrams
Spherule Diagrams: A Matrix-based Set Visualization Compared with Euler DiagramsMithileysh Sathiyanarayanan
 
Visual Explanations with Graphs
Visual Explanations with GraphsVisual Explanations with Graphs
Visual Explanations with GraphsConnie Malamed
 
Design and Support Recommendations from Data Visualization Research
Design and Support Recommendations from Data Visualization ResearchDesign and Support Recommendations from Data Visualization Research
Design and Support Recommendations from Data Visualization ResearchAngela Zoss
 
Analyzing data notes
Analyzing data notesAnalyzing data notes
Analyzing data noteswellmaker786
 
Every graph tells a story
Every graph tells a story Every graph tells a story
Every graph tells a story dnalady1
 
Powerpoint
PowerpointPowerpoint
Powerpointfknights
 
Visualizations in Exploratory Data Analysis
Visualizations in Exploratory Data AnalysisVisualizations in Exploratory Data Analysis
Visualizations in Exploratory Data AnalysisOluwatobiAdefami
 

Semelhante a To Zebra or Not To Zebra? (9)

Spherule Diagrams: A Matrix-based Set Visualization Compared with Euler Diagrams
Spherule Diagrams: A Matrix-based Set Visualization Compared with Euler DiagramsSpherule Diagrams: A Matrix-based Set Visualization Compared with Euler Diagrams
Spherule Diagrams: A Matrix-based Set Visualization Compared with Euler Diagrams
 
Visual Explanations with Graphs
Visual Explanations with GraphsVisual Explanations with Graphs
Visual Explanations with Graphs
 
Tommy
TommyTommy
Tommy
 
GRAPH AND CHARTS
GRAPH AND CHARTSGRAPH AND CHARTS
GRAPH AND CHARTS
 
Design and Support Recommendations from Data Visualization Research
Design and Support Recommendations from Data Visualization ResearchDesign and Support Recommendations from Data Visualization Research
Design and Support Recommendations from Data Visualization Research
 
Analyzing data notes
Analyzing data notesAnalyzing data notes
Analyzing data notes
 
Every graph tells a story
Every graph tells a story Every graph tells a story
Every graph tells a story
 
Powerpoint
PowerpointPowerpoint
Powerpoint
 
Visualizations in Exploratory Data Analysis
Visualizations in Exploratory Data AnalysisVisualizations in Exploratory Data Analysis
Visualizations in Exploratory Data Analysis
 

Último

IESVE for Early Stage Design and Planning
IESVE for Early Stage Design and PlanningIESVE for Early Stage Design and Planning
IESVE for Early Stage Design and PlanningIES VE
 
Measures in SQL (a talk at SF Distributed Systems meetup, 2024-05-22)
Measures in SQL (a talk at SF Distributed Systems meetup, 2024-05-22)Measures in SQL (a talk at SF Distributed Systems meetup, 2024-05-22)
Measures in SQL (a talk at SF Distributed Systems meetup, 2024-05-22)Julian Hyde
 
Structuring Teams and Portfolios for Success
Structuring Teams and Portfolios for SuccessStructuring Teams and Portfolios for Success
Structuring Teams and Portfolios for SuccessUXDXConf
 
Slack (or Teams) Automation for Bonterra Impact Management (fka Social Soluti...
Slack (or Teams) Automation for Bonterra Impact Management (fka Social Soluti...Slack (or Teams) Automation for Bonterra Impact Management (fka Social Soluti...
Slack (or Teams) Automation for Bonterra Impact Management (fka Social Soluti...Jeffrey Haguewood
 
UiPath Test Automation using UiPath Test Suite series, part 2
UiPath Test Automation using UiPath Test Suite series, part 2UiPath Test Automation using UiPath Test Suite series, part 2
UiPath Test Automation using UiPath Test Suite series, part 2DianaGray10
 
Introduction to Open Source RAG and RAG Evaluation
Introduction to Open Source RAG and RAG EvaluationIntroduction to Open Source RAG and RAG Evaluation
Introduction to Open Source RAG and RAG EvaluationZilliz
 
Optimizing NoSQL Performance Through Observability
Optimizing NoSQL Performance Through ObservabilityOptimizing NoSQL Performance Through Observability
Optimizing NoSQL Performance Through ObservabilityScyllaDB
 
ECS 2024 Teams Premium - Pretty Secure
ECS 2024   Teams Premium - Pretty SecureECS 2024   Teams Premium - Pretty Secure
ECS 2024 Teams Premium - Pretty SecureFemke de Vroome
 
IOS-PENTESTING-BEGINNERS-PRACTICAL-GUIDE-.pptx
IOS-PENTESTING-BEGINNERS-PRACTICAL-GUIDE-.pptxIOS-PENTESTING-BEGINNERS-PRACTICAL-GUIDE-.pptx
IOS-PENTESTING-BEGINNERS-PRACTICAL-GUIDE-.pptxAbida Shariff
 
Custom Approval Process: A New Perspective, Pavel Hrbacek & Anindya Halder
Custom Approval Process: A New Perspective, Pavel Hrbacek & Anindya HalderCustom Approval Process: A New Perspective, Pavel Hrbacek & Anindya Halder
Custom Approval Process: A New Perspective, Pavel Hrbacek & Anindya HalderCzechDreamin
 
Demystifying gRPC in .Net by John Staveley
Demystifying gRPC in .Net by John StaveleyDemystifying gRPC in .Net by John Staveley
Demystifying gRPC in .Net by John StaveleyJohn Staveley
 
Speed Wins: From Kafka to APIs in Minutes
Speed Wins: From Kafka to APIs in MinutesSpeed Wins: From Kafka to APIs in Minutes
Speed Wins: From Kafka to APIs in Minutesconfluent
 
WSO2CONMay2024OpenSourceConferenceDebrief.pptx
WSO2CONMay2024OpenSourceConferenceDebrief.pptxWSO2CONMay2024OpenSourceConferenceDebrief.pptx
WSO2CONMay2024OpenSourceConferenceDebrief.pptxJennifer Lim
 
Behind the Scenes From the Manager's Chair: Decoding the Secrets of Successfu...
Behind the Scenes From the Manager's Chair: Decoding the Secrets of Successfu...Behind the Scenes From the Manager's Chair: Decoding the Secrets of Successfu...
Behind the Scenes From the Manager's Chair: Decoding the Secrets of Successfu...CzechDreamin
 
Unpacking Value Delivery - Agile Oxford Meetup - May 2024.pptx
Unpacking Value Delivery - Agile Oxford Meetup - May 2024.pptxUnpacking Value Delivery - Agile Oxford Meetup - May 2024.pptx
Unpacking Value Delivery - Agile Oxford Meetup - May 2024.pptxDavid Michel
 
Connecting the Dots in Product Design at KAYAK
Connecting the Dots in Product Design at KAYAKConnecting the Dots in Product Design at KAYAK
Connecting the Dots in Product Design at KAYAKUXDXConf
 
AI presentation and introduction - Retrieval Augmented Generation RAG 101
AI presentation and introduction - Retrieval Augmented Generation RAG 101AI presentation and introduction - Retrieval Augmented Generation RAG 101
AI presentation and introduction - Retrieval Augmented Generation RAG 101vincent683379
 
JMeter webinar - integration with InfluxDB and Grafana
JMeter webinar - integration with InfluxDB and GrafanaJMeter webinar - integration with InfluxDB and Grafana
JMeter webinar - integration with InfluxDB and GrafanaRTTS
 
Motion for AI: Creating Empathy in Technology
Motion for AI: Creating Empathy in TechnologyMotion for AI: Creating Empathy in Technology
Motion for AI: Creating Empathy in TechnologyUXDXConf
 
Future Visions: Predictions to Guide and Time Tech Innovation, Peter Udo Diehl
Future Visions: Predictions to Guide and Time Tech Innovation, Peter Udo DiehlFuture Visions: Predictions to Guide and Time Tech Innovation, Peter Udo Diehl
Future Visions: Predictions to Guide and Time Tech Innovation, Peter Udo DiehlPeter Udo Diehl
 

Último (20)

IESVE for Early Stage Design and Planning
IESVE for Early Stage Design and PlanningIESVE for Early Stage Design and Planning
IESVE for Early Stage Design and Planning
 
Measures in SQL (a talk at SF Distributed Systems meetup, 2024-05-22)
Measures in SQL (a talk at SF Distributed Systems meetup, 2024-05-22)Measures in SQL (a talk at SF Distributed Systems meetup, 2024-05-22)
Measures in SQL (a talk at SF Distributed Systems meetup, 2024-05-22)
 
Structuring Teams and Portfolios for Success
Structuring Teams and Portfolios for SuccessStructuring Teams and Portfolios for Success
Structuring Teams and Portfolios for Success
 
Slack (or Teams) Automation for Bonterra Impact Management (fka Social Soluti...
Slack (or Teams) Automation for Bonterra Impact Management (fka Social Soluti...Slack (or Teams) Automation for Bonterra Impact Management (fka Social Soluti...
Slack (or Teams) Automation for Bonterra Impact Management (fka Social Soluti...
 
UiPath Test Automation using UiPath Test Suite series, part 2
UiPath Test Automation using UiPath Test Suite series, part 2UiPath Test Automation using UiPath Test Suite series, part 2
UiPath Test Automation using UiPath Test Suite series, part 2
 
Introduction to Open Source RAG and RAG Evaluation
Introduction to Open Source RAG and RAG EvaluationIntroduction to Open Source RAG and RAG Evaluation
Introduction to Open Source RAG and RAG Evaluation
 
Optimizing NoSQL Performance Through Observability
Optimizing NoSQL Performance Through ObservabilityOptimizing NoSQL Performance Through Observability
Optimizing NoSQL Performance Through Observability
 
ECS 2024 Teams Premium - Pretty Secure
ECS 2024   Teams Premium - Pretty SecureECS 2024   Teams Premium - Pretty Secure
ECS 2024 Teams Premium - Pretty Secure
 
IOS-PENTESTING-BEGINNERS-PRACTICAL-GUIDE-.pptx
IOS-PENTESTING-BEGINNERS-PRACTICAL-GUIDE-.pptxIOS-PENTESTING-BEGINNERS-PRACTICAL-GUIDE-.pptx
IOS-PENTESTING-BEGINNERS-PRACTICAL-GUIDE-.pptx
 
Custom Approval Process: A New Perspective, Pavel Hrbacek & Anindya Halder
Custom Approval Process: A New Perspective, Pavel Hrbacek & Anindya HalderCustom Approval Process: A New Perspective, Pavel Hrbacek & Anindya Halder
Custom Approval Process: A New Perspective, Pavel Hrbacek & Anindya Halder
 
Demystifying gRPC in .Net by John Staveley
Demystifying gRPC in .Net by John StaveleyDemystifying gRPC in .Net by John Staveley
Demystifying gRPC in .Net by John Staveley
 
Speed Wins: From Kafka to APIs in Minutes
Speed Wins: From Kafka to APIs in MinutesSpeed Wins: From Kafka to APIs in Minutes
Speed Wins: From Kafka to APIs in Minutes
 
WSO2CONMay2024OpenSourceConferenceDebrief.pptx
WSO2CONMay2024OpenSourceConferenceDebrief.pptxWSO2CONMay2024OpenSourceConferenceDebrief.pptx
WSO2CONMay2024OpenSourceConferenceDebrief.pptx
 
Behind the Scenes From the Manager's Chair: Decoding the Secrets of Successfu...
Behind the Scenes From the Manager's Chair: Decoding the Secrets of Successfu...Behind the Scenes From the Manager's Chair: Decoding the Secrets of Successfu...
Behind the Scenes From the Manager's Chair: Decoding the Secrets of Successfu...
 
Unpacking Value Delivery - Agile Oxford Meetup - May 2024.pptx
Unpacking Value Delivery - Agile Oxford Meetup - May 2024.pptxUnpacking Value Delivery - Agile Oxford Meetup - May 2024.pptx
Unpacking Value Delivery - Agile Oxford Meetup - May 2024.pptx
 
Connecting the Dots in Product Design at KAYAK
Connecting the Dots in Product Design at KAYAKConnecting the Dots in Product Design at KAYAK
Connecting the Dots in Product Design at KAYAK
 
AI presentation and introduction - Retrieval Augmented Generation RAG 101
AI presentation and introduction - Retrieval Augmented Generation RAG 101AI presentation and introduction - Retrieval Augmented Generation RAG 101
AI presentation and introduction - Retrieval Augmented Generation RAG 101
 
JMeter webinar - integration with InfluxDB and Grafana
JMeter webinar - integration with InfluxDB and GrafanaJMeter webinar - integration with InfluxDB and Grafana
JMeter webinar - integration with InfluxDB and Grafana
 
Motion for AI: Creating Empathy in Technology
Motion for AI: Creating Empathy in TechnologyMotion for AI: Creating Empathy in Technology
Motion for AI: Creating Empathy in Technology
 
Future Visions: Predictions to Guide and Time Tech Innovation, Peter Udo Diehl
Future Visions: Predictions to Guide and Time Tech Innovation, Peter Udo DiehlFuture Visions: Predictions to Guide and Time Tech Innovation, Peter Udo Diehl
Future Visions: Predictions to Guide and Time Tech Innovation, Peter Udo Diehl
 

To Zebra or Not To Zebra?

  • 1. Zebra stripes for lists & grids??
  • 2. To stripe or not to stripe? VS.
  • 3. Uniformity of data nature The data in the grid (or list) is uniform by its (data) nature. There is no difference between row 7 and row 22. The representation of the same information must be the same… Because otherwise there is a question: – if all rows are equivalent – why to represent them in different ways?!
  • 4. Non-uniformity of data view The data representation in the grid (or list) is not uniform by visual design. There is difference between row 7 and row 22. The representation of the same information is not the same… And there is a question again: – if all rows are equivalent – why to represent them in different ways?!
  • 5. Conclusion. Zebra is a problem! Fundamental nature & universe principle screwed up. It is like painting 50% of people clothes to one color and another 50% of people clothes to another color. Visualization contradicts with nature.
  • 6. Solution. Don’t paint! Simply, don’t paint presumably. Data shows itself. It is like not painting people clothes at all  , but let them wear what they like. Everybody shows her/him-self. No force, everybody shows up as they are.
  • 7.
  • 8.
  • 9. What other studies say? link to E.Tufte board, with multiple ruminations and opinions. There are good arguments that zebra is for referees  with reference to ‘Envisioning Information’ book ( link to Amazon) link to zebras 
  • 10. What to do with holes in the grid?
  • 11. What to do with holes in the grid? Rework IxD. Because if grid has much white space then grid is a wrong way of information delivery in that case.
  • 12. The End. Rethink the issue of mismatch between data nature and its view…and stop zebra’ing by selecting right info delivery patterns! May be not a grid.
  • 13. Questions? Vasyl Mylko [email_address]