Minority Youth and Crime: Minority Youth in Court
Youth in general, and young minority males in particular, often are demonized by legislators, the media, scholars, and the public at large. These attacks reinforce stereotypes and place a particularly heavy burden on young Black and Latino males.
LINDA S. BERES AND THOMAS D. GRIFFITH, “DEMONIZING YOUTH”1
In June 2001 Lionel Tate, an African American boy who was 12 years old when he killed a 6-year-old family friend while demonstrating a wrestling move he had seen on television, was sentenced to life in prison without the possibility of parole. Tate, who claimed that the death was an accident, was tried as an adult in Broward County, Florida; he was convicted of first degree murder. One month later, Nathaniel Brazill, a 14-year-old African American, was sentenced by a Florida judge to 28 years in prison without the possibility of parole. Brazill was 13 years old when he shot and killed Barry Grunow, a popular 30-year-old seventh grade teacher at a middle school in Lake Worth, Florida. Although Brazill did not deny that he fired the shot that killed his teacher, he claimed that he had only meant to scare Grunow and that the shooting was an accident. Like Tate, Brazill was tried as an adult; he was convicted of second degree murder.
These two cases raised a storm of controversy regarding the prosecution of children as adults. Those on one side argue that children who commit adult crimes, such as murder, should be treated as adults; they should be prosecuted as adults and sentenced to adult correctional institutions. As Marc Shiner, the prosecutor in Brazill’s case, put it, “This was a heinous crime committed by a young man with a difficult personality who should be behind bars. Let us not forget a man’s life has been taken away.”2 Those on the other side contend that prosecuting children as adults is “unwarranted and misguided.” They assert that children who commit crimes of violence usually suffer from severe mental and emotional problems and that locking kids up in adult jails does not deter crime or rehabilitate juvenile offenders. Although they acknowledge that juvenile offenders should be punished for their actions, they claim that incarcerating them in adult prisons for the rest of their lives “is an outrage.”3 According to Vincent Schiraldi, president of the Justice Policy Institute, “In adult prisons, Brazill will never receive the treatment he needs to reform himself. Instead, he will spend his time trying to avoid being beaten, assaulted, or raped in a world where adults prey on, rather than protect, the young.”4
Nathaniel Brazill is still incarcerated in the Brevard Correctional Institution. Assuming that none of his pending appeals are successful, he will not be released until 2028, when he will be 41 years old.5 Lionel Tate’s conviction, on the other hand, was overturned by a Florida appellate court in 2003. The court ruled that Tate should be retried because his competency to stan ...
General Principles of Intellectual Property: Concepts of Intellectual Proper...
Minority Youth and Crime Minority Youth in CourtYouth in genera.docx
1. Minority Youth and Crime: Minority Youth in Court
Youth in general, and young minority males in particular, often
are demonized by legislators, the media, scholars, and the
public at large. These attacks reinforce stereotypes and place a
particularly heavy burden on young Black and Latino males.
LINDA S. BERES AND THOMAS D. GRIFFITH,
“DEMONIZING YOUTH”1
In June 2001 Lionel Tate, an African American boy who was 12
years old when he killed a 6-year-old family friend while
demonstrating a wrestling move he had seen on television, was
sentenced to life in prison without the possibility of parole.
Tate, who claimed that the death was an accident, was tried as
an adult in Broward County, Florida; he was convicted of first
degree murder. One month later, Nathaniel Brazill, a 14-year-
old African American, was sentenced by a Florida judge to 28
years in prison without the possibility of parole. Brazill was 13
years old when he shot and killed Barry Grunow, a popular 30-
year-old seventh grade teacher at a middle school in Lake
Worth, Florida. Although Brazill did not deny that he fired the
shot that killed his teacher, he claimed that he had only meant
to scare Grunow and that the shooting was an accident. Like
Tate, Brazill was tried as an adult; he was convicted of second
degree murder.
These two cases raised a storm of controversy regarding the
prosecution of children as adults. Those on one side argue that
children who commit adult crimes, such as murder, should be
treated as adults; they should be prosecuted as adults and
sentenced to adult correctional institutions. As Marc Shiner, the
prosecutor in Brazill’s case, put it, “This was a heinous crime
committed by a young man with a difficult personality who
should be behind bars. Let us not forget a man’s life has been
taken away.”2 Those on the other side contend that prosecuting
children as adults is “unwarranted and misguided.” They assert
that children who commit crimes of violence usually suffer from
2. severe mental and emotional problems and that locking kids up
in adult jails does not deter crime or rehabilitate juvenile
offenders. Although they acknowledge that juvenile offenders
should be punished for their actions, they claim that
incarcerating them in adult prisons for the rest of their lives “is
an outrage.”3 According to Vincent Schiraldi, president of the
Justice Policy Institute, “In adult prisons, Brazill will never
receive the treatment he needs to reform himself. Instead, he
will spend his time trying to avoid being beaten, assaulted, or
raped in a world where adults prey on, rather than protect, the
young.”4
Nathaniel Brazill is still incarcerated in the Brevard
Correctional Institution. Assuming that none of his pending
appeals are successful, he will not be released until 2028, when
he will be 41 years old.5 Lionel Tate’s conviction, on the other
hand, was overturned by a Florida appellate court in 2003. The
court ruled that Tate should be retried because his competency
to stand trial was not evaluated before he went to trial. The
state decided not to retry Tate and instead offered him a plea
agreement—Tate pled guilty to second degree murder in
exchange for a sentence to time served (which was about 3
years), plus 1 year of house arrest and 10 hours of probation.6
He was released from prison in January 2004. In May 2005 he
was back in jail in Fort Lauderdale, Florida, after he allegedly
robbed a pizza delivery man at gunpoint. Because he was on
probation at the time of the crime, Tate faced a potential life
sentence on the robbery charge.7 In 2006 he was sentenced to
30 years in prison on a gun possession charge and in 2008 he
was sentenced to 10 years in prison for the robbery.
Goals of the Chapter
The prosecution of children as adults, and the potential for
racial bias in the decision to “waive” youth to adult court, is
one of the issues we address in this chapter. We also discuss
racial/ethnic patterns in victimization of juveniles and in
offending by juveniles, the treatment of juveniles by the police,
and police use of gang databases. We end the chapter with a
3. discussion of the treatment of minority youth by the juvenile
justice system.
After you have read this chapter:
1. You will have explored the myths and realities about
victimization of and crime by minority youth.
2. You will have examined the relationship between the police
and racial and ethnic minority youth.
3. You will have reviewed recent research on racial disparities
in the juvenile justice system.
Young Racial Minorities as Victims and Offenders
Juveniles as Victims of Crime
In Chapter 2 we showed that, regardless of age, African
Americans have higher personal theft and violent victimization
rates than other racial / ethnic groups and that Hispanics
generally have higher victimization rates than non-Hispanics.
However, information concerning the racial and ethnic trends in
victimization for juveniles is scarce. In this section we examine
National Crime Victimization (NCVS) data, supplemented by
National Incident Based Reporting System (NIBRS) data and
Supplemental Homicide Reports (SHR) from the FBI. We first
discuss property victimization, followed by violent
victimization and homicide victimization.
Property Crime Victimization
Using information from the 1996 and 1997 NCVS, the Office of
Juvenile Justice and Delinquency Prevention released a brief on
“Juvenile Victims of Property Crime.”8 Their findings indicated
that one of every six juveniles (defined as youth aged 12 to 17)
had been the victim of property crime.9 This rate was 40
percent higher than the property crime victimization rate for
adults.10
Table 10.1 offers a comparison of juvenile and adult property
crime victimization rates for this time period by race and
ethnicity. A ratio of juvenile to adult rates higher than 1:1
indicates that the juvenile victimization rate is higher than the
adult rate. The ratio of 1:1.4 for whites, for example, indicates
that the property crime victimization rate for white juveniles is
4. higher than the property crime victimization rate for white
adults; moreover, as indicated by the asterisk, the difference in
the rates for adults and juveniles is statistically significant. This
pattern is found for all three racial categories. Hispanic
property crime victimization rates, however, do not vary
significantly between juveniles and adults, but non-Hispanic
rates do vary.
Table 10.1 Juvenile and Adult Property Victimization Rates by
Race and Ethnicity (1996 and 1997 Combined)
Property Crime Rate (Per 1,000 Population)
Property Crime Ratio (Juvenile/Adults)
Juvenile
Adult
Victim Race
White
162
114
1:1.4*
African American
194
151
1:1.3*
Other
155
108
5. 1:1.4*
Victim Ethnicity
Hispanic
143
133
1:1.1
Non-Hispanic
170
117
1:1.5*
*Juvenile rate divided by adult rate; significant difference at the
0.05 level or below.
SOURCE: Office of Juvenile Justice and Delinquency
Prevention, “Juvenile Victims of Property Crimes”
(Washington, DC: U.S. Department of Justice, 2000).
Looking at the victimization rates for juveniles only in Table
10.1, we see that African American youth have the highest
property crime victimization rate, followed by white youth, then
“other race” (American Indian / Alaska Native and Asian /
Pacific Islander) youth. With regard to ethnicity, non-Hispanic
juveniles report a higher rate of property crime victimization
than Hispanic juveniles. The racial pattern of property crime
victimization among juveniles, in other words, mirrors the
overall pattern for all ages combined (see Chapter 2); both
comparisons show the highest rates for African Americans. The
victimization rates of Hispanic and non-Hispanic juveniles
(higher rates for non-Hispanics), on the other hand, differ from
the rates for all age groups combined (higher rates for
Hispanics).11
The FBI also collects information about crime victims through
the NIBRS. These data do not represent the entire U.S.
6. population, but they do provide substantial information on the
victims of crime in the jurisdictions covered. Using this
information, researchers estimate that juveniles with the
following characteristics have a relatively high risk for property
crime victimization: “African American juveniles, juveniles in
urban areas, and juveniles in the West.”12 In short, these
victimization patterns closely mirror “the higher risk for adults
in these categories.”13
Violent Crime
In general, violent victimization rates are somewhat higher for
younger age groups than for older age groups. For example, in
2009 the violent victimization rate for youth from 12 to 15
years old was 36.8 victimizations for every 1,000 persons in
that age group, and the rate for youth 16 to 19 years old was
30.3 victimizations for every 1,000 persons in that age group. In
contrast, the rate for individuals who were 20 to 24 years old
was 28.1 per 1,000, and the rate for those who were 25 to 34
years old was 21.5 per 1,000. The rates for simple assault were
25.9 for those who were 12 to 15, 19.3 for those who were 16 to
19, 16.3 for those who were 20 to 24, and 13.4 for those who
were 25 to 34.14
The most recent data on violent victimization by age, race, and
gender are for 2007. These data reveal that the overall violent
victimization rate, which in years past was higher for African
Americans than for whites, is now very similar for these two
groups. For example, in 2000 the violent victimization rates for
youth ages 12 to 15 were 66.7 for African Americans and 58.7
for whites; in 2007 the rates were 46.1 for African Americans
and 42.1 for whites.15 Thus, the victimization rates for both
groups declined from 2000 to 2007, but the rate for African
Americans fell more sharply than did the rate for whites.
Data on violent victimization rates broken down by age, race,
and gender reveal that young African American males have a
greater likelihood than other offenders of being victims of
robbery but that the rates for overall violence are very similar
for young African American males and for offenders other than
7. white females.16 These data reveal that in 2007 the violent
victimization rate for youth between the ages of 12 and 15 was
46.1 for African American males, 47.9 for white males, 46.2 for
African American females, and 36.1 for white females. For
violent crime in general, then, the rates for African American
males, African American females, and white males differed by
less than two percentage points. In contrast, the robbery
victimization rate for African American males (9.1) was
considerably larger than the rate for white males (5.4) and was
more than 10 times the rate for white females (0.9) and African
American females (0.0).
A 2003 report by the Bureau of Justice Statistics revealed that
African American and Hispanic youth were more likely than
white youth to be victims of crimes committed with weapons.17
This was true for crimes committed with any weapon and for
crimes committed with a firearm, and it was true for youth
between the ages of 12 and 14 as well as youth between the ages
of 15 and 17. Among the 15- to 17-year-olds, for example, the
rate of violent victimizations with a firearm for white youth was
only half the rate for Hispanic youth; the rate for African
American youth was even higher than the rate for Hispanic
youth.
The question, of course, is why African American and Hispanic
youth are more likely than whites to be the victims of violent
crime. To answer this question, Janet L. Lauritsen used 1995
data from the National Crime Victimization Survey to explore
the effects of individual, family, and community characteristics
on the risk for nonlethal violence among youth.18 She
disaggregated violent incidents into incidents perpetrated by
strangers and those perpetrated by non-strangers, and she
distinguished incidents that occurred in the youth’s own
neighborhood from those that occurred elsewhere. She found
that youth living in single-parent families had higher risks for
violence than those living in two-parent families, and that the
risk for violence was much higher for youth living in the most
disadvantaged communities.19
8. According to Lauritsen, “because family and community
characteristics vary among racial and ethnic groups in the
United States, it is important to consider differences in
victimization risk across racial and ethnic groups.”20 As shown
in Table 10.2, when she examined the risk for violence by race
and gender, she found that young males faced a substantially
higher risk of violence than young females; this was true for
both stranger and non-stranger violence and for all violence as
well as violence that took place in the youth’s own
neighborhood. She also found that,
Table 10.2 Risk for Stranger and Non-Stranger Violence for
African American, Hispanic, and White Youth
Stranger Violence
Non-Stranger Violence
All Violence
Neighborhood Violence
All Violence
Neighborhood Violence
Males
34.9
20.2
25.0
14.4
African American
35.8
27.1
25.5
17.1
Hispanic
43.4
10. equal risks of non-stranger violence, but young white males had
a lower risk of victimization for stranger violence in their own
neighborhoods than African American and Hispanic young
males; and
· African American girls faced much higher risks of non-
stranger violence than either Hispanic or white girls, and both
African American girls and Hispanic girls were more likely than
white girls to be victimized by a stranger in their neighborhoods
(see also Box 10.1, which discusses in more detail the
victimization of young African American girls).
To determine whether these patterns could be explained by
other factors, Lauritsen used analytical techniques that
simultaneously controlled for individual, family, and
community characteristics. She found that the amount of time
the youth spent at home and the length of time the youth had
lived in his/her current home had a negative effect on risk of
violent victimization, and that youths who lived in single-parent
families faced a greater risk than those who lived in two-parent
families. She also found that youth who lived in communities
with higher percentages of female-headed families and higher
percentages of residents under the age of 18 had higher
likelihoods of violent victimization.21
The most interesting finding from this analysis was that the
racial and ethnic differences in risk for violent victimization
disappeared when the characteristics of the youth’s family and
community were taken into account. The racial and ethnic
differences discussed earlier, in other words, “are primarily a
reflection of community and family differences rather than the
result of being part of a particular racial or ethnic group.”22
Thus, African American and Hispanic youth have greater risks
for violent victimization than white youth because they are
more likely than white youth to spend time away from home, to
live in single-parent families, to have less-stable living
arrangements, and to live in disadvantaged communities. As
Lauritsen noted, “the sources of risk are similar for all
adolescents, regardless of their race or ethnicity.”23
11. Box 10.1. Victimization of Young African American Girls
In Getting Played: African American Girls, Urban Inequality,
and Gendered Violence, Jody Miller examines the victimization
experiences of African American girls living in disadvantaged
neighborhoods in St. Louis, Missouri. She uses in-depth
interviews with young African American women and men to
investigate “the social contexts in which violence against young
women in disadvantaged communities emerges, with an
emphasis on the situations that produce and shape such
events.”24
Miller focuses on young girls’ victimization experiences in their
neighborhoods, their schools, and their relationships. Noting
that most of the youth interviewed for her study lived in
extremely disadvantaged neighborhoods in which drug dealing,
street gangs, and violence were commonplace, Miller
demonstrates that young girls faced particular risks in these
male-dominated neighborhoods. They witnessed violence
against other women that occurred in public view, were
subjected to sexual come-ons by young men and sexual
harassment by adult men, and faced an ongoing risk of sexual
assault and sexual coercion. In response to these dangers, girls
adopted gendered risk-avoidance strategies: they avoided public
places, especially at night, and they relied on others, especially
male relatives and friends, for protection. They also criticized
girls who engaged in risky behavior or wore provocative
clothing, arguing that doing so heightened girls’ risk of
victimization. According to Miller, “the public nature of
violence against women ... created a heightened vigilance and
awareness among girls of their own vulnerability, but it also
resulted in coping strategies that included victim-blaming as a
means of psychologically distancing themselves from such
events.”25
Miller also discusses sexual harassment of girls at school,
noting that a majority of the girls she interviewed reported
experiencing inappropriate sexual comments or being grabbed
or touched in ways that made them feel uncomfortable. She
12. stated that these types of harassment were “an everyday feature
of the cultural milieu at school” and were not taken seriously by
school personnel.26 Miller also notes that the girls who were
subjected to this type of treatment had a limited arsenal of
effective responses. Avoidance was not an option in schools
where youths were constantly in contact with one another and
standing up for oneself carried significant risks. As she put it,
“Their attempts to defend themselves were read by young men
as disrespect, and the incidents quickly escalated into hostile
confrontations when young women challenged young men’s
sexual and gender entitlements. Thus, young women were in a
lose-lose situation.”27
One of the most troubling findings of Miller’s study is the high
rate of sexual violence experienced by the girls. She found that
half of the girls, whose mean age was only 16, had experienced
some form of sexual coercion or sexual assault and that a third
reported multiple experiences with sexual victimization. In
contrast, the boys who were interviewed did not see their
behaviors as sexual violence but as persuasion. Miller notes that
much of the sexual violence, including gang rape, took place at
unsupervised parties, where drugs and alcohol were readily
available. As she explained, “Such social contexts not only
made young women more vulnerable to sexual mistreatment but
also enhanced the likelihood that girls would be viewed as
either willing participants or deserving victims.”28
Miller concludes that her research “points to the clear need to
address violence against girls in disadvantaged communities in
a systematic fashion.”29 Although she acknowledges that “there
are no simple answers or easy solutions,” she nonetheless
suggests that the problem can be ameliorated by “remedies that
attend to the root causes of urban disadvantage” and by
“improving institutional support for challenging gender
inequalities and strengthening young women’s efficacy.”30 She
recommends that policy makers consider ways to make
disadvantaged neighborhoods safer, that police adopt
community policing strategies designed to engender trust and
13. confidence in the police, that school personnel take a more
proactive approach to addressing sexual harassment, and that
community service agencies develop ways of providing stable
adult role models and mentors for youth at risk.
Homicide Victimization
In 2005, 1 in every 10 murder victims was under the age of 18;
4.9 percent of the victims were under age 14, and 5.1 percent
were between 14 and 17.31 Although homicide events are fairly
rare (16,397 in 2005), racial patterns and trends by age are
available. The Supplemental Homicide Reports (SHR) collected
by the FBI indicate there are important racial patterns to be
found in homicide trends. As discussed in Chapter 2, African
Americans generally are overrepresented both as homicide
victims and offenders. Although the highest homicide rates
regardless of race and age are found among 18- to 24-year-olds,
youth between the ages of 14 and 17 have rates that are similar
to those for the 25-and-older age group.32
The homicide victimization rates for 14- to 17-year-olds, which
are presented in Table 10.3, indicate that homicide rates
declined dramatically from 1990 to 2005. For each of the four
groups—white males, white females, African American males,
and African American females—the rates peaked in 1995,
declined substantially by 2000, and remained relatively steady
from 2000 to 2005. Aside from the changes over time, the most
startling finding revealed by the data presented in Table 10.3
concerns the differences in homicide victimization rates by
race. Regardless of gender, African American juveniles have
substantially higher victimization rates than white juveniles.
Throughout the time period, the rate for African American
females was approximately four times greater than the rate for
white females, and the rate for African American males was six
to seven times greater than the rate for white males. In fact until
2005 the homicide victimization rates for African American
females were higher than the rates for white males.
Table 10.3 Juvenile Homicide Victimization Rates (per 100,000
population, ages 14–17) by Race and Gender
14. 1990
1995
2000
2005
White male
7.5
8.6
4.1
4.4
White female
2.5
2.7
1.4
1.1
African American male
59.0
63.2
25.8
26.4
African American female
10.3
11.9
4.5
4.0
SOURCE: James Allen Fox and Marianne W. Zawitz, Homicide
Trends in the United States, (Washington, DC: U.S. Department
of Justice, 2010). Available at:
http://bjs.ojp.usdoj.gov/content/homicide/homtrnd.cfm.
It thus seems clear that African American youth are
overrepresented as crime victims in the United States. African
American juveniles have the highest property crime
victimization rates of any group, and African American males
and females are substantially more likely than white males and
females to be homicide victims. As the study conducted by
Lauritsen revealed, these racial and ethnic differences can be
15. attributed primarily to race / ethnicity–linked differences and
the characteristics of the families and the communities in which
the youth live.
Juveniles as Offenders
Creating a profile of the juvenile offender is not an easy task.
Much of the available data relies on arrest statistics and/or the
perceptions of crime victims. Some critics argue that the
portrait of the offender based on these data is biased (because of
racial differences in reporting and racial bias in decisions to
arrest) and suggest that the picture of the typical offender
should be taken from a population of adjudicated offenders. We
discuss this alternative picture of the juvenile offender in the
section on juveniles in the correctional system, which appears
later in this chapter.
Juvenile Arrests
Table 10.4 presents UCR arrest data for persons under the age
of 18. The racial differences in these arrest statistics are similar
to those for offenders in all age groups. The overrepresentation
of African American youth for violent crimes is notable. In
2009 African Americans made up 51.2 percent of all arrests of
youth for violent Index Crimes. Among young offenders
arrested for homicide and robbery, African Americans
constituted 58.0 percent and 67.3 percent, respectively, of all
arrestees. African American juveniles also were overrepresented
among arrests for serious property (Part 1 / Index) crimes, but
the proportions are smaller than for violent crime (33.2 percent
for serious property crime versus 51.2 percent for violent
crime).
Table 10.4 Percent Distribution of Arrests by Race, under 18
Years of Age, 2009
% White
% African American
% American Indian
% Asian
Total
20. Vagrancy
71.5
27.3
0.4
0.7
All other offenses (except traffic)
69.2
28.0
1.1
1.8
Suspicion
42.3
57.1
0.0
0.6
Curfew and loitering law violations
60.8
37.1
1.0
1.2
Runaways
66.6
26.7
2.2
5.4
SOURCE: Sourcebook of Criminal Justice Statistics, Table
4.10. Available at:
http://www.albany.edu/sourcebook/pdf/t4102009.pdf.
Native American youth make up less than 1 percent of the
juvenile population; they were slightly overrepresented in
juvenile arrest figures for Index offenses (1.2 percent of all
arrestees), especially motor vehicle theft (1.5 percent of all
arrestees). Asian / Pacific Islander youth, who make up less
than 3 percent of the U.S. population, were not overrepresented
for any Part 1 / Index offenses.
The data presented in Table 10.4 reveal more variability in the
21. race of juveniles arrested for the less serious Part 2 offenses.
White juveniles were overrepresented for driving under the
influence, liquor law violations, and drunkenness; they
represented about 90 percent of arrestees in each category.
African Americans made up fewer than 9 percent of juveniles
arrested for these offenses. A similar pattern is found for
vandalism, where the racial makeup of arrestees is consistent
with the racial makeup of the general population. African
American juveniles were overrepresented among arrestees for a
number of these less serious offenses, including gambling (92.7
percent), prostitution (58.4 percent), offenses involving stolen
property (43.6 percent), disorderly conduct (41.4 percent), other
assaults (39.2 percent), weapons offenses (33.2 percent), fraud
(36.0 percent), embezzlement (33.3 percent), and drug abuse
violations (25.6 percent).
Native American / American Indian youth were overrepresented
for three of the liquor-related Part 2 offenses: DUI, liquor law
violations, and drunkenness. They made up 3.1 percent of all
arrests for liquor law violations, 1.8 percent of all arrests for
driving under the influence, and 1.9 percent of all arrests for
drunkenness. Asian / Pacific Islander youth were
overrepresented only for the status offense of running away and
were significantly underrepresented for offenses such as liquor
and drug abuse violations.
Self-Reported Violent Behavior
Data on juvenile offending also comes from surveys in which
youth are asked to self-report delinquent acts. The National
Longitudinal Survey of Adolescent Health, for example,
gathered data from students attending 132 schools throughout
the United States.33 Youth between the ages of 11 and 20 were
asked to indicate the number of times in the past 12 months they
engaged in four types of serious violent behavior: getting into a
serious fight, hurting someone badly enough to need bandages
or care from a doctor or nurse, pulling a knife or gun on
someone, and shooting or stabbing someone.
Thomas McNulty and Paul E. Bellair used these data to examine
22. racial and ethnic differences in violent behavior. As shown in
Table 10.5, there were significant differences between white
adolescents and each of the four other groups on the first two
items. Asians were less likely than whites to have been in a
serious fight or to have injured someone else; African
Americans, Hispanics, and Native Americans, on the other hand,
were more likely than whites to have engaged in these types of
violent behavior. Asians also were less likely than whites to
have pulled a knife or gun on someone else, but African
Americans and Hispanics were more likely than whites to have
pulled a gun or knife on someone or to have shot or stabbed
another person.34 McNulty and Bellair used these data to create
a serious violence scale, which focused on the breadth of
violent activity (that is, whether the respondent engaged in the
activity or not). The scale ranged from zero (respondent had not
engaged in any of the types of violent behavior) to four
(respondent had engaged in all four types of violence).35 They
found that Native American adolescents were the most likely to
have engaged in violent behavior (mean = .66), followed by
Hispanics (.45), African Americans (.43), whites (.30), and
Asians (.17). Overall, then, there were large and statistically
significant differences between white youth and youth in each
of the other four groups. Asians were less likely than whites to
have engaged in violent behavior; Native Americans, Hispanics,
and African Americans were more likely than whites to have
participated in violence.
Table 10.5 Self-Reported Violent Behavior, by Race and
Ethnicity: Mean Percent Who Reported Engaging in Each Type
of Violence
Serious Fighting
Caused Injury
Pulled Knife or Gun
Shot or Stabbed
Serious Violence Scale
Asian
24. offending among eighth-grade students in 11 cities throughout
the United States.36 Dana Peterson and her co-authors used
self-report data to examine the prevalence of violent offending
and, for active offenders, their levels of offending (that is, the
average number of offenses committed by offenders who
reported engaging in the behavior). When they examined annual
prevalence rates (that is, the percentage of youth who reported
engaging in the behavior during the previous 12 months), they
found that African American youth were more likely than White
or Asian youth to have engaged in serious violence but that the
percentages of African American, Hispanic, and Native
American youth who reported involvement in serious violence
were very similar (32 percent for African Americans, 30 percent
for Hispanics, and 35 percent for Native Americans). Moreover,
the authors also found that there were “no statistically
significant race differences in levels of offending once
offending begins.”37
Peterson and her colleagues concluded that the results of their
study “call into question the extent to which violent juvenile
offending can be characterized as a minority male problem.”38
These researchers did find that males and racial minorities were
overrepresented among violent offenders, but the differences
were not as great as arrest data from the Uniform Crime Reports
would suggest. As they put it, “Although there may be a ‘racial
gap’ in terms of self-reported violence prevalence, no racial gap
appears in frequency of violent offending among active
offenders.”39
Homicide Offenders
Data on homicide offenders reveal that offending peaks at
around age 18, that males are overrepresented as offenders, that
roughly 50 percent of all homicides are committed by offenders
known to the victim (non-strangers), and that the victim and the
offender come from the same age group and racial category. The
Supplemental Homicide Reports (SHR) collected by the FBI can
be used to calculate approximate rates of homicide offending by
age, race, and gender. We consider these approximate rates
25. because the data come from reports filled out by police agencies
investigating homicides, rather than from convicted offenders.
As a consequence, these data may reflect a number of biases and
should be viewed with caution.
The SHR data indicate that offending rates vary by age group
and that the pattern is similar to that found for victimization
rates: the 18-to-24-year-old group has the highest offending
rate, followed by the 14-to-17-year-old group, with those 25 and
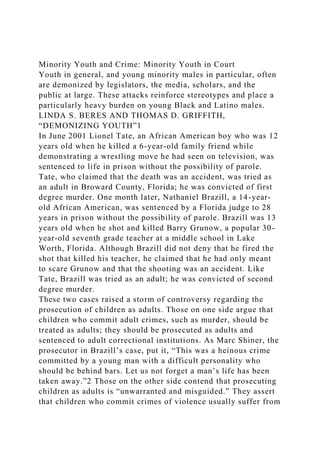
older having the lowest offending rates.40 Figure 10.1 displays
homicide offending rates from 1980 to 2005 for white males,
white females, African American males, and African American
females aged 14 to 17.41 Two trends are apparent. First, over
time, the homicide offending rate for African American males
has been substantially higher than the rates for the other three
groups. In 2005, for example, the rate for young African
American males (64.1) was 8 times the rate for young white
males (7.9), 16 times the rate for young African American
females (4.0), and more than 60 times the rate for young white
females (0.7). The second trend revealed by the data is that the
homicide offending rates for each group peaked in either 1990
or 1995 and declined dramatically after 1995. The rate for
African American males, for example, was 194.0 in 1990, 178.6
in 1995, 63.2 in 2000, and 64.1 in 2005. For white males the
rates fell from 22.0 (1990 and 1995) to 7.9 (2005).
Figure 10.1 Homicide Offending Rates for Youth age 14 to 17
by Race and Gender
SOURCE: James Allen Fox and Marianne W. Zawitz, Homicide
Trends in the United States, (Washington, DC: U.S. Department
of Justice, 2010). Available at:
http://bjs.ojp.usdoj.gov/content/homicide/homtrnd.cfm.
The intraracial pattern identified in Chapter 2 for all
homicides—that is, most homicides involve victims and
offenders of the same race—is found for juvenile homicides as
well. However, interracial homicides are more common among
young perpetrators.42
26. Explaining Racial and Ethnic Differences in Violent Behavior
The data discussed thus far reveal that there are racial and
ethnic differences in violent behavior among juveniles. Data on
homicide indicate that African American males have the highest
offending rate and self-report data on other types of violence
reveal that Asians and whites have lower rates of offending than
Native Americans, Hispanics, and African Americans.
Researchers have advanced a number of explanations for these
racial and ethnic differences. Although a detailed discussion of
these explanations is beyond the scope of this book, they
generally focus on the effects of community social
disorganization,43 individual and family level risk factors,44
weakened family attachments and weak bonds to school and
work,45 and involvement with delinquent peers and gangs.46
Most studies focus on either individual/family influences or
community level risk factors such as social disorganization.
There are very few studies that examine the causes of violent
crime across these levels of analysis.
An exception to this is the recent study by McNulty and Bellair
(discussed earlier); this study found that Asians were
significantly less likely than whites to engage in serious violent
behavior and that Native Americans, Hispanics, and African
Americans were more likely than whites to report they had
committed violent acts.47 To explain these differences,
McNulty and Bellair controlled for individual factors (for
example, gender, age, use of alcohol/drugs, easy access to a
gun, and prior violent behavior), family characteristics (for
example, type of family structure, parents’ education and
income), social bonds indicators (for example, family
attachment, school bonding, grades in school), involvement in
gangs, exposure to violence, and community characteristics (for
example, social disorganization and residential stability). They
found that the racial/ethnic differences in violent behavior
disappeared when they included these explanatory factors in a
single model. As they noted, “statistical differences between
whites and minority groups are explained by variation in
27. community disadvantage (for blacks), involvement in gangs (for
Hispanics), social bonds (for Native Americans), and situational
variables (for Asians).”48
The authors of this study concluded that their results had
important implications for implementing policies designed to
reduce youth violence. They noted, however, that “the
implementation of social programs is unlikely to alter
contemporary patterns of racial and ethnic group involvement in
violent behavior without amelioration of the fundamental social
and economic inequalities faced by minority group members.”49
Similar results were found by Paula J. Fite, Porche Wynn, and
Dustin A. Pardini,50 who used data from the Pittsburgh youth
survey to examine discrepancies in violent arrest rates between
African American and white male juveniles. They found that
38.4 percent of the African American boys, but only 24.6
percent of the white boys, were arrested for a violent offense as
juveniles. They also found, however, that race was significantly
correlated with 10 of the 14 risk factors they were examining,
including conduct problems, low academic achievement, family
socioeconomic status, poor parent-child communication, peer
delinquency, neighborhood disadvantage and neighborhood
problems.
The authors used statistical techniques that allowed them to
determine whether these risk factors could explain the
relationship between race and likelihood of arrest as a juvenile.
As they noted, “If race is no longer a significant predictor of
arrests after the inclusion of the risk factors in the model, then
it suggests that race only indirectly affects arrest through its
relation with one or more risk factors in the model.”51 In fact,
their results were consistent with this: once the risk factors
were added to the model, race was no longer a predictor of
arrest for a violent crime.
Further analysis revealed that several of the risk factors had a
significant effect on the likelihood of a violence-related arrest.
The odds of arrest were higher for youth with conduct problems,
low academic achievement, problems in communicating with
28. parents, delinquent peers, and neighborhood problems. These
five risk factors accounted for 70 percent of the relationship
between race and arrest for a violent offense.52
In terms of policy implications, the authors of this study
concluded that interventions designed to reduce juvenile arrests
should focus on young boys exhibiting early signs of conduct
problems such as fighting, stealing, and vandalizing property.
Noting that low academic achievement also was associated with
an increased risk of arrest, they suggested that “programs
designed for children exhibiting co-occurring conduct disorder
symptoms and academic problems will likely have the greatest
impact on disproportionate minority arrest rates.”53
Box 10.2. Race, Crime, and the Media
In a 2001 review of over 70 studies focusing on crime in the
news, Lori Dorfman and Vincent Schiraldi, of the Berkeley
Media Studies Group, asked the following questions: Does news
coverage reflect actual crime trends? How does news coverage
depict minority crime? Does news coverage disproportionately
depict youth of color as perpetrators of crime?54
The authors of the report concluded that “the studies taken
together indicate that depictions of crime in the news are not
reflective of the rate of crime generally, the proportion of crime
that is violent, the proportion of crime committed by people of
color, or the proportion of crime that is committed by youth.
The problem is not the inaccuracy of individual stories, but the
cumulative choices of what is included in the news—or not
included—presents the public with a false picture of higher
frequency and severity of crime than is actually the case.”55
Dorfman and Schiraldi noted that although crime dropped 20
percent from 1990 to 1998, crime news coverage increased by
over 80 percent.56 Moreover, 75 percent of the studies found
that minorities were overrepresented as perpetrators;57 over 80
percent of the studies found that more attention was paid to
white victims than to minority victims.58 The authors
concluded that the studies revealed that a “misinformation
synergy” occurs in the way crime news is presented in the
29. media.59 The result is a message that crime is constantly on the
increase, the offenders are young, minority males, and their
victims are white.
Juveniles of Color and the Police
The racial/ethnic patterns found in data on arrests of juveniles
raise questions about the general pattern of relations between
the police and juveniles. We discussed this subject in Chapter 4.
It is useful to review the major points here.
First, juveniles have a high level of contact with the police, and
juveniles of color have particularly high rates of contact.
Several factors explain this pattern. Most importantly, young
people tend to be out on the street more than adults. This is
simply a matter of lifestyle related to the life cycle. Low-
income juveniles are even more likely to be out in public than
middle-class youth. Middle-class and wealthy people have more
opportunities for indoor recreation: family rooms, large back
yards, and so on. A study of juvenile gangs in the 1960s found
that gang members regarded the street corner as, in effect, their
private space.60 At the same time, juveniles are more likely to
be criminal offenders than middle-age people. Criminal activity
peaks between ages 14 and 24. For this reason, the police are
likely to pay closer attention to juveniles—and to stop and
question them on the street—than to older people (for further
discussion of this, see Focus on An Issue: The Use of Gang
Databases).
Second, in large part because of the higher levels of contact,
juveniles consistently have less favorable attitudes toward the
police. Age and race, in fact, are the two most important
determinants of public attitudes, with both young people and
African Americans having the most negative view of the police.
As Chapter 4 explains, the attitudes of Hispanics are less
favorable than non-Hispanic whites but not as negative as those
of African Americans. When age and race are combined, the
result is that young African Americans have the most negative
attitudes toward the police.61
Attitudes—and behavior that reflects negative attitudes—can
30. have a significant impact on arrest rates. In his pioneering study
of arrest patterns, Donald Black found that the demeanor of the
suspect was one of the important determinants of officers’
decision to make an arrest. With other factors held constant,
individuals who are less respectful or more hostile are more
likely to be arrested. Black then found that African Americans
were more likely to be less respectful of the police, and
consequently were more likely to be arrested. Thus the general
state of poor relations leads to hostility in individual encounters
with the police, which in turn results in higher arrest rates.62
A study published in 2003 used data from the National Incident-
Based Reporting System (NIBRS) to assess whether the
likelihood of arrest varied by the race of the juvenile in
incidents involving murder, a violent sex offense, robbery,
aggravated assault, simple assault, or intimidation.63 (These
incidents were selected because they were the ones in which
there was interaction between the offender and the victim, and
victims were asked to describe the characteristics of the
offender.) Carl E. Pope and Howard N. Snyder found that white
juveniles were significantly more likely than African American
juveniles to be arrested: whites made up 69.2 percent of all
juvenile offenders (based on victim’s perceptions) but 72.7
percent of all juvenile offenders who were arrested. The results
of a multivariate analysis that controlled for other incident
characteristics (for example, the number of victims; the age,
sex, and race of the victim; the relationship between the victim
and the offender; and the offender’s sex) revealed that the
likelihood of arrest did not vary for white and nonwhite
juveniles. This was true for each state and for each of the types
of offenses examined. According to Pope and Snyder, “Overall,
the NIBRS data offer no evidence to support the hypothesis that
police are more likely to arrest nonwhite juvenile offenders than
white juvenile offenders, once other incident attributes are
taken into consideration.”64
Focus on an Issue: The Use of Gang Databases
In the late 1980s California became the first state to create a
31. computerized database of suspected gang members. Originally
known as GREAT (Gang Reporting, Evaluation, and Trafficking
System), by 2000 CalGang contained the names of over 300,000
suspected gang members. In fact the CalGang database included
more names than there were students in the University of
California system.65
As concerns about youth violence mounted during the early
1990s, other jurisdictions followed California’s example. Laws
authorizing law enforcement agencies to compile databases of
gang members were enacted in Colorado, Florida, Illinois,
Georgia, Tennessee, Texas, Minnesota, Ohio, and Virginia. The
FBI also maintains a database, the Violent Gang and Terrorist
Organization File, which became operational in 1995.66
The criteria for inclusion in a gang database—which typically
includes information about the individual (name, address,
physical description and/or photograph, tattoos, gang moniker),
the gang (type and racial makeup), and a record of all police
encounters with the individual—are vague. The Texas statute,
for example, states that an individual can be included in the
gang database if two or more of the following conditions are
met: (1) self-admission by the individual of criminal street gang
membership; (2) an identification of the individual as a criminal
street gang member by an informant or other individual of
unknown reliability; (3) a corroborated identification of the
individual by an informant or other individual of unknown
reliability; (4) evidence that the individual frequents a
documented area of a criminal street gang, associates with
known criminal street gang members, and uses criminal street
gang dress, hand signals, tattoos, or symbols; or (5) evidence
that the individual has been arrested or taken into custody with
known criminal street gang members for an offense or conduct
consistent with criminal street gang activity.67 Critics of the
use of gang databases point to the third criterion, which allows
entry of “associates” of gang members without evidence of
actual gang membership, as especially problematic. According
to a former California attorney general, the CalGang database
32. mixes “verified criminal history and gang affiliations with
unverified intelligence and hearsay evidence, including reports
on persons who have committed no crime.”68
Other critics suggest that the gang databases, which are racially
neutral on their face, are racially biased. One observer, for
example, stated that “it’s not a crackdown on gangs; it’s a
crackdown on blacks.”69 Statistics on the composition of gang
databases confirm this. In 1997 in Orange County, California,
for example, Hispanics, who made up only 27 percent of the
county population, made up 74 percent of the youth in the
database; in fact 93 percent of those included in the database
were people of color. In 1993 African Americans made up 5
percent of Denver’s population but 47 percent of those in the
gang database; Hispanics made up 12 percent of the population
but 33 percent of the gang database.70 In Schaumburg, Illinois
(a suburb of Chicago), African Americans made up 3.7 percent
of the village’s population but 22 percent of gang members in
the database.71
Gang database supporters counter that these statistics simply
reflect the composition of criminal street gangs. The fact that
most of the individuals whose names appear on gang databases
are African American, Hispanic, and Asian, in other words, is
due not to racially discriminatory policing but to the fact that
most of those who belong to street gangs are racial minorities.
Critics, however, maintain that the vagueness of the criteria for
inclusion in the database, coupled with accounts by youth of
color of repeated stops and frequent questions about gang
membership and the extremely high percentages of African
Americans and Hispanics in gang data-bases in cities like Los
Angeles and Denver, “support claims that the number of racial
minorities who are not gang members but are included in the
database is disproportionate.”72
The Use of Gang Databases: Police Harassment and Sentence
Enhancements
Critics’ concerns about racial and ethnic disparities in gang
databases focus on the potential for police harassment, as well
33. as the fact that in many states inclusion in a gang database may
result in harsher sentences. Two incidents in California
illustrate the potential for police harassment. The first took
place in Garden Grove. In 1993, three Asian teens were stopped
by Garden Grove police officers at a strip mall that the officers
claimed was frequented by gang members. The officers
questioned the youths, took down information on them that was
later entered into the gang database, and took photographs of
them without their permission.73 The second incident took
place in Union City. In 2002 Union City police officers called a
“gang intervention meeting” at a local high school. They
rounded up 60 students, most of whom were Hispanic and
Asian, and sent them to separate classrooms based on their race
/ ethnicity. The students were then searched, interrogated, and
photographed; the information was collected; and the
photographs of the students were entered into the gang
database.74 Both of these cases resulted in suits filed by the
ACLU of Northern California. In the first case, a settlement was
reached in which the police department agreed to take
photographs only if they had reasonable suspicion of criminal
activity and written consent. The settlement in the second case
is similar; it required police to destroy the photographs and
other material collected during the sweep and prohibits further
photographing of students for the gang database.
There also is evidence that inclusion in a gang database may
lead to harsher treatment for youth convicted of crimes. In
Arizona, for example, the prosecutor may increase the charges
from a misdemeanor to a felony if the offense was committed
for the benefit of a gang; if the youth is adjudicated delinquent,
the prosecutor may request a sentence enhancement for gang-
related activity.75 In 2000, 60 percent of California voters
approved Proposition 21, The Gang Violence and Juvenile
Crime Prevention Act, which increased the sentence
enhancements for gang-related crimes. If the crime is serious, 5
years are added to the sentence; if the crime is violent, 10 years
are added. Proposition 21 also makes it easier to prosecute
34. juveniles who are alleged gang members as adults, allows the
police to use wiretaps against known or suspected gang
members, and adds gang-related murder to the list of special
circumstances that make offenders eligible for the death
penalty.”
If, as critics contend, inclusion in a gang database is more
likely for youth of color, these gang-related sentence
enhancements, which are racially neutral on their face, may
have racially discriminatory effects. As Marjorie S. Zatz and
Richard P. Krecker noted, “if ascriptions of gang membership
did not carry penalties, defining gang membership in racialized
ways might be innocuous.... But allegations of gang membership
do carry added penalties, at least in Arizona.” Noting that
Hispanic boys and girls were more likely than whites to be
identified as gang members, and thus more likely to be subject
to the penalty enhancements, they asked, how does this differ
“in effect even if not in intent, from saying that the severity of
sanctions is increased for Latinos?”76
Race/Ethnicity and the Juvenile Justice System
One particularly troubling aspect of juvenile justice as it has
been constructed throughout the 20th Century is its
disproportionate involvement, in an aggregate social sense, with
youths from the lowest socioeconomic strata, who at least in the
latter half of the 20th Century overwhelmingly have been
children of color.77
Although most research on the effect of race on the processing
of criminal defendants has focused on adults, researchers have
also examined the juvenile justice system for evidence of racial
discrimination. Noting that the juvenile system, with its
philosophy of parens patriae,78 is more discretionary and less
formal than the adult system, researchers suggest that there is
greater potential for racial discrimination in the processing of
juveniles than in the processing of adults. In cases involving
juveniles, in other words, criminal justice officials are more
concerned about rehabilitation than retribution, and they have
discretion to decide whether to handle the case formally or
35. informally. As a result, they have more opportunities than those
who handle cases involving adults to take extralegal factors
such as race / ethnicity and gender into consideration during the
decision-making process.
Focus on an Issue: The Past, Present, and Future of the Juvenile
Court
The traditional view of the emergence of the juvenile court in
America pictures the “child savers” as a liberal movement of
the late nineteenth century, made up of benevolent, civic-
minded, middle-class Americans who worked to help
delinquent, abused, and neglected children who were suffering
due to the negative impact of the rapid growth of
industrialization. Although the emergence of the juvenile court
is most often described as the creation of a welfare agency for
the humane treatment of children,79 Anthony Platt highlighted
the movement’s social control agenda as well. According to
Anthony Platt, the “child saving movement” did little to
humanize the justice system for children, but rather “helped
create a system that subjected more and more juveniles to
arbitrary and degrading punishments.”80
Platt contended that the attention of the juvenile court was
originally focused on a select group of at-risk youth: court
personnel originally focused on the children of urban, foreign-
born, poor families for their moral reclamation projects.81
Barry Feld argued that in modern times the juvenile court
continues to intervene disproportionately in the lives of
minority youth.82 He asserted that the persistent
overrepresentation of minority youth at all stages of the system
is largely the consequence of the juvenile court’s unstable
foundation of trying to reconcile social welfare and social
control agendas. This conceptual contradiction allows “public
officials to couch their get-tough policy changes in terms of
‘public safety’ rather than racial oppression.”83
Feld argued that the social welfare and social control aims of
the juvenile court are irreconcilable, and that attempts to pursue
and reconcile these two competing agendas have left the
36. contemporary juvenile court in crisis. He called it “a
conceptually and administratively bankrupt institution with
neither a rationale nor a justification.”84 He also contended that
the juvenile court today offers a “second-class criminal court
for young people” and does not function as a welfare agency.85
Feld suggested that the distinction between adult and juvenile
courts should be eliminated and that social welfare agencies
should be used to address the needs of youth. His suggestion
would make age a mitigating factor in our traditional,
adjudicatory (adult) court system.
Would this policy suggestion ease the oppressive element of the
juvenile court’s intervention in the lives of racial and ethnic
minorities? Why or why not?
There is compelling evidence that racial minorities are
overrepresented in the juvenile justice system. In 2005, for
example, African Americans made up about 15 percent of the
U.S. population aged 10 to 17 but 33 percent of all youth under
juvenile court jurisdiction. Whites constituted approximately 80
percent of the youth population but only 64 percent of all
offenders in juvenile court. African American juveniles were
involved in 41 percent of person offense cases (murder, rape,
robbery, and assault), 29 percent of property offense cases, 24
percent of drug offense cases, and 34 percent of public-order
offenses.86 Stated another way, the total delinquency case rate
for African American juveniles in 2005 (108.4) was more than
twice the rate for white juveniles (44.4) and for Native
American juveniles (53.3); the delinquency case rate for Asian
juveniles was only 17.2.87
There also is evidence of racial disparity in the treatment of
juvenile offenders. As shown in Table 10.6, which presents
nationwide data on juvenile court outcomes in 2005, African
Americans were treated more harshly than whites at several
stages in the juvenile justice process. African Americans were
more likely than whites to be detained prior to juvenile court
disposition and to be petitioned to juvenile court for further
processing. Among those adjudicated delinquent, African
37. Americans were more likely than whites to be placed in a
juvenile facility but somewhat less likely than whites to be
placed on probation. White youth, on the other hand, were more
likely than African American youth to be adjudicated
delinquent. The data presented in Table 10.6 also reveal that
Native Americans are treated more harshly than whites at all
stages of the process; in fact, Native Americans are more likely
than African Americans to be adjudicated delinquent, waived to
adult court, and placed on probation.
Table 10.6 Juvenile Court Case Outcomes, 2005
Whites
African Americans
Native Americans
Asians
Delinquent Cases
Detained prior to juvenile court disposition
18%
26%
20%
22%
Petitioned to juvenile court
53%
62%
56%
59%
Petitioned Cases
38. Adjudicated delinquent
68%
62%
70%
69%
Waived to adult court
0.7%
0.8%
1.3%
0.4%
Adjudicated Cases
Placed out of home
21%
26%
26%
22%
Placed on probation
62%
56%
58%
64%
SOURCE: National Center for Juvenile Justice, Juvenile Court
Statistics 2005 (Washington, DC: Office of Juvenile Justice and
Delinquency Prevention, 2008).
Much of the criticism of the treatment of racial minorities by
39. the juvenile justice system focuses on the fact that racial
minorities are more likely than whites to be detained in secure
facilities prior to adjudication and sentenced to secure
confinement following adjudication. Since 1988 the Juvenile
Justice and Delinquency Prevention Act has required states to
determine whether the proportion of minorities in confinement
exceeds their proportion of the population. If there is
disproportionate minority confinement, the state must develop
and implement policies to reduce it. As shown in Table 10.6, 26
percent of African American and Native American youth who
were adjudicated delinquent received an out-of-home placement
disposition; for white youth, the figure was 21 percent. Among
youth adjudicated delinquent for drug offenses, 29 percent of
African American youth received an out-of-home placement,
compared with 18 percent of Native American youth, 17 percent
of Asian youth, and 15 percent of white youth.88
Although most of the statistics on disproportionate minority
confinement compare African American and white youth, there
is some state-level evidence that Hispanic and Native American
youth are overrepresented in juvenile detention facilities. In
Santa Cruz County, California, for example, Hispanics
comprised 33 percent of the population ages 10 through 17 but
made up 64 percent of the youths incarcerated in the Juvenile
Hall on any given day in 1997 and 1998.89 A study in Colorado
revealed that Hispanic youths were over-represented at all
stages in the juvenile justice system, and a study in North
Dakota found that Native American youth made up 8 percent of
the juvenile population but 21 percent of secure detention
placements and 33 percent of secure correctional placements.90
A report by the Building Blocks for Youth initiative, a national
project to address unfairness in the juvenile justice system and
to promote non-discriminatory and effective policies, also
addressed this issue.91 The authors of the report, And Justice
for Some, concluded that minority youth—and especially
African American youth—receive harsher treatment than white
youth throughout the juvenile justice system. The differences
40. were particularly pronounced at the beginning stages of
involvement with the juvenile justice system (that is, in terms
of decisions regarding intake and detention) and at the end of
the process (that is, in terms of decisions regarding out-of-home
placement in a secure facility). With respect to detention prior
to adjudication, the report found that minority youth were
overrepresented, especially for drug offenses. White youth made
up 66 percent of all youth referred to juvenile courts for drug
offenses but only 44 percent of those detained. African
American youth made up 32 percent of the drug offenders
referred to juvenile court but 55 percent of those detained.92
There was a similar pattern for out-of-home placement: in every
offense category, and especially for drug offenses, minority
youth were more likely than white youth to be committed to a
locked institution.93 Mark Soler, head of the Building Blocks
for Youth initiative, stated that the report painted “a devastating
picture of a system that has totally failed to uphold the
American promise of ‘equal justice for all.’”
The figures presented in Table 10.6 and the statistics on
disproportionate minority confinement do not take racial
differences in crime seriousness, prior juvenile record, or other
legally relevant criteria into consideration. If racial minorities
are referred to juvenile court for more serious offenses or have
more serious criminal histories than whites, the observed racial
disparities in case processing might diminish or disappear once
these factors were taken into consideration. Like research on
sentencing in adult court, studies of juvenile court outcomes
consistently reveal that judges base their decisions primarily on
the seriousness of the offense and the offender’s prior record.94
Thus, “real differences in rates of criminal behavior by black
youths account for part of the disparities in justice
administration.”95
Research conducted during the past 20 years reveals that racial
differences in past and current involvement in crime do not
account for all of the differential treatment of racial minorities
in juvenile court. Carl Pope and William H. Feyerherm, for
41. example, reviewed 46 studies published in the 1970s and
1980s.96 They found that two thirds of the studies they
examined found evidence that racial minorities were treated
more harshly, even after offense seriousness, prior record, and
other legally relevant factors were taken into account. A recent
review of 34 studies published from 1989 to 2001 found a
similar pattern of results.97 Eight of the 34 studies found that
race and/or ethnicity had direct effects on juvenile court
outcomes; 17 reported that the effects of race / ethnicity were
contextual (that is, present at only some decision points or for
some types of offenders); only one study reported no race
effects.98 An analysis that focused explicitly on
disproportionate minority confinement reached the same
conclusion. According to David Huizinga and Delbert S. Elliot,
“Even if the slightly higher rates for more serious offenses
among minorities were given more importance than is
statistically indicated, the relative proportions of whites and
minorities involved in delinquent behavior could not account
for the observed differences in incarceration rates.”99
The studies conducted to date also find evidence of what is
referred to as “cumulative disadvantage”100 or “compound
risk.”101 That is, they reveal that small racial differences in
outcomes at the initial stages of the process “accumulate and
become more pronounced as minority youths are processed
further into the juvenile justice system.”102 The Panel on
Juvenile Crime, for example, calculated the likelihood that a
youth at one stage in the juvenile justice process would reach
the next stage (the transitional probability), as well as the
proportion of the total population under age 18 that reached
each stage in the juvenile justice process (the compound
probability).103 The panel did this separately for African
American and white youth and then used these probabilities to
calculate the African American–to–white relative risk and the
African American–to–white compound risk. As shown in Table
10.7, 7.2 percent of the African American population under age
18, but only 3.6 percent of the white population under age 18,
42. was arrested. African Americans, in other words, were twice as
likely as whites to be arrested. Of those arrested, 69 percent of
the African Americans and 58 percent of the whites were
referred to juvenile court. Taking these differences into account
resulted in a compound probability—that is, the proportion of
the total youth population referred to juvenile court—of 5.0
percent for African American youth and 2.1 percent for white
youth. Thus African Americans were 2.38 times more likely
than whites to be referred to juvenile court. These differences in
outcomes, as Table 10.7 shows, meant that at the end of the
process African Americans were more than three times as likely
as whites to be adjudicated delinquent and confined in a
residential facility. As the panel pointed out, “at almost every
stage in the juvenile justice process the racial disparity is clear,
but not extreme. However, because the system operates
cumulatively the risk is compounded and the end result is that
black juveniles are three times as likely as white juveniles to
end up in residential placement.”104
Table 10.7 Juvenile Justice Outcomes for African Americans
and Whites: Compound Risk
Transitional Probabilitya
Compound Probabilityb
Black to WhiteRisk
Outcome
African Americans
Whites
African Americans
Whites
Relative Riskc
Compound Riskd
Arrested
.072
.036
.072
.036
43. 2.00:1.00
2.00:1.00
Referred to juvenile court
.690
.580
.050
.021
1.19:1.00
2.38:1.00
Case handled formally
.620
.540
.031
.011
1.15:1.00
2.82:1.00
Adjudicated delinquent / found guilty
.550
.590
.0168
.0067
0.93:1.00
2.51:1.00
Residential placement
.320
.260
.0053
.0017
1.23:1.00
3.12:1.00
aThe transitional probability = the proportion of youth at one
stage who proceed to the next stage.
bThe compound probability = the proportion of the population
under age 18 that reach each stage in the process.
cThe relative risk = the ratio of the black transitional
probability to the white transitional probability.
44. dThe compound risk = the ratio of the black compound
probability to the white compound probability.
SOURCE: Adapted from The Panel on Juvenile Justice, Juvenile
Crime Juvenile Justice (Washington, DC: National Academy
Press, 2001), Figure 6.3 and Table 6.5.
In the sections that follow, we summarize the findings of five
recent, methodologically sophisticated studies. The first is a
comparison of outcomes for African Americans and whites in
Florida. The second is an analysis of outcomes for African
American, Hispanic, and white youth in Pennsylvania. The
third, which also examines the treatment of juveniles in
Pennsylvania, is an exploration of the degree to which outcomes
are affected by the urbanization of the jurisdiction and the
youth’s family situation. The fourth study is an examination of
outcomes for white and African American youth in Georgia,
which analyzes the degree to which admitting guilt affects
adjudication and disposition. The fifth study uses data from
Nebraska to explore the extent to which black males aged 16 to
17 are treated differently than other youth. We also discuss
evidence concerning racial disparities in waivers to adult
criminal court.
Race / Ethnicity and Juvenile Court Outcomes in Five
Jurisdictions
Processing Juveniles in Florida
Donna M. Bishop and Charles S. Frazier examined the
processing of African American and white juveniles in
Florida.105 In contrast to previous researchers, most of whom
focused on a single stage of the juvenile justice process, these
researchers followed a cohort of 54,266 youth through the
system from intake through disposition. They examined the
effect of race on five stages in the process: (1) the decision to
refer the case to juvenile court for formal processing (rather
than close the case without further action or handle the case
informally); (2) the decision to place the youth in detention
prior to disposition; (3) the decision to petition the youth to
juvenile court; (4) the decision to adjudicate the youth
45. delinquent (or hold a waiver hearing in anticipation of
transferring the case to criminal court); and (5) the decision to
commit the youth to a residential facility or transfer the case to
criminal court.
Table 10.8 displays the outcomes for African American and
white youth, as well as the proportion of African Americans in
the cohort at each stage in the process. These data indicate that
African Americans were substantially more likely than whites to
be recommended for formal processing (59.1 percent versus
45.6 percent), petitioned to juvenile court (47.3 percent versus
37.8 percent), and either incarcerated in a residential facility or
transferred to criminal court (29.6 percent versus 19.5 percent).
As the cohort of offenders proceeded through the juvenile
justice system, the proportion that was African American
increased from 34.0 percent (among those recommended for
formal processing) to 43.1 percent (among those committed to a
residential facility or transferred to criminal court). As Bishop
and Frazier pointed out, however, these differences could
reflect the fact that the African American youths in their sample
were arrested for more serious crimes and had more serious
prior criminal records than white youths. If this were the case,
the differences would reflect racial disparity but not racial
discrimination.
Table 10.8 Race and Juvenile Justice Processing in Florida,
1979–1981
Recommended for Formal Processing
Detained
Petitioned to Juvenile Court
Adjudicated Delinquent
Incarcerated/Transferred
African Americans
59.1%
11.0%
47.3%
82.5%
46. 29.6%
Whites
45.6
10.2
37.8
80.0
19.5
Proportion
African American
34.0
30.0
32.4
33.3
43.1
SOURCE: Adapted from Donna M. Bishop and Charles E.
Frazier, “The Influence of Race in Juvenile Justice Processing,”
Journal of Research in Crime and Delinquency 25 (1988), pp.
242–263, p. 250.
When the authors controlled for crime seriousness, prior record,
and other predictors of juvenile justice outcomes, they found
that the racial differences did not disappear. Rather, African
Americans were more likely than whites to be recommended for
formal processing, referred to juvenile court, and adjudicated
delinquent. They also received harsher sentences than whites.
These findings led Bishop and Frazier to conclude that “... race
is a far more pervasive influence in processing than much
previous research has indicated.”106
A follow-up study using more recent (1985–1987) Florida data
produced similar results.107 As shown in Figure 10.2, Frazier
and Bishop found that outcomes for “typical” white and
nonwhite youth varied significantly. They defined a typical
47. youth as “a 15-year-old male arrested for a misdemeanor against
person (e.g., simple battery), with a prior record score
consistent with having one prior referral for a misdemeanor
against property (e.g., criminal mischief).”108 Compared to his
white counterpart, the typical nonwhite youth was substantially
more likely to be recommended for formal processing, held in
secure detention prior to disposition, and committed to a
residential facility or transferred to criminal court. They also
found that being detained had a significant effect on subsequent
outcomes; youth who were detained were significantly more
likely than those who were released to be referred to juvenile
court and, if adjudicated delinquent, to be committed to a
residential facility or transferred to criminal court. Thus,
nonwhite youth, who were more likely than white youth to be
detained, were sentenced more harshly both because of their
race (a direct effect) and because of their custody status (an
indirect effect).
Figure 10.2 Juvenile Court Outcomes for “Typical” Florida
Youth, 1985–1987
SOURCE: Adapted from Charles E. Frazier and Donna M.
Bishop, “Reflections on Race Effects in Juvenile Justice,” in
Minorities in Juvenile Justice, Kimberly Kempf Leonard, Carl
E. Pope, and William H. Feyerherm (Thousand Oaks, CA: Sage,
1995).
Frazier and Bishop also conducted interviews with criminal
justice officials. During the interview, the respondent was asked
whether the findings of harsher treatment of nonwhites “were
consistent with their experiences in Florida’s juvenile justice
system between 1985 and 1987.”109 Most of the intake
supervisors and public defenders stated that they believed
juvenile justice dispositions were influenced by the race of the
youth. In contrast, only 25 percent of the prosecutors and 33
percent of the judges believed that nonwhites were treated more
harshly than similarly situated whites.
Although some of the racial differentials in treatment were
48. attributed to racial bias—that is, to prejudiced individuals or a
biased system of juvenile justice—a number of respondents
suggested that the race effects actually reflected differences in
economic circumstances or family situations. As one prosecutor
observed, “The biggest problem is the lack of money and
resources. Blacks don’t have the resources. Whites are more
likely to have insurance to pay for treatment. The poor I saw
were always poor, but the black poor were poorer yet.” Other
respondents cited the fact that white parents were more likely
than black parents to be able to hire a private attorney and, as a
result, got more favorable plea bargains. Other officials
mentioned the role played by family considerations, noting that
youth from single-parent families or families perceived to be
incapable of providing adequate supervision were treated more
harshly than those from intact families. Although they
acknowledged that this practice had a disparate effect on
minority youth, most officials defended it as “fair and
appropriate.” As one judge stated, “Inadequate family and bad
neighborhood correlate with race and ethnicity. It makes sense
to put kids from these circumstances in residential
facilities.”110
Frazier and Bishop concluded that the results of their study
“leave little doubt that juvenile justice officials believe race is a
factor in juvenile justice processing.”111 They noted that the
fact that some officials believed that race directly affected
juvenile justice outcomes, whereas others thought that the effect
of race was subtle and indirect, meant that “policies aimed at
eradicating discrimination must focus both on individual racism
and on racism in its most subtle institutional forms.”112 They
offered the following recommendations:113
· States should establish procedures for all the agencies
comprising the juvenile justice system to require reporting,
investigating, and responding to professionals whose decisions
appear to have been influenced by racial or ethnic bias.
· State legislatures should mandate the development of a race,
ethnic, and cultural diversity curriculum that personnel at every
49. level of the juvenile justice system should be required to
complete.
· Intake policies and practices should be altered so that youths
referred for screening are not rendered ineligible for diversion
and other front-end programs if their parents or guardians (a)
cannot be contacted, (b) are contacted but are unable to be
present for an intake interview, or (c) are unable to participate
in family-centered programs.
· In any situation in which persons with economic resources
(e.g., income or insurance benefits) are allowed to arrange for
private care as a means of diversion from the juvenile justice
system or less harsh formal dispositions, precisely the same
treatment services should be made available at state expense to
serve the poor—whether minority or majority race youths.
Frazier and Bishop acknowledged that these “fairly modest
proposals” were unlikely to eliminate racial discrimination that
had “survived for generations in a legal environment that
expressly forbids it.” Nonetheless, they were “cautiously
optimistic” that their recommendations would have some effect.
As they stated, “if implemented with a genuine interest in their
success, such policies will both help reduce discriminatory
actions and promote equal justice.”114
Processing Juveniles in Pennsylvania
Kimberly Kempf Leonard and Henry Sontheimer115 explored
the effect of race and ethnicity on juvenile justice case
outcomes in Pennsylvania. Although African Americans and
Hispanics accounted for only 19 percent and 4 percent,
respectively, of the general youth population in the 14 counties
included in the study, they comprised 46 percent (African
Americans) and 7 percent (Hispanics) of all referrals to juvenile
court.116
Like the two studies discussed earlier, this study used a
multivariate model to examine the effect of race / ethnicity on a
series of juvenile justice outcomes. Leonard and Sontheimer
found that both African American and Hispanic youth “were
more likely than whites with similar offenses, prior records, and
50. school problems to have their cases formally processed,
especially in nonrural court settings.”117 They also found that
minority youth were significantly more likely than whites to be
detained prior to adjudication, and that detention was a strong
predictor of subsequent outcomes. African American and
Hispanic youth, in other words, were detained more frequently
than whites and, as a result, were more likely than whites to be
adjudicated delinquent and placed in a residential facility
following adjudication.
Leonard and Sontheimer suggest that their findings have
important policy implications. In particular, they recommend
that
[The] criteria used by individual intake officers should be
evaluated to determine whether factors that may more often
negatively affect minorities are accorded importance. Racially
neutral criteria in detention decisions should be established ...
Cultural bias, including value judgments not based on fact (such
as notions that minority parents may not provide adequate
supervision for their children or that certain neighborhoods are
not conducive to growing up well, must not influence
detention.118
Intake and Disposition Decisions in Pennsylvania
A second study of juvenile justice decision making in
Pennsylvania focused on two stages in the process: the decision
to formally refer a youth to the juvenile court rather than handle
the case informally and the decision to place the youth in a
secure detention facility following adjudication.119 As shown
in Table 10.9, which displays the bivariate relationships
between the two outcomes and the legal and extralegal variables
that may affect those outcomes, Christina DeJong and Kenneth
C. Jackson found that African American and Hispanic youth
were more likely than white youth to be referred to juvenile
court; they also were more likely to be committed to a detention
facility. The likelihood of a formal referral also was greater for
youth with the following characteristics: male, aged 15 and
older, living in a single-parent (mother only) family, not in
51. school, charged with a drug offense, charged with a felony, and
with two or more prior arrests. A similar pattern of results was
found for the decision to place the youth in a secure facility.
Table 10.9 The Characteristics of Youth Formally Referred to
Juvenile Court and Placed in Secure Confinement Following
Disposition
Formally Referred (%)
Placed in Secure Facility (%)
Race / Ethnicity
White
49.5
14.9
Black
61.4
17.8
Hispanic
59.4
22.9
Gender
Male
57.5
17.1
Female
38.4
12.9
53. Not in school
68.2
22.6
Charge Type
Property
66.2
16.1
Violent
61.2
15.9
Drug
71.6
23.7
Other
29.6
15.6
Charge Seriousness
Felony
78.5
19.5
Misdemeanor
35.8
12.5
Number of Prior Arrests
54. None
48.7
10.5
One
64.7
22.9
Two
70.1
32.2
Three or more
76.4
35.8
SOURCE: Adapted from Christina DeJong and Kenneth C.
Jackson, “Putting Race Into Context: Race, Juvenile Justice
Processing, and Urbanization,” Justice Quarterly 15 (1998), pp.
487–504, Table 2. Reprinted by permission of the publisher
(Taylor & Francis Ltd, http://www.tandf.co.uk/journals).
Further analysis of the data using multivariate techniques led
DeJong and Jackson to conclude that race / ethnicity did not
have a significant effect on either outcome once the other
variables were taken into consideration. Although Hispanics
were significantly more likely than whites and African
Americans to be formally referred to juvenile court, the referral
rates for African American and white youth did not differ. And
neither Hispanics nor African Americans faced greater odds
than whites of commitment to a secure facility. The race of the
youth, however, did affect these outcomes indirectly. In
particular, white youth who lived with both parents were less
likely than those who lived in single-parent families to be
formally referred to juvenile court or placed in secure
confinement following disposition. Among African American
youth, on the other hand, living with both parents rather than in
55. a single-parent household did not have these positive effects. As
DeJong and Jackson pointed out, “Black youths are treated the
same whether they are living with parents or with their mothers
only; for these youths, family status does not protect against
[formal referral or] incarceration.”120 In addition, African
American youth, but not white youth, were treated more harshly
in rural counties than in urban or suburban counties.
DeJong and Jackson speculated that the fact that family status
did not affect outcomes for African American youth might be
due to juvenile justice officials’ stereotyped beliefs about
African American families. That is, officials “may view all
black fathers as absentee” or “may view the black family
structure as weak.”121 If this is the case, African American
youth who live in two-parent families would not be regarded as
better candidates for diversion or for treatment within the
community than those who live in single-parent families. This
type of subtle discrimination may be more common than the
overt discrimination that characterized the system in earlier
eras.122
Adjudication and Disposition Decisions in Georgia
A study of juvenile court outcomes in Georgia focused on the
interaction between the race of the juvenile and admitting or
denying the crime.123 R. Barry Ruback and Paula J. Vardaman
posited two opposing effects for admitting/denying guilt, one
based on the youth’s potential for rehabilitation and the other
based on due process considerations. They asserted that if the
primary goal of the juvenile justice system was rehabilitation,
then indicators of amenability to rehabilitation should be
important predictors of case disposition. Since admitting guilt
signals that the youth accepts responsibility for his actions and
feels remorse and also indicates that the youth may be a good
candidate for treatment rather than punishment, an admission of
guilt should—again, if rehabilitation is the goal—lead to more
lenient treatment. On the other hand, if the goal of the court is
to punish the guilty, denial of guilt might lead to more lenient
treatment. This might be particularly true, according to Ruback
56. and Vardaman, in large urban jurisdictions with heavy
caseloads. If the youth denies that he is guilty, the court must
hold an evidentiary hearing and prove the charges. Prosecutors
might prefer to dismiss the case rather than use their limited
resources to secure a conviction.
Ruback and Vardaman found that whereas African Americans
were overrep-resented in juvenile court populations in the 16
Georgia counties they examined, white youth were treated more
harshly than African American youth.124 White juveniles (43
percent) were more likely than African American juveniles (39
percent) to be adjudicated delinquent, and African American
juveniles (29 percent) were more likely than white juveniles (23
percent) to have their cases dismissed. The authors also found
that white youth were substantially more likely to admit the
crimes they were accused of committing: 66 percent of the
whites, compared to only 51 percent of the African Americans,
admitted their guilt.
When Ruback and Vardaman compared adjudication outcomes
for African American and white youth, controlling for crime
seriousness, prior record, whether the case was heard in an
urban or rural county, whether the youth admitted guilt, and the
youth’s age and gender, they found that race had no effect.
Admitting guilt, on the other hand, had a strong effect on the
likelihood of being adjudicated delinquent. Youth who admitted
their guilt were more likely to be adjudicated delinquent. The
odds of being adjudicated delinquent also were higher in rural
than in urban counties.
The authors of the study concluded that the harsher treatment of
white youth could be attributed to two factors. First, whites
were more likely than African Americans to admit guilt, and
admitting guilt led to a higher likelihood of being adjudicated
delinquent. Second, cases involving whites were more likely
than those involving African Americans to be processed in rural
courts, where the odds of being adjudicated delinquent were
higher.125 They also suggested that their results might reflect
judges’ beliefs that white youths would be more likely to
57. benefit from the interventions and services available to the
court. Thus,
an intervention by the court may be deemed more likely to
affect the future behavior of white juveniles (who generally
have shorter legal histories), while the same intervention with
Black juveniles (who generally have longer legal histories) may
be perceived as wasted effort. It may be ... that only white
juveniles are believed to be worth investing resources in so as
to reduce the chances of their committing future crimes.126
Ruback and Vardaman maintained that this also might explain
why white youth admitted their guilt at a higher rate than
African American youth. That is, juvenile justice officials might
have urged whites to admit the crime so that they could receive
an informal adjustment and court intervention.
Race / Ethnicity, Gender, and Age: Juvenile Justice in Nebraska
The studies discussed thus far all tested for the direct effects of
race / ethnicity; that is, these studies examined whether African
American and Hispanic youth were treated more harshly than
white youth. Dae-Hoon Kwak used Nebraska data to examine
the interactions among age, gender, race / ethnicity, and four
juvenile court outcomes: detention, petition, adjudication, and
disposition.127 He controlled for the seriousness of the offense,
the youth’s prior delinquency referrals, whether the case was
handled by a separate juvenile court or a regular county court,
and the year of the referral. He found that each of the offender
characteristics affected some or all of the outcomes: youth of
color generally were treated more harshly than white youth,
younger offenders were treated more leniently than offenders
who were between the ages of 13 and 17, and males were more
likely than females to be petitioned and transferred to legal
custody.128
Kwak then compared outcomes for African American males who
were 16 or 17 years old with outcomes for other categories of
offenders. Although he found differences for each of the four
outcomes, the most consistent outcomes were found for the
disposition decision, which was measured by a dichotomous
58. variable that differentiated between decisions that transferred
the legal custody of the youth (that is, transferred the youth to a
secure facility or into the custody of a public agency) and those
that did not (that is, probation, dismissal of charges with a
warning from the judge, or a fine). As shown in Table 10.10,
African American males, aged 16 and 17, received substantially
harsher dispositions than all of the other groups, except for
Hispanic females aged 10 through 12, black males aged 13
through 15, Hispanic males aged 13 through 15, and Native
American males aged 16 and 17. Of particular interest is the
fact that white males, regardless of age, were substantially less
likely than 16- and 17-year-old African American males to have
their legal custody transferred to a secure facility or a state
agency. The probability differences were 21.0 percent for white
males aged 10 through 12, 13.9 percent for white males aged 13
through 15, and 17.7 percent for white males aged 16 and 17.
Overall, then, male teenagers of color, and especially African
American male teenagers, were treated more harshly than other
offenders.
Table 10.10 Differences in the Probabilities of Placement in a
Secure Facility or Transfer to a State Agency
Probability Differences Between African American Males, Ages
16 and 17, and...
White Female
Age 10–12
–18.7%
Age 13–15
–17.2%
Age 16–17
–18.8%
Black Female
59. Age 10–12
–26.1%
Age 13–15
–6.8%
Age 16–17
–19.6%
Hispanic Female
Age 10–12
Not significant
Age 13–15
–12.2%
Age 16–17
–22.6%
Native American Female
Age 10–12
–28.0%
Age 13–15
–12.0%
Age 16–17
–16.8%
White Male
Age 10–12
–21.0%
60. Age 13–15
–13.9%
Age 16–17
–17.7%
African American Male
Age 10–12
–12.8%
Age 13–15
Not significant
Hispanic Male
Age 10–12
–26.3%
Age 13–15
Not significant
Age 16–17
Not significant
Native American Male
Age 10–12
–24.0%
Age 13–15
–6.6%
Age 16–17
Not significant
SOURCE: Dae-Hoon Kwak, “The Interaction of Age, Gender,
61. and Race / Ethnicity on Juvenile Justice Decision Making in
Nebraska.” Unpublished master’s thesis, University of Nebraska
at Omaha, 2004.
In summary, the results of the studies reviewed here suggest
that the effect of race / ethnicity on juvenile court outcomes is
complex. Some researchers conclude that race and ethnicity
have direct or overt effects on case outcomes. Research
conducted in Florida and Pennsylvania, for example, found that
racial minorities were treated more harshly than whites at
several stages in the juvenile justice process, including
detention, and that detention had significant “spillover effects”
on subsequent adjudication and disposition decisions. Other
researchers conclude that the effect of race / ethnicity is
indirect rather than direct. Research conducted in Pennsylvania,
for instance, found that living in a two-parent family benefitted
whites but not African Americans, while research in Georgia
found that the harsher treatment of white youth reflected their
higher rates of admitting guilt and a greater likelihood of being
prosecuted in rural rather than urban jurisdictions. And a study
conducted in Nebraska revealed that teenage boys were singled
out for harsher treatment if they were racial minorities,
especially if they were African Americans.
These studies also suggest that the effect of race on juvenile
justice outcomes may vary from one jurisdiction to another and
highlight the importance of conceptualizing decision making in
the juvenile justice system as a process. According to Philip E.
Secret and James B. Johnson,129 “in examining for racial bias
in juvenile justice system decisions, we must scrutinize each
step of the process to see whether previous decisions create a
racial effect by changing the pool of offenders at subsequent
steps.” The importance of differentiating among racial and
ethnic groups is also clear. As one author noted, “Circumstances
surrounding the case processing of minority youths not only
may be different from those for whites, but also may vary
among minority groups.”130
Transfer of Juveniles to Criminal Court
62. In 2009 juveniles accounted for 9.6 percent of all arrests for
murder/manslaughter, 14.5 percent of all arrests for forcible
rape, 25.2 percent of all arrests for robbery, and 11.9 percent of
all arrests for aggravated assault.131 The number of juveniles
arrested increased 100 percent between 1985 and 1994132 but
declined by 18 percent from 1994 to 2003.133 Juvenile arrests
for violent crimes increased from 66,976 in 1985 to 117,200 in
1994 (an increase of 75 percent), but declined to 92,300 (a
decrease of 32 percent) in 2003 and to 68,074 (a further decline
of 26 percent).
The increase in juvenile crime during the 1980s and early
1990s, coupled with highly publicized cases of very young
children accused of murder and other violent crimes, prompted a
number of states to alter procedures for handling certain types
of juvenile offenders. In 1995, for example, Illinois lowered the
age of admission to prison from 13 to 10. This change was
enacted after two boys, ages 10 and 11, dropped a 5-year-old
boy out of a 14th-floor window of a Chicago public housing
development. In 1996 a juvenile court judge ordered that both
boys, who were then 12 and 13, be sent to a high-security
juvenile penitentiary; her decision made the 12-year-old the
nation’s youngest inmate at a high-security prison.134
Other states responded to the increase in serious juvenile crime
by either lowering the age when children can be transferred
from juvenile court to criminal court and/or expanding the list
of offenses for which juveniles can be waived to criminal court.
A report by the United States General Accounting Office
indicated that between 1978 and 1995, 44 states passed new
laws regarding the waiver of juveniles to criminal court; in 24
of these states the new laws increased the population of
juveniles that potentially could be sent to criminal court.135
California, for example, changed the age at which juveniles
could be waived to criminal court from 16 to 14 (for specified
offenses); Missouri reduced the age at which children could be
certified to stand trial as adults from 14 to 12. By 2004 there
were 15 states with mandatory waiver in cases that met certain
63. age, offense, or other criteria and 15 states with a rebuttable
presumption in favor of waiver in certain kinds of cases.
Currently, all but four states give juvenile court judges the
power to waive jurisdiction over juvenile cases that meet certain
criteria—generally, a minimum age, a specified type or level of
offense, and/or a sufficiently serious record of prior
delinquency.136 And 15 states have direct file waiver
provisions, which allow the prosecutor to file certain types of
juvenile cases directly in criminal court. (See Box 10.3 for the
criteria that courts can use in making the waiver decision.)
Box 10.3. Kent v. United States [383 U.S. 541 (1966)]: Criteria
Concerning Waiver of Jurisdiction from Juvenile Court to Adult
Court
In 1996 the United States Supreme Court ruled in Kent v.
United States that waiver hearings must measure up to “the
essentials of due process and fair treatment.” The court held
that juveniles facing waiver are entitled to representation by
counsel, access to social services records, and a written
statement of the reasons for the waiver. In an appendix to its
opinion, the court also laid out the “criteria and principles
concerning waiver of jurisdiction.” The criteria that courts are
to use in making the decision are:
· The seriousness of the alleged offense and whether protection
of the community requires waiver.
· Whether the alleged offense was committed in an aggressive,
violent, premeditated, or willful manner.
· Whether the alleged offense was against persons or against
property.
· Whether there is evidence upon which a Grand Jury may be
expected to return an indictment.
· The desirability of trial and disposition of the entire offense in
one court when the juvenile’s associates are adults who will be
charged with a crime in criminal court.
· The sophistication and maturity of the juvenile as determined
by consideration of his home, environmental situation,
emotional attitude, and pattern of living.
64. · The record and previous history of the juvenile.
· The prospects for adequate protection of the public and the
likelihood of reasonable rehabilitation of the juvenile by the use
of procedures, services, and facilities currently available to the
Juvenile Court.
A 2008 report by the National Center for Juvenile Justice noted
that the number of delinquency cases waived to criminal court
increased by 80 percent from 1985 to 1994 but declined by 51
percent between 1994 and 2001.137 (The report attributed the
decline in the number of cases waived to criminal court in part
to statutory changes that excluded certain cases from juvenile
court or allowed prosecutors to file serious cases directly in
criminal court.) During most of this time period, the waiver rate
was highest for person offenses; from 1989 to 1992, the rate
was higher for drug offenses than for person offenses. Not
surprisingly, cases involving older youth were more likely than
those involving youths 15 and younger to be waived, and cases
involving males were substantially more likely than those
involving females to be waived.138
There also is evidence that cases involving racial minorities are
more likely than those involving whites to be transferred to
criminal court. For example,
· In 2005 the percentage of delinquency cases waived to
criminal court nationwide was 0.7 percent for white youth, 0.8
percent for African American youth, 1.3 percent for Native
American youth, and 0.4 percent for Asian youth. Among youth
charged with drug offenses, the rate was 0.7 for whites, 1.0
percent for African Americans, 1.4 percent for Native
Americans, and 0.3 percent for Asians.139
· In 1996 youth of color accounted for 75 percent of Los
Angeles County’s population between the ages of 10 and 17 but
95 percent of the youths whose cases were waived to adult
court; Asian Americans were 3 times more likely than white
youth, Hispanics were 6 times more likely than white youth, and
African Americans were 12 times more likely than white youth
to be waived to adult court.140