
Recomendados
Mais conteúdo relacionado
Mais procurados
Mais procurados (20)
Destaque
Semelhante a Contour map hw problems
Semelhante a Contour map hw problems (20)
Mais de West Hollow MS Ms. Gill
Mais de West Hollow MS Ms. Gill (20)
Contour map hw problems
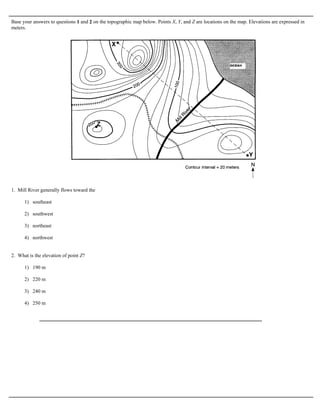
- 1. Base your answers to questions 1 and 2 on the topographic map below. Points X, Y, and Z are locations on the map. Elevations are expressed in meters. 1. Mill River generally flows toward the 1) southeast 2) southwest 3) northeast 4) northwest 2. What is the elevation of point Z? 1) 190 m 2) 220 m 3) 240 m 4) 250 m
- 2. Base your answers to questions 3 and 4 on the maps below. Points A, B, C, X, and Y are locations on the topographic map. The small map identifies the New York State region shown in the topographic map. 3. What is the elevation of point A on the topographic map? 1) 1,700 ft 2) 1,650 ft 3) 1,600 ft 4) 1,550 ft
- 3. 4. What is the approximate gradient between point X and point Y? 1) 100 ft/mi 2) 250 ft/mi 3) 500 ft/mi 4) 1,000 ft/mi 5. A stream has a source at an elevation of 1,000. meters. It 7. What is the elevation of the highest contour line shown on ends in a lake that has an elevation of 300. meters. If the the map below? lake is 200. kilometers away from the source, what is the average gradient of the stream? 1) 1.5 m/km 2) 3.5 m/km 3) 10. m/km 4) 15 m/km 6. The diagram below is a contour map. Between which two points is the slope of the hill steepest? 1) 10,000 feet 2) 10,688 feet 3) 10,700 feet 4) 10,788 feet 1) A and B 2) B and C 3) C and D 4) A and D
- 4. 8. The map below represents an elevation field. What is the approximate gradient between point A and point B? 1) 0.5 m/km 2) 2.0 m/km 3) 3.0 m/km 4) 4.0 m/km
- 5. Base your answers to questions 9 through 11 on the contour map below. Points A, B, C, D, X, and Y are locations on the map. Elevations are expressed in feet. The maximum elevation of Basket Dome is indicated at point X. 9. In which general direction does Tenaya Stream flow? 1) southeast to northwest 2) northwest to southeast 3) southwest to norheast 4) northeast to southwest
- 6. 10. The highest elevation on the map is at point 1) X 2) Y 3) C 4) D 11. The highest elevation of Basket Dome 40 years ago was measured at 7,600 feet. What is the rate of change in elevation for this area? 1) 0.6 in/yr 2) 1.7 in/yr 3) 24 in/yr 4) 40 in/yr Base your answers to questions 12 through 15 on the contour map of an island below. Points A through G represent locations on the island. Elevations are in meters. 12. Which point is located on the steepest slope? 1) F 2) B 3) C 4) D
- 7. 13. In which direction does the Cinder River flow? 1) southeast 2) southwest 3) northeast 4) northwest 14. What is the contour interval for this map? 1) 10 m 2) 15 m 3) 20 m 4) 25 m 15. Which two points have the same elevation? 1) G and F 2) B and D 3) C and D 4) G and C
- 8. Answer Key HW 106 Earth Science Mapping Questions [Oct 06, 2009] 1. 3 2. 2 3. 1 4. 4 5. 2 6. 2 7. 3 8. 2 9. 4 10. 3 11. 1 12. 3 13. 4 14. 3 15. 3