SlideShare uma empresa Scribd logo
1 de 3
Portfolio Optimization

Stock Input Data
                                 Stock-1     Stock-2     Stock-3
               Mean Return        0.14        0.11        0.10
               SD of Return       0.20        0.15        0.08

Correlations                     Stock-1     Stock-2     Stock-3                          Covariances      Stock-1
                      Stock-1       1         0.60        0.40                                   Stock-1   0.0400
                      Stock-2     0.60          1         0.70                                   Stock-2   0.0180
                      Stock-3     0.40        0.70          1                                    Stock-3   0.0064

Investment Decisions
                                 Stock-1     Stock-2     Stock-3      Sum                   Required
Fractions to Invest                0.5          0          0.5        1.00       =            1.00           →

Expected Return
                                Actual        must be   Required
                                  0.1200       >=         0.12         →     Constraint

Portfolio Variance                  0.0148
Portfolio SD                     0.121655      →        objective function


Risk Verses Return
             Req'd Return        Stock-1     Stock-2     Stock-3       SD     Return
                    0.100
                    0.105
                    0.110
                    0.115
                    0.120
                    0.125
                    0.130
                    0.135
                    0.140
info given /cell
                                                  excel:: Product of cell calculation
                                                  decision variable/cell
                                                  Solver computation


 Stock-2     Stock-3
 0.0180      0.0064
 0.0225      0.0084
 0.0084      0.0064


                       Transpose of Fractions to Invest
Constraint                  for calc Portfolio Variance
                                       0.5
                                        0
                                       0.5
EMP 504 CH 08: Nonlinear LP Investment Portfolio Rebecca Paris #106909694
Portfolio Optimization                                                                                                                                    info given /cell
                                                                                                                                                          excel:: Product of cell calculation
Stock Input Data                                                                                                                                          decision variable/cell
                                 Stock-1   Stock-2     Stock-3                                                                                            Solver computation
               Mean Return        0.14      0.11        0.10
               SD of Return       0.20      0.15        0.08

Correlations                     Stock-1   Stock-2     Stock-3                           Covariances                    Stock-1    Stock-2     Stock-3
                      Stock-1       1       0.60        0.40                                    Stock-1                 0.0400     0.0180      0.0064
                      Stock-2     0.60        1         0.70                                    Stock-2                 0.0180     0.0225      0.0084
                      Stock-3     0.40      0.70          1                                     Stock-3                 0.0064     0.0084      0.0064

Investment Decisions
                                 Stock-1   Stock-2     Stock-3      Sum                     Required                                                         Transpose of Fractions to Invest
Fractions to Invest                0.5        0          0.5        1.00        =             1.00                          →     Constraint                       for calc Portfolio Variance
                                                                                                                                                                              0.5
Expected Return                                                                                                                                                                0
                                Actual      must be   Required                                                                                                                0.5
                                  0.1200     >=        0.1200        →      Constraint

Portfolio Variance               0.0148
Portfolio SD                     0.1217      →        objective function


Risk Verses Return
             Req'd Return        Stock-1   Stock-2     Stock-3       SD     Act.Return
                    0.100        0.0000    0.0000      1.0000      0.0800    0.1000                                                              Efficiency Frontier
                    0.105        0.1250    0.0000      0.8750      0.0832    0.1050
                    0.110        0.2500    0.0000      0.7500      0.0922    0.1100                            0.1500
                    0.115        0.3750    0.0000      0.6250      0.1055    0.1150
                    0.120        0.5000    0.0000      0.5000      0.1217    0.1200
                                                                                                               0.1400
                    0.125        0.6250    0.0000      0.3750      0.1397    0.1250
                    0.130        0.7500    0.0000      0.2500      0.1591    0.1300
                                                                                                               0.1300
                                                                                            Portfolio Return


                    0.135        0.8750    0.0000      0.1250      0.1792    0.1350
                    0.140        1.0000    0.0000      0.0000      0.2000    0.1400
                                                                                                               0.1200


                                                                                                               0.1100


                                                                                                               0.1000


                                                                                                               0.0900
                                                                                                                   0.0000           0.0500               0.1000           0.1500                 0.2000   0.2500
                                                                                                                                                            Portfolio Std Dev

Mais conteúdo relacionado

Destaque

NEN E Club-Where entrepreneurs connect
NEN E Club-Where entrepreneurs connectNEN E Club-Where entrepreneurs connect
NEN E Club-Where entrepreneurs connect
preranamanvi
 

Destaque (11)

WebTrends - Between Semantic, loss of Privacy and Personalization.
WebTrends - Between Semantic, loss of Privacy and Personalization.WebTrends - Between Semantic, loss of Privacy and Personalization.
WebTrends - Between Semantic, loss of Privacy and Personalization.
 
NEN E Club-Where entrepreneurs connect
NEN E Club-Where entrepreneurs connectNEN E Club-Where entrepreneurs connect
NEN E Club-Where entrepreneurs connect
 
Report Markowitz Emp 504 Ch 08
Report Markowitz Emp 504 Ch 08Report Markowitz Emp 504 Ch 08
Report Markowitz Emp 504 Ch 08
 
How to Use Your Study Abroad Experience to Create a Life of Awesome
How to Use Your Study Abroad Experience to Create a Life of AwesomeHow to Use Your Study Abroad Experience to Create a Life of Awesome
How to Use Your Study Abroad Experience to Create a Life of Awesome
 
Raak bureaupresentatie informatief
Raak bureaupresentatie informatiefRaak bureaupresentatie informatief
Raak bureaupresentatie informatief
 
Pitching the Media in the Digital Age (Alexis Grant)
Pitching the Media in the Digital Age (Alexis Grant)Pitching the Media in the Digital Age (Alexis Grant)
Pitching the Media in the Digital Age (Alexis Grant)
 
NEN E Club
NEN E ClubNEN E Club
NEN E Club
 
10 Insightful Quotes On Designing A Better Customer Experience
10 Insightful Quotes On Designing A Better Customer Experience10 Insightful Quotes On Designing A Better Customer Experience
10 Insightful Quotes On Designing A Better Customer Experience
 
How to Build a Dynamic Social Media Plan
How to Build a Dynamic Social Media PlanHow to Build a Dynamic Social Media Plan
How to Build a Dynamic Social Media Plan
 
Learn BEM: CSS Naming Convention
Learn BEM: CSS Naming ConventionLearn BEM: CSS Naming Convention
Learn BEM: CSS Naming Convention
 
SEO: Getting Personal
SEO: Getting PersonalSEO: Getting Personal
SEO: Getting Personal
 

Semelhante a Case Investment Portfolio Non Lp 06 Dec 08 (7)

Ch 05 financial management notes
Ch 05 financial management notesCh 05 financial management notes
Ch 05 financial management notes
 
Primero 2011 Q4 and Year End Results
Primero 2011 Q4 and Year End ResultsPrimero 2011 Q4 and Year End Results
Primero 2011 Q4 and Year End Results
 
Fuzzy association rules pre final
Fuzzy association rules   pre finalFuzzy association rules   pre final
Fuzzy association rules pre final
 
SPICE MODEL of 1SS187 (Professional Model) in SPICE PARK
SPICE MODEL of 1SS187 (Professional Model) in SPICE PARKSPICE MODEL of 1SS187 (Professional Model) in SPICE PARK
SPICE MODEL of 1SS187 (Professional Model) in SPICE PARK
 
Jacobs Dodd Frank&Basel3 July12 7 15 12 V16
Jacobs Dodd Frank&Basel3 July12 7 15 12 V16Jacobs Dodd Frank&Basel3 July12 7 15 12 V16
Jacobs Dodd Frank&Basel3 July12 7 15 12 V16
 
Jfet basics
Jfet basicsJfet basics
Jfet basics
 
Differential games
Differential gamesDifferential games
Differential games
 

Case Investment Portfolio Non Lp 06 Dec 08

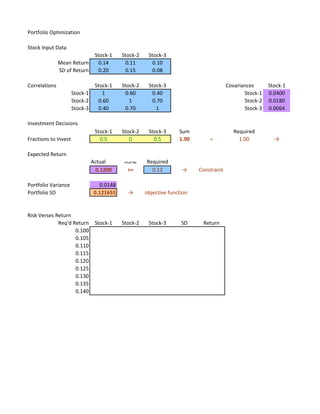
  • 1. Portfolio Optimization Stock Input Data Stock-1 Stock-2 Stock-3 Mean Return 0.14 0.11 0.10 SD of Return 0.20 0.15 0.08 Correlations Stock-1 Stock-2 Stock-3 Covariances Stock-1 Stock-1 1 0.60 0.40 Stock-1 0.0400 Stock-2 0.60 1 0.70 Stock-2 0.0180 Stock-3 0.40 0.70 1 Stock-3 0.0064 Investment Decisions Stock-1 Stock-2 Stock-3 Sum Required Fractions to Invest 0.5 0 0.5 1.00 = 1.00 → Expected Return Actual must be Required 0.1200 >= 0.12 → Constraint Portfolio Variance 0.0148 Portfolio SD 0.121655 → objective function Risk Verses Return Req'd Return Stock-1 Stock-2 Stock-3 SD Return 0.100 0.105 0.110 0.115 0.120 0.125 0.130 0.135 0.140
  • 2. info given /cell excel:: Product of cell calculation decision variable/cell Solver computation Stock-2 Stock-3 0.0180 0.0064 0.0225 0.0084 0.0084 0.0064 Transpose of Fractions to Invest Constraint for calc Portfolio Variance 0.5 0 0.5
  • 3. EMP 504 CH 08: Nonlinear LP Investment Portfolio Rebecca Paris #106909694 Portfolio Optimization info given /cell excel:: Product of cell calculation Stock Input Data decision variable/cell Stock-1 Stock-2 Stock-3 Solver computation Mean Return 0.14 0.11 0.10 SD of Return 0.20 0.15 0.08 Correlations Stock-1 Stock-2 Stock-3 Covariances Stock-1 Stock-2 Stock-3 Stock-1 1 0.60 0.40 Stock-1 0.0400 0.0180 0.0064 Stock-2 0.60 1 0.70 Stock-2 0.0180 0.0225 0.0084 Stock-3 0.40 0.70 1 Stock-3 0.0064 0.0084 0.0064 Investment Decisions Stock-1 Stock-2 Stock-3 Sum Required Transpose of Fractions to Invest Fractions to Invest 0.5 0 0.5 1.00 = 1.00 → Constraint for calc Portfolio Variance 0.5 Expected Return 0 Actual must be Required 0.5 0.1200 >= 0.1200 → Constraint Portfolio Variance 0.0148 Portfolio SD 0.1217 → objective function Risk Verses Return Req'd Return Stock-1 Stock-2 Stock-3 SD Act.Return 0.100 0.0000 0.0000 1.0000 0.0800 0.1000 Efficiency Frontier 0.105 0.1250 0.0000 0.8750 0.0832 0.1050 0.110 0.2500 0.0000 0.7500 0.0922 0.1100 0.1500 0.115 0.3750 0.0000 0.6250 0.1055 0.1150 0.120 0.5000 0.0000 0.5000 0.1217 0.1200 0.1400 0.125 0.6250 0.0000 0.3750 0.1397 0.1250 0.130 0.7500 0.0000 0.2500 0.1591 0.1300 0.1300 Portfolio Return 0.135 0.8750 0.0000 0.1250 0.1792 0.1350 0.140 1.0000 0.0000 0.0000 0.2000 0.1400 0.1200 0.1100 0.1000 0.0900 0.0000 0.0500 0.1000 0.1500 0.2000 0.2500 Portfolio Std Dev