SlideShare uma empresa Scribd logo
1 de 8
Chapter 4
Prepared By
Norisah Mustaffa
(COPYRIGHT RESERVED)

B

A

4.1 Pie Chart

4.2 Mode, Median and Mean

2/10/2014

80º

42

156º
C

1
4.2 MODE, MEDIAN AND MEAN
Mod, median and mean are three types of averages
commonly used in statistics. These averages are also
called the measures of central tendency.
MODE
A Determining The Mode For A Set Of Data
Mode is the most common fact or value with the highest
frequency in a set of data.
Example 1:
Find the mode for the numbers : 6, 3, 5, 6, 3, 8, 2, 6 and 9
Solution:
Mode = 6, frequency = 3
The number 6 occurs thrice. All the other numbers occur not
more then thrice. 6 is the highest frequency.
2/10/2014

2
MODE
A Determining The Mode For A Set Of Data
Mode is the most common fact or value with the highest
frequency in a set of data.

Example 2:
Find the mode(s) for the numbers :

3, 5, 0, 9, 1, 2 and 4.
Solution:
Mode = No mode
Each number appears only once. Every number has the same
frequency.

2/10/2014

3
MODE
B Determining The Mode And Its Corresponding Frequency

From Pictograms, Bar Charts, Line Graphs And Pie Charts

The Mode and its corresponding frequency in a set of data can be
obtained from pictograms, bar charts, line graphs and pie charts.

Number of Students

120



100

Solution:
Mode is Gred C

80

Frequency of mode
= 120 students

60
40
20
0
2/10/2014

A

B

C

D

Gred
4
MEDIAN
C Determining The Median For A Set Of Data
Median is the middle value in a set of values arranged in order of
magnitude.
1, 3, 5, 7, 9, 11…..

For an odd number of values arranged in order of magnitude, the
median is the middle value.

Example: Find the median of the following data.

2, 5, 0, 7, 3, 1, 6,
7.
Solution: Rearrange the data in asscending order.

3 is the middle, Hence, the median is 3
2/10/2014

5
MEDIAN

C Determining The Median For A Set Of Data
Median is the middle value in a set of values arranged in order of
2, 4, 6, 8, 10…..
magnitude.
For an even number of values arranged in order of magnitude, the
median is the mean of the two middle values.

Example: Find the median of the following data.
15, 10, 9, 13, 26, 18,
Solution: Rearrange the data in asscending order.

13 and 15 are the two middle values,
Hence, the median is (13 + 15) 2
= 28 2
= 14
2/10/2014

6
MEAN
E

Calculating The Mean For A Set Of Data
1. Method to calculate the mean for a set of data.
Mean is the average value for a set of data.

Mean = Sum of data values
Number of values
Example: Find the mean of the following data.
12, 24, 23, 24, 17, 20.

Mean = 12 + 24 + 23 + 24 + 17 + 20
6
= 120
6
= 20
2/10/2014

7
Thank You
If at first you don't succeed ... transform your data set.

2/10/2014

8

Mais conteúdo relacionado

Mais procurados

Central tendency Measures and Variability
Central tendency Measures and VariabilityCentral tendency Measures and Variability
Central tendency Measures and VariabilityPedro Martinez
 
Measures of central tendancy
Measures of central tendancy Measures of central tendancy
Measures of central tendancy Pranav Krishna
 
Measure of central tendency
Measure of central tendencyMeasure of central tendency
Measure of central tendencymauitaylor007
 
Standard Deviation and Variance
Standard Deviation and VarianceStandard Deviation and Variance
Standard Deviation and VarianceRobbie Jule
 
Ppt central tendency measures
Ppt central tendency measuresPpt central tendency measures
Ppt central tendency measuresMtMt37
 
3.1 measures of central tendency
3.1 measures of central tendency3.1 measures of central tendency
3.1 measures of central tendencyleblance
 
Statistical Methods
Statistical MethodsStatistical Methods
Statistical Methodsguest9fa52
 
Mean, Median, and Mode - Introductory Statistics
Mean, Median, and Mode - Introductory StatisticsMean, Median, and Mode - Introductory Statistics
Mean, Median, and Mode - Introductory Statisticsquantitative_specialists
 
Basic Concept Of Probability
Basic Concept Of ProbabilityBasic Concept Of Probability
Basic Concept Of Probabilityguest45a926
 
Combined mean and Weighted Arithmetic Mean
Combined mean and  Weighted Arithmetic MeanCombined mean and  Weighted Arithmetic Mean
Combined mean and Weighted Arithmetic MeanMamatha Upadhya
 
Standard Deviation and Variance
Standard Deviation and VarianceStandard Deviation and Variance
Standard Deviation and VarianceJufil Hombria
 
Permutations and combinations ppt
Permutations and combinations pptPermutations and combinations ppt
Permutations and combinations pptPriya !!!
 
11.4 slope intercept form of a linear equation
11.4 slope intercept form of a linear equation11.4 slope intercept form of a linear equation
11.4 slope intercept form of a linear equationGlenSchlee
 

Mais procurados (20)

Mean-median-mode
Mean-median-modeMean-median-mode
Mean-median-mode
 
Central tendency Measures and Variability
Central tendency Measures and VariabilityCentral tendency Measures and Variability
Central tendency Measures and Variability
 
Measures of central tendancy
Measures of central tendancy Measures of central tendancy
Measures of central tendancy
 
Standard deviation
Standard deviationStandard deviation
Standard deviation
 
Measure of central tendency
Measure of central tendencyMeasure of central tendency
Measure of central tendency
 
Standard Deviation and Variance
Standard Deviation and VarianceStandard Deviation and Variance
Standard Deviation and Variance
 
Measures of Position
Measures of PositionMeasures of Position
Measures of Position
 
Contingency Tables
Contingency TablesContingency Tables
Contingency Tables
 
T distribution | Statistics
T distribution | StatisticsT distribution | Statistics
T distribution | Statistics
 
Ppt central tendency measures
Ppt central tendency measuresPpt central tendency measures
Ppt central tendency measures
 
3.1 measures of central tendency
3.1 measures of central tendency3.1 measures of central tendency
3.1 measures of central tendency
 
Statistical Methods
Statistical MethodsStatistical Methods
Statistical Methods
 
Mean, Median, and Mode - Introductory Statistics
Mean, Median, and Mode - Introductory StatisticsMean, Median, and Mode - Introductory Statistics
Mean, Median, and Mode - Introductory Statistics
 
Basic Concept Of Probability
Basic Concept Of ProbabilityBasic Concept Of Probability
Basic Concept Of Probability
 
Statistics
StatisticsStatistics
Statistics
 
Combined mean and Weighted Arithmetic Mean
Combined mean and  Weighted Arithmetic MeanCombined mean and  Weighted Arithmetic Mean
Combined mean and Weighted Arithmetic Mean
 
Standard Deviation and Variance
Standard Deviation and VarianceStandard Deviation and Variance
Standard Deviation and Variance
 
Measures of variability
Measures of variabilityMeasures of variability
Measures of variability
 
Permutations and combinations ppt
Permutations and combinations pptPermutations and combinations ppt
Permutations and combinations ppt
 
11.4 slope intercept form of a linear equation
11.4 slope intercept form of a linear equation11.4 slope intercept form of a linear equation
11.4 slope intercept form of a linear equation
 

Semelhante a Stattistic ii - mode, median, mean

CABT Math 8 measures of central tendency and dispersion
CABT Math 8   measures of central tendency and dispersionCABT Math 8   measures of central tendency and dispersion
CABT Math 8 measures of central tendency and dispersionGilbert Joseph Abueg
 
Measures of Central Tendency.ppt
Measures of Central Tendency.pptMeasures of Central Tendency.ppt
Measures of Central Tendency.pptAdamRayManlunas1
 
Measures of central tendency and dispersion
Measures of central tendency and dispersionMeasures of central tendency and dispersion
Measures of central tendency and dispersionAbhinav yadav
 
3. Mean__Median__Mode__Range.ppt
3. Mean__Median__Mode__Range.ppt3. Mean__Median__Mode__Range.ppt
3. Mean__Median__Mode__Range.pptABDULRAUF411
 
Mean__Median__Mode__Range.ppt
Mean__Median__Mode__Range.pptMean__Median__Mode__Range.ppt
Mean__Median__Mode__Range.ppttrader33
 
Measures of Central Tendency.pdf
Measures of Central Tendency.pdfMeasures of Central Tendency.pdf
Measures of Central Tendency.pdfDenogieCortes
 
Measures of Central Tendency of Ungroup Data-Demo.pptx
Measures of Central Tendency of Ungroup Data-Demo.pptxMeasures of Central Tendency of Ungroup Data-Demo.pptx
Measures of Central Tendency of Ungroup Data-Demo.pptxRoquiMabugayGonzaga
 
A Brief Overview On Central Tendency.pptx
A Brief Overview On Central Tendency.pptxA Brief Overview On Central Tendency.pptx
A Brief Overview On Central Tendency.pptxCHIRANTANMONDAL2
 
DEMO LESSON PLAN.docx
DEMO LESSON PLAN.docxDEMO LESSON PLAN.docx
DEMO LESSON PLAN.docxChinGa7
 
Descriptive Statistics.pptx
Descriptive Statistics.pptxDescriptive Statistics.pptx
Descriptive Statistics.pptxfatinhidayah14
 
Mean_Median_Mode.ppthhhhhhhhhhhhhhhhhhhhhhhhhhhhhhhhhhhhhhhhhhhhhhhhhhhhhhhhh...
Mean_Median_Mode.ppthhhhhhhhhhhhhhhhhhhhhhhhhhhhhhhhhhhhhhhhhhhhhhhhhhhhhhhhh...Mean_Median_Mode.ppthhhhhhhhhhhhhhhhhhhhhhhhhhhhhhhhhhhhhhhhhhhhhhhhhhhhhhhhh...
Mean_Median_Mode.ppthhhhhhhhhhhhhhhhhhhhhhhhhhhhhhhhhhhhhhhhhhhhhhhhhhhhhhhhh...JuliusRomano3
 
Mean-Median-Mode-Range-Demonstration.pptx
Mean-Median-Mode-Range-Demonstration.pptxMean-Median-Mode-Range-Demonstration.pptx
Mean-Median-Mode-Range-Demonstration.pptxssuserb9172b1
 
Mean-Median-Mode-Range-Demonstration.pptx
Mean-Median-Mode-Range-Demonstration.pptxMean-Median-Mode-Range-Demonstration.pptx
Mean-Median-Mode-Range-Demonstration.pptxkrishan425
 
Topic 8a Basic Statistics
Topic 8a Basic StatisticsTopic 8a Basic Statistics
Topic 8a Basic StatisticsYee Bee Choo
 
3. measures of central tendency
3. measures of central tendency3. measures of central tendency
3. measures of central tendencyrenz50
 

Semelhante a Stattistic ii - mode, median, mean (20)

CABT Math 8 measures of central tendency and dispersion
CABT Math 8   measures of central tendency and dispersionCABT Math 8   measures of central tendency and dispersion
CABT Math 8 measures of central tendency and dispersion
 
Measures of Central Tendency.ppt
Measures of Central Tendency.pptMeasures of Central Tendency.ppt
Measures of Central Tendency.ppt
 
Measures of central tendency and dispersion
Measures of central tendency and dispersionMeasures of central tendency and dispersion
Measures of central tendency and dispersion
 
3. Mean__Median__Mode__Range.ppt
3. Mean__Median__Mode__Range.ppt3. Mean__Median__Mode__Range.ppt
3. Mean__Median__Mode__Range.ppt
 
Mean__Median__Mode__Range.ppt
Mean__Median__Mode__Range.pptMean__Median__Mode__Range.ppt
Mean__Median__Mode__Range.ppt
 
stat.ppt
stat.pptstat.ppt
stat.ppt
 
Tendency
TendencyTendency
Tendency
 
Measures of Central Tendency.pdf
Measures of Central Tendency.pdfMeasures of Central Tendency.pdf
Measures of Central Tendency.pdf
 
classroom 2.pptx
classroom 2.pptxclassroom 2.pptx
classroom 2.pptx
 
Measures of Central Tendency of Ungroup Data-Demo.pptx
Measures of Central Tendency of Ungroup Data-Demo.pptxMeasures of Central Tendency of Ungroup Data-Demo.pptx
Measures of Central Tendency of Ungroup Data-Demo.pptx
 
A Brief Overview On Central Tendency.pptx
A Brief Overview On Central Tendency.pptxA Brief Overview On Central Tendency.pptx
A Brief Overview On Central Tendency.pptx
 
DEMO LESSON PLAN.docx
DEMO LESSON PLAN.docxDEMO LESSON PLAN.docx
DEMO LESSON PLAN.docx
 
G7-quantitative
G7-quantitativeG7-quantitative
G7-quantitative
 
Descriptive Statistics.pptx
Descriptive Statistics.pptxDescriptive Statistics.pptx
Descriptive Statistics.pptx
 
Mean_Median_Mode.ppthhhhhhhhhhhhhhhhhhhhhhhhhhhhhhhhhhhhhhhhhhhhhhhhhhhhhhhhh...
Mean_Median_Mode.ppthhhhhhhhhhhhhhhhhhhhhhhhhhhhhhhhhhhhhhhhhhhhhhhhhhhhhhhhh...Mean_Median_Mode.ppthhhhhhhhhhhhhhhhhhhhhhhhhhhhhhhhhhhhhhhhhhhhhhhhhhhhhhhhh...
Mean_Median_Mode.ppthhhhhhhhhhhhhhhhhhhhhhhhhhhhhhhhhhhhhhhhhhhhhhhhhhhhhhhhh...
 
Mean-Median-Mode-Range-Demonstration.pptx
Mean-Median-Mode-Range-Demonstration.pptxMean-Median-Mode-Range-Demonstration.pptx
Mean-Median-Mode-Range-Demonstration.pptx
 
Mean-Median-Mode-Range-Demonstration.pptx
Mean-Median-Mode-Range-Demonstration.pptxMean-Median-Mode-Range-Demonstration.pptx
Mean-Median-Mode-Range-Demonstration.pptx
 
Chapter 3.2
Chapter 3.2Chapter 3.2
Chapter 3.2
 
Topic 8a Basic Statistics
Topic 8a Basic StatisticsTopic 8a Basic Statistics
Topic 8a Basic Statistics
 
3. measures of central tendency
3. measures of central tendency3. measures of central tendency
3. measures of central tendency
 

Último

A Critique of the Proposed National Education Policy Reform
A Critique of the Proposed National Education Policy ReformA Critique of the Proposed National Education Policy Reform
A Critique of the Proposed National Education Policy ReformChameera Dedduwage
 
Z Score,T Score, Percential Rank and Box Plot Graph
Z Score,T Score, Percential Rank and Box Plot GraphZ Score,T Score, Percential Rank and Box Plot Graph
Z Score,T Score, Percential Rank and Box Plot GraphThiyagu K
 
BASLIQ CURRENT LOOKBOOK LOOKBOOK(1) (1).pdf
BASLIQ CURRENT LOOKBOOK  LOOKBOOK(1) (1).pdfBASLIQ CURRENT LOOKBOOK  LOOKBOOK(1) (1).pdf
BASLIQ CURRENT LOOKBOOK LOOKBOOK(1) (1).pdfSoniaTolstoy
 
URLs and Routing in the Odoo 17 Website App
URLs and Routing in the Odoo 17 Website AppURLs and Routing in the Odoo 17 Website App
URLs and Routing in the Odoo 17 Website AppCeline George
 
Kisan Call Centre - To harness potential of ICT in Agriculture by answer farm...
Kisan Call Centre - To harness potential of ICT in Agriculture by answer farm...Kisan Call Centre - To harness potential of ICT in Agriculture by answer farm...
Kisan Call Centre - To harness potential of ICT in Agriculture by answer farm...Krashi Coaching
 
1029 - Danh muc Sach Giao Khoa 10 . pdf
1029 -  Danh muc Sach Giao Khoa 10 . pdf1029 -  Danh muc Sach Giao Khoa 10 . pdf
1029 - Danh muc Sach Giao Khoa 10 . pdfQucHHunhnh
 
CARE OF CHILD IN INCUBATOR..........pptx
CARE OF CHILD IN INCUBATOR..........pptxCARE OF CHILD IN INCUBATOR..........pptx
CARE OF CHILD IN INCUBATOR..........pptxGaneshChakor2
 
Introduction to ArtificiaI Intelligence in Higher Education
Introduction to ArtificiaI Intelligence in Higher EducationIntroduction to ArtificiaI Intelligence in Higher Education
Introduction to ArtificiaI Intelligence in Higher Educationpboyjonauth
 
How to Make a Pirate ship Primary Education.pptx
How to Make a Pirate ship Primary Education.pptxHow to Make a Pirate ship Primary Education.pptx
How to Make a Pirate ship Primary Education.pptxmanuelaromero2013
 
Beyond the EU: DORA and NIS 2 Directive's Global Impact
Beyond the EU: DORA and NIS 2 Directive's Global ImpactBeyond the EU: DORA and NIS 2 Directive's Global Impact
Beyond the EU: DORA and NIS 2 Directive's Global ImpactPECB
 
POINT- BIOCHEMISTRY SEM 2 ENZYMES UNIT 5.pptx
POINT- BIOCHEMISTRY SEM 2 ENZYMES UNIT 5.pptxPOINT- BIOCHEMISTRY SEM 2 ENZYMES UNIT 5.pptx
POINT- BIOCHEMISTRY SEM 2 ENZYMES UNIT 5.pptxSayali Powar
 
Software Engineering Methodologies (overview)
Software Engineering Methodologies (overview)Software Engineering Methodologies (overview)
Software Engineering Methodologies (overview)eniolaolutunde
 
Privatization and Disinvestment - Meaning, Objectives, Advantages and Disadva...
Privatization and Disinvestment - Meaning, Objectives, Advantages and Disadva...Privatization and Disinvestment - Meaning, Objectives, Advantages and Disadva...
Privatization and Disinvestment - Meaning, Objectives, Advantages and Disadva...RKavithamani
 
Student login on Anyboli platform.helpin
Student login on Anyboli platform.helpinStudent login on Anyboli platform.helpin
Student login on Anyboli platform.helpinRaunakKeshri1
 
Interactive Powerpoint_How to Master effective communication
Interactive Powerpoint_How to Master effective communicationInteractive Powerpoint_How to Master effective communication
Interactive Powerpoint_How to Master effective communicationnomboosow
 
18-04-UA_REPORT_MEDIALITERAСY_INDEX-DM_23-1-final-eng.pdf
18-04-UA_REPORT_MEDIALITERAСY_INDEX-DM_23-1-final-eng.pdf18-04-UA_REPORT_MEDIALITERAСY_INDEX-DM_23-1-final-eng.pdf
18-04-UA_REPORT_MEDIALITERAСY_INDEX-DM_23-1-final-eng.pdfssuser54595a
 
Organic Name Reactions for the students and aspirants of Chemistry12th.pptx
Organic Name Reactions  for the students and aspirants of Chemistry12th.pptxOrganic Name Reactions  for the students and aspirants of Chemistry12th.pptx
Organic Name Reactions for the students and aspirants of Chemistry12th.pptxVS Mahajan Coaching Centre
 

Último (20)

A Critique of the Proposed National Education Policy Reform
A Critique of the Proposed National Education Policy ReformA Critique of the Proposed National Education Policy Reform
A Critique of the Proposed National Education Policy Reform
 
Z Score,T Score, Percential Rank and Box Plot Graph
Z Score,T Score, Percential Rank and Box Plot GraphZ Score,T Score, Percential Rank and Box Plot Graph
Z Score,T Score, Percential Rank and Box Plot Graph
 
BASLIQ CURRENT LOOKBOOK LOOKBOOK(1) (1).pdf
BASLIQ CURRENT LOOKBOOK  LOOKBOOK(1) (1).pdfBASLIQ CURRENT LOOKBOOK  LOOKBOOK(1) (1).pdf
BASLIQ CURRENT LOOKBOOK LOOKBOOK(1) (1).pdf
 
URLs and Routing in the Odoo 17 Website App
URLs and Routing in the Odoo 17 Website AppURLs and Routing in the Odoo 17 Website App
URLs and Routing in the Odoo 17 Website App
 
Kisan Call Centre - To harness potential of ICT in Agriculture by answer farm...
Kisan Call Centre - To harness potential of ICT in Agriculture by answer farm...Kisan Call Centre - To harness potential of ICT in Agriculture by answer farm...
Kisan Call Centre - To harness potential of ICT in Agriculture by answer farm...
 
Staff of Color (SOC) Retention Efforts DDSD
Staff of Color (SOC) Retention Efforts DDSDStaff of Color (SOC) Retention Efforts DDSD
Staff of Color (SOC) Retention Efforts DDSD
 
1029 - Danh muc Sach Giao Khoa 10 . pdf
1029 -  Danh muc Sach Giao Khoa 10 . pdf1029 -  Danh muc Sach Giao Khoa 10 . pdf
1029 - Danh muc Sach Giao Khoa 10 . pdf
 
CARE OF CHILD IN INCUBATOR..........pptx
CARE OF CHILD IN INCUBATOR..........pptxCARE OF CHILD IN INCUBATOR..........pptx
CARE OF CHILD IN INCUBATOR..........pptx
 
Introduction to ArtificiaI Intelligence in Higher Education
Introduction to ArtificiaI Intelligence in Higher EducationIntroduction to ArtificiaI Intelligence in Higher Education
Introduction to ArtificiaI Intelligence in Higher Education
 
TataKelola dan KamSiber Kecerdasan Buatan v022.pdf
TataKelola dan KamSiber Kecerdasan Buatan v022.pdfTataKelola dan KamSiber Kecerdasan Buatan v022.pdf
TataKelola dan KamSiber Kecerdasan Buatan v022.pdf
 
Código Creativo y Arte de Software | Unidad 1
Código Creativo y Arte de Software | Unidad 1Código Creativo y Arte de Software | Unidad 1
Código Creativo y Arte de Software | Unidad 1
 
How to Make a Pirate ship Primary Education.pptx
How to Make a Pirate ship Primary Education.pptxHow to Make a Pirate ship Primary Education.pptx
How to Make a Pirate ship Primary Education.pptx
 
Beyond the EU: DORA and NIS 2 Directive's Global Impact
Beyond the EU: DORA and NIS 2 Directive's Global ImpactBeyond the EU: DORA and NIS 2 Directive's Global Impact
Beyond the EU: DORA and NIS 2 Directive's Global Impact
 
POINT- BIOCHEMISTRY SEM 2 ENZYMES UNIT 5.pptx
POINT- BIOCHEMISTRY SEM 2 ENZYMES UNIT 5.pptxPOINT- BIOCHEMISTRY SEM 2 ENZYMES UNIT 5.pptx
POINT- BIOCHEMISTRY SEM 2 ENZYMES UNIT 5.pptx
 
Software Engineering Methodologies (overview)
Software Engineering Methodologies (overview)Software Engineering Methodologies (overview)
Software Engineering Methodologies (overview)
 
Privatization and Disinvestment - Meaning, Objectives, Advantages and Disadva...
Privatization and Disinvestment - Meaning, Objectives, Advantages and Disadva...Privatization and Disinvestment - Meaning, Objectives, Advantages and Disadva...
Privatization and Disinvestment - Meaning, Objectives, Advantages and Disadva...
 
Student login on Anyboli platform.helpin
Student login on Anyboli platform.helpinStudent login on Anyboli platform.helpin
Student login on Anyboli platform.helpin
 
Interactive Powerpoint_How to Master effective communication
Interactive Powerpoint_How to Master effective communicationInteractive Powerpoint_How to Master effective communication
Interactive Powerpoint_How to Master effective communication
 
18-04-UA_REPORT_MEDIALITERAСY_INDEX-DM_23-1-final-eng.pdf
18-04-UA_REPORT_MEDIALITERAСY_INDEX-DM_23-1-final-eng.pdf18-04-UA_REPORT_MEDIALITERAСY_INDEX-DM_23-1-final-eng.pdf
18-04-UA_REPORT_MEDIALITERAСY_INDEX-DM_23-1-final-eng.pdf
 
Organic Name Reactions for the students and aspirants of Chemistry12th.pptx
Organic Name Reactions  for the students and aspirants of Chemistry12th.pptxOrganic Name Reactions  for the students and aspirants of Chemistry12th.pptx
Organic Name Reactions for the students and aspirants of Chemistry12th.pptx
 

Stattistic ii - mode, median, mean

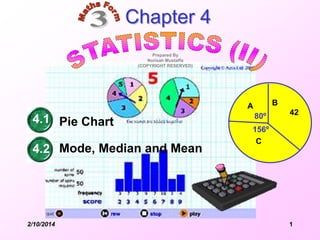
  • 1. Chapter 4 Prepared By Norisah Mustaffa (COPYRIGHT RESERVED) B A 4.1 Pie Chart 4.2 Mode, Median and Mean 2/10/2014 80º 42 156º C 1
  • 2. 4.2 MODE, MEDIAN AND MEAN Mod, median and mean are three types of averages commonly used in statistics. These averages are also called the measures of central tendency. MODE A Determining The Mode For A Set Of Data Mode is the most common fact or value with the highest frequency in a set of data. Example 1: Find the mode for the numbers : 6, 3, 5, 6, 3, 8, 2, 6 and 9 Solution: Mode = 6, frequency = 3 The number 6 occurs thrice. All the other numbers occur not more then thrice. 6 is the highest frequency. 2/10/2014 2
  • 3. MODE A Determining The Mode For A Set Of Data Mode is the most common fact or value with the highest frequency in a set of data. Example 2: Find the mode(s) for the numbers : 3, 5, 0, 9, 1, 2 and 4. Solution: Mode = No mode Each number appears only once. Every number has the same frequency. 2/10/2014 3
  • 4. MODE B Determining The Mode And Its Corresponding Frequency From Pictograms, Bar Charts, Line Graphs And Pie Charts The Mode and its corresponding frequency in a set of data can be obtained from pictograms, bar charts, line graphs and pie charts. Number of Students 120  100 Solution: Mode is Gred C 80 Frequency of mode = 120 students 60 40 20 0 2/10/2014 A B C D Gred 4
  • 5. MEDIAN C Determining The Median For A Set Of Data Median is the middle value in a set of values arranged in order of magnitude. 1, 3, 5, 7, 9, 11….. For an odd number of values arranged in order of magnitude, the median is the middle value. Example: Find the median of the following data. 2, 5, 0, 7, 3, 1, 6, 7. Solution: Rearrange the data in asscending order. 3 is the middle, Hence, the median is 3 2/10/2014 5
  • 6. MEDIAN C Determining The Median For A Set Of Data Median is the middle value in a set of values arranged in order of 2, 4, 6, 8, 10….. magnitude. For an even number of values arranged in order of magnitude, the median is the mean of the two middle values. Example: Find the median of the following data. 15, 10, 9, 13, 26, 18, Solution: Rearrange the data in asscending order. 13 and 15 are the two middle values, Hence, the median is (13 + 15) 2 = 28 2 = 14 2/10/2014 6
  • 7. MEAN E Calculating The Mean For A Set Of Data 1. Method to calculate the mean for a set of data. Mean is the average value for a set of data. Mean = Sum of data values Number of values Example: Find the mean of the following data. 12, 24, 23, 24, 17, 20. Mean = 12 + 24 + 23 + 24 + 17 + 20 6 = 120 6 = 20 2/10/2014 7
  • 8. Thank You If at first you don't succeed ... transform your data set. 2/10/2014 8