Time Series Estimation of Gas Furnace Data in IMPL and CPLEX Industrial Modeling Framework (TSE-GFD-IMF)

Presented in this short document is a description of how to estimate a deterministic and stochastic time-series transfer function models in IMPL using IBM’s CPLEX applied to industrial gas furnace data. The methodology of time-series analysis involves essentially three (3) stages (Box and Jenkins, 1976): (1) model structure identification, (2) model parameter estimation and (3) model checking and diagnostics. We do not address (1) which requires stationarity and seasonality assessment, auto-, cross- and partial-correlation, etc. to establish the transfer function polynomial degrees. Instead we focus only on the parameter estimation and diagnostics. These types of parameter estimation problems involve dynamic and nonlinear relationships shown below and we solve these using IMPL’s nonlinear programming algorithm SLPQPE which uses CPLEX 12.6 as the QP sub-solver.

Recomendados
Recomendados
Mais conteúdo relacionado
Mais procurados
Mais procurados (20)
Destaque
Destaque (20)
Semelhante a Time Series Estimation of Gas Furnace Data in IMPL and CPLEX Industrial Modeling Framework (TSE-GFD-IMF)
Semelhante a Time Series Estimation of Gas Furnace Data in IMPL and CPLEX Industrial Modeling Framework (TSE-GFD-IMF) (20)
Mais de Alkis Vazacopoulos
Mais de Alkis Vazacopoulos (20)
Último
Último (20)
Time Series Estimation of Gas Furnace Data in IMPL and CPLEX Industrial Modeling Framework (TSE-GFD-IMF)
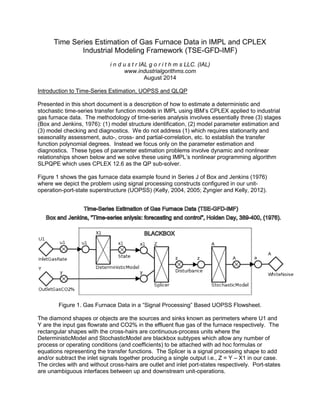
- 1. Time Series Estimation of Gas Furnace Data in IMPL and CPLEX Industrial Modeling Framework (TSE-GFD-IMF) i n d u s t r IAL g o r i t h m s LLC. (IAL) www.industrialgorithms.com August 2014 Introduction to Time-Series Estimation, UOPSS and QLQP Presented in this short document is a description of how to estimate a deterministic and stochastic time-series transfer function models in IMPL using IBM’s CPLEX applied to industrial gas furnace data. The methodology of time-series analysis involves essentially three (3) stages (Box and Jenkins, 1976): (1) model structure identification, (2) model parameter estimation and (3) model checking and diagnostics. We do not address (1) which requires stationarity and seasonality assessment, auto-, cross- and partial-correlation, etc. to establish the transfer function polynomial degrees. Instead we focus only on the parameter estimation and diagnostics. These types of parameter estimation problems involve dynamic and nonlinear relationships shown below and we solve these using IMPL’s nonlinear programming algorithm SLPQPE which uses CPLEX 12.6 as the QP sub-solver. Figure 1 shows the gas furnace data example found in Series J of Box and Jenkins (1976) where we depict the problem using signal processing constructs configured in our unit- operation-port-state superstructure (UOPSS) (Kelly, 2004, 2005; Zyngier and Kelly, 2012). Figure 1. Gas Furnace Data in a “Signal Processing” Based UOPSS Flowsheet. The diamond shapes or objects are the sources and sinks known as perimeters where U1 and Y are the input gas flowrate and CO2% in the effluent flue gas of the furnace respectively. The rectangular shapes with the cross-hairs are continuous-process units where the DeterministicModel and StochasticModel are blackbox subtypes which allow any number of process or operating conditions (and coefficients) to be attached with ad hoc formulas or equations representing the transfer functions. The Splicer is a signal processing shape to add and/or subtract the inlet signals together producing a single output i.e., Z = Y – X1 in our case. The circles with and without cross-hairs are outlet and inlet port-states respectively. Port-states are unambiguous interfaces between up and downstream unit-operations.
- 2. The deterministic transfer function model in discrete-time or difference form (versus z-transform or backwards-shift operator-based quotients of rational polynomials) is defined as follows: X1,0 = W0*U1,1+W1*U1,2+W2*U1,3+W3*U1,4+W4*U1,5+W5*U1,6+W6*U1,7+W7*U1,8+W8*U1,9 + D1*X1,1+D2*X1,2 where U1,{1,2,3,4,5,6,7,8,9} are the exogenous input signals minus its mean of -0.057 at time- periods t-1, t-2, …, t-9 and X1,{0,1,2} are the deterministic states at time-periods t-0, t-1 and t-2. The corresponding numerator parameters or coefficients are W0, W1, …, W8 (“omega” in Box and Jenkins, 1976) and the denominator parameters are D1 and D2 (“delta”). There is no U1,0 given that there is always at least one (1) time-period of pure sampling delay or lag when modeled using discrete-time. We have included extra numerator parameters from those used by Box and Jenkins (1976) so that the user, modeler or analyst may select manually how many time-periods of pure time-delay to include i.e., setting W0, W1, etc. to zero (0.0). Although the time-series U1 is a constant in the data regression, X1 is not, so D1 * X1,1 for example is a bilinear or nonlinear term since both D1 and X1 are variables. Any number of exogenous inlet signals can be configured to the DeterministicModel unit-operation simply by adding more inlet port-states with corresponding formulas i.e., U2, U3, etc. The stochastic transfer function model or unmeasured noise disturbance model is defined as follows: Z,0 = A,0-T1*A,1-T2*A,2 + P1*Z,1+P2*Z,2 where A,{0,1,2} are the white-noise input signals and Z,{0,1,2,3} are the stochastic states which are equal to Z,0 = Y,0 – X1,0 and the time-series Y,0 is also minus its mean of 53.51. The corresponding numerator parameters are T1 and T2 (“theta”, moving-average terms) and the denominator parameters are P1 and P2 (“phi”, auto-regressive terms). We have included two extra numerator parameters (T1 and T2) from those used in Box and Jenkins (1976) and as mentioned these can be included or excluded from the data regression or time-series estimation by simply setting them to zero (0.0) manually. It should be noted that both time-series Z and A are variables which again results in a nonlinear parameter estimation problem. It is well known that when moving-average terms (T1 and T2) are present in the transfer function then no re- arrangement of the two transfer function models can be made to make the problem linear as is the case with only auto-regressive stochastic terms (P1 and P2). From a quantity-logic-quality phenomena (QLQP) perspective, the time-series U1, Y, Z and A found in Figure 1 are considered as flows or more appropriately signal-flows or data. However, in our IML implementation found in Appendix A we collapse the three (3) continuous-processes into one blackbox model as shown by the dotted-line box in Figure 1 where the flows of U1, Y, Z and A are now considered as conditions and the W, D, T and P parameters are static coefficients in the IMPL semantics. Industrial Modeling Framework (IMF), IMPL and SSIIMPLE To implement the mathematical formulation of this and other systems, IAL offers a unique approach and is incorporated into our Industrial Modeling Programming Language we call IMPL. IMPL has its own modeling language called IML (short for Industrial Modeling Language) which is a flat or text-file interface as well as a set of API's which can be called from any computer programming language such as C, C++, Fortran, C#, VBA, Java (SWIG), Python (CTYPES) and/or Julia (CCALL) called IPL (short for Industrial Programming Language) to both build the
- 3. model and to view the solution. Models can be a mix of linear, mixed-integer and nonlinear variables and constraints and are solved using a combination of LP, QP, MILP and NLP solvers such as COINMP, GLPK, LPSOLVE, SCIP, CPLEX, GUROBI, LINDO, XPRESS, CONOPT, IPOPT, KNITRO and WORHP as well as our own implementation of SLP called SLPQPE (Successive Linear & Quadratic Programming Engine) which is a very competitive alternative to the other nonlinear solvers and embeds all available LP and QP solvers. In addition and specific to DRR problems, we also have a special solver called SECQPE standing for Sequential Equality-Constrained QP Engine which computes the least-squares solution and a post-solver called SORVE standing for Supplemental Observability, Redundancy and Variability Estimator to estimate the usual DRR statistics. SECQPE also includes a Levenberg-Marquardt regularization method for nonlinear data regression problems and can be presolved using SLPQPE i.e., SLPQPE warm-starts SECQPE. SORVE is run after the SECQPE solver and also computes the well-known "maximum-power" gross-error statistics (measurement and nodal/constraint tests) to help locate outliers, defects and/or faults i.e., mal- functions in the measurement system and mis-specifications in the logging system. The underlying system architecture of IMPL is called SSIIMPLE (we hope literally) which is short for Server, Solvers, Interfacer (IML), Interacter (IPL), Modeler, Presolver Libraries and Executable. The Server, Solvers, Presolver and Executable are primarily model or problem- independent whereas the Interfacer, Interacter and Modeler are typically domain-specific i.e., model or problem-dependent. Fortunately, for most industrial planning, scheduling, optimization, control and monitoring problems found in the process industries, IMPL's standard Interfacer, Interacter and Modeler are well-suited and comprehensive to model the most difficult of production and process complexities allowing for the formulations of straightforward coefficient equations, ubiquitous conservation laws, rigorous constitutive relations, empirical correlative expressions and other necessary side constraints. User, custom, adhoc or external constraints can be augmented or appended to IMPL when necessary in several ways. For MILP or logistics problems we offer user-defined constraints configurable from the IML file or the IPL code where the variables and constraints are referenced using unit-operation-port-state names and the quantity-logic variable types. It is also possible to import a foreign *.ILP file (row-based MPS file) which can be generated by any algebraic modeling language or matrix generator. This file is read just prior to generating the matrix and before exporting to the LP, QP or MILP solver. For NLP or quality problems we offer user-defined formula configuration in the IML file and single-value and multi-value function blocks writable in C, C++ or Fortran. The nonlinear formulas may include intrinsic functions such as EXP, LN, LOG, SIN, COS, TAN, MIN, MAX, IF, NOT, EQ, NE, LE, LT, GE, GT and CIP, LIP, SIP and KIP (constant, linear and monotonic spline interpolations) as well as user-written extrinsic functions (XFCN). It is also possible to import another type of foreign file called the *.INL file where both linear and nonlinear constraints can be added easily using new or existing IMPL variables. Industrial modeling frameworks or IMF's are intended to provide a jump-start to an industrial project implementation i.e., a pre-project if you will, whereby pre-configured IML files and/or IPL code are available specific to your problem at hand. The IML files and/or IPL code can be easily enhanced, extended, customized, modified, etc. to meet the diverse needs of your project and as it evolves over time and use. IMF's also provide graphical user interface prototypes for drawing the flowsheet as in Figure 1 and typical Gantt charts and trend plots to view the solution of quantity, logic and quality time-profiles. Current developments use Python 2.3 and 2.7 integrated with open-source Gnome Dia and Matplotlib modules respectively but other
- 4. prototypes embedded within Microsoft Excel/VBA for example can be created in a straightforward manner. However, the primary purpose of the IMF's is to provide a timely, cost-effective, manageable and maintainable deployment of IMPL to formulate and optimize complex industrial manufacturing systems in either off-line or on-line environments. Using IMPL alone would be somewhat similar (but not as bad) to learning the syntax and semantics of an AML as well as having to code all of the necessary mathematical representations of the problem including the details of digitizing your data into time-points and periods, demarcating past, present and future time-horizons, defining sets, index-sets, compound-sets to traverse the network or topology, calculating independent and dependent parameters to be used as coefficients and bounds and finally creating all of the necessary variables and constraints to model the complex details of logistics and quality industrial optimization problems. Instead, IMF's and IMPL provide, in our opinion, a more elegant and structured approach to industrial modeling and solving so that you can capture the benefits of advanced decision-making faster, better and cheaper. Time-Series Estimation of Gas Furnace Data Synopsis From Box and Jenkins (1976) page 396, their parameter values with two (2) times standard error confidence intervals are: W0 = 0.0 W1 = 0.0 W2 = -0.53 +/- 0.16 W3 = -0.37 +/- 0.30 W4 = -0.51 +/- 0.32 W5 = 0.0 W6 = 0.0 W7 = 0.0 W8 = 0.0 D1 = 0.57 +/- 0.10 D2 = 0.01 +/- 0.28 T1 = 0.0 T2 = 0.0 P1 = 1.53 +/- 0.10 P2 = -0.63 +/- 0.10 Their objective function value computed is 16.60 in nine (9) iterations of a home-grown Levenberg-Marquardt algorithm using relatively good initial-values or starting-points from their model structure identification. Their reported standard error residual is 16.60/296 = 0.0561 which approximates to the standard deviation of the (hopefully) white-noise residuals i.e., time- series A. The objective function is simply a sum of squared residuals and in our formulation translates into directly minimizing the sum of squared values for time-series A which is expected to have a mean of zero (0). Ideally A should be independent, identically and normally distributed and if so, then the parameter estimates are declared to be statistically unbiased – see their post diagnostic checking on the regression residuals. In contrast, solving in IMPL using SLPQPE with CPLEX as the QP sub-solver and starting with zeros (0) as initial-values for all conditions (X1, Z and A) and coefficients (W, D, T and P), we arrive at a solution taking sixteen (16) iterations in less than one (1) second with an objective function of 16.67 which is 0.07/16.60*100 = 0.42% different from above. This is attributed to the data truncation errors for the U1 and Y time-series data provided.
- 5. The estimated coefficients from IMPL are as follows with 95% confidence-intervals: W0 = 0.0 W1 = 0.0 W2 = -0.53 +/- 0.15 W3 = -0.39 +/- 0.28 W4 = -0.52 +/- 0.29 W5 = 0.0 W6 = 0.0 W7 = 0.0 W8 = 0.0 D1 = 0.54 +/- 0.38 D2 = 0.01 +/- 0.26 T1 = 0.0 T2 = 0.0 P1 = 1.52 +/- 0.10 P2 = -0.62 +/- 0.10 All of the parameter values are reasonably close except that the variance for D1 is considerably larger than the variance computed by Box and Jenkins (1976) and we have no apparent explanation for this. The variance calculations were performed at the converged solution point using IMPL’s data reconciliation and regression sensitivity engine SORVE which computes observability, redundancy and variability estimates (Kelly, 1998) similar to the Error-in-Variables Method (EVM). Given that we are using a quadratic programming code (CPLEX-QP) to solve this time-series estimation problem, we can also add useful inequalities or model-cuts to the formulation. In fact, we did this for stability of the second-order denominator terms in both the deterministic and stochastic transfer functions (see Appendix A for D1STABILITY, etc.) as follows: D2 + D1 <= 1.0 D2 – D1 <= 1.0 P2 + P1 <= 1.0 P2 – P1 <= 1.0 These linear constraints help to steer or maneuver the path to a feasible/stable solution given that unfortunately transfer function estimation problems with moving-average terms are inherently nonlinear as well as being non-convex and local optima may result. In summary, we have highlighted the application of time-series estimation using the industrial gas furnace data (Series J) from Box and Jenkins (1976). The model was formulated in IMPL and solved successfully using its successive linear programming and quadratic programming engine SLPQPE with the CPLEX 12.6 as its fast and reliable QP sub-solver. References Box, G.E.P., Jenkins, G.M., “Time-series analysis: forecasting and control”, revised edition, Holden Day, Oakland, CA, 389-400 and Series J. (1976). Kelly, J.D., "A regularization approach to the reconciliation of constrained data sets", Computers & Chemical Engineering, 1771, (1998).
- 6. Kelly, J.D., "Production modeling for multimodal operations", Chemical Engineering Progress, February, 44, (2004). Kelly, J.D., "The unit-operation-stock superstructure (UOSS) and the quantity-logic-quality paradigm (QLQP) for production scheduling in the process industries", In: MISTA 2005 Conference Proceedings, 327, (2005). Zyngier, D., Kelly, J.D., "UOPSS: a new paradigm for modeling production planning and scheduling systems", ESCAPE 22, June, (2012). Appendix A – TSE-GFD-IMF.IML File i M P l (c) Copyright and Property of i n d u s t r I A L g o r i t h m s LLC. !!!!!!!!!!!!!!!!!!!!!!!!!!!!!!!!!!!!!!!!!!!!!!!!!!!!!!!!!!!!!!!!!!!!!!!!!!!!!!!! ! Calculation Data (Parameters) !!!!!!!!!!!!!!!!!!!!!!!!!!!!!!!!!!!!!!!!!!!!!!!!!!!!!!!!!!!!!!!!!!!!!!!!!!!!!!!! &sCalc,@sValue START,0.0 BEGIN,7.0 END,296.0 PERIOD,1.0 SE,1.0 ! 0.0561 = 16.6/296 LRGBND,1d+2 w0bnd,0 w1bnd,0 w2bnd,5 w3bnd,5 w4bnd,5 w5bnd,0 w6bnd,0 w7bnd,0 w8bnd,0 d1bnd,5 d2bnd,5 t1bnd,0 t2bnd,0 p1bnd,5 p2bnd,5 &sCalc,@sValue !!!!!!!!!!!!!!!!!!!!!!!!!!!!!!!!!!!!!!!!!!!!!!!!!!!!!!!!!!!!!!!!!!!!!!!!!!!!!!!! ! Chronological Data (Periods) !!!!!!!!!!!!!!!!!!!!!!!!!!!!!!!!!!!!!!!!!!!!!!!!!!!!!!!!!!!!!!!!!!!!!!!!!!!!!!!! @rPastTHD,@rFutureTHD,@rTPD START,END,PERIOD @rPastTHD,@rFutureTHD,@rTPD !!!!!!!!!!!!!!!!!!!!!!!!!!!!!!!!!!!!!!!!!!!!!!!!!!!!!!!!!!!!!!!!!!!!!!!!!!!!!!!! ! Constant Data (Parameters) !!!!!!!!!!!!!!!!!!!!!!!!!!!!!!!!!!!!!!!!!!!!!!!!!!!!!!!!!!!!!!!!!!!!!!!!!!!!!!!! &sData,@sValue u1,-0.052 ,0.057 ,0.235 ,0.396 ,0.43 ,0.498 ,0.518 ,0.405 ,0.184 ,-0.123 ,-0.531 ,-0.998 ,-1.364 ,-1.463 ,-1.245 ,-0.757 ,-0.418 ,-0.136 ,0.145 ,0.492 ,0.828 ,0.923 ,0.932 ,0.948
- 13. !!!!!!!!!!!!!!!!!!!!!!!!!!!!!!!!!!!!!!!!!!!!!!!!!!!!!!!!!!!!!!!!!!!!!!!!!!!!!!!! ! Construction Data (Pointers) !!!!!!!!!!!!!!!!!!!!!!!!!!!!!!!!!!!!!!!!!!!!!!!!!!!!!!!!!!!!!!!!!!!!!!!!!!!!!!!! &sUnit,&sOperation,@sType,@sSubtype,@sUse BLACKBOX,,processc,blackbox,, &sUnit,&sOperation,@sType,@sSubtype,@sUse !!!!!!!!!!!!!!!!!!!!!!!!!!!!!!!!!!!!!!!!!!!!!!!!!!!!!!!!!!!!!!!!!!!!!!!!!!!!!!!! ! Condition Data (Properties) !!!!!!!!!!!!!!!!!!!!!!!!!!!!!!!!!!!!!!!!!!!!!!!!!!!!!!!!!!!!!!!!!!!!!!!!!!!!!!!! &sCondition Y U1 X1 Z A D1STABILITY D2STABILITY P1STABILITY P2STABILITY &sCondition &sCoefficient,@sType,@sPath_Name,@sLibrary_Name,@sFunction_Name,@iNumber_Conditions,@rPerturb_Size,@sCondition_Names w0,static w1,static w2,static w3,static w4,static w5,static w6,static w7,static w8,static d1,static d2,static t1,static t2,static p1,static p2,static &sCoefficient,@sType,@sPath_Name,@sLibrary_Name,@sFunction_Name,@iNumber_Conditions,@rPerturb_Size,@sCondition_Names &sUnit,&sOperation,&sCondition,@rCondition_Lower,@rCondition_Upper,@rCondition_Target BLACKBOX,,Y,-LRGBND,LRGBND, BLACKBOX,,U1,-LRGBND,LRGBND, BLACKBOX,,X1,-LRGBND,LRGBND, BLACKBOX,,Z,-LRGBND,LRGBND, BLACKBOX,,A,-LRGBND,LRGBND, BLACKBOX,,D1STABILITY,-LRGBND,1.0, BLACKBOX,,D2STABILITY,-LRGBND,1.0, BLACKBOX,,P1STABILITY,-LRGBND,1.0, BLACKBOX,,P2STABILITY,-LRGBND,1.0, &sUnit,&sOperation,&sCondition,@rCondition_Lower,@rCondition_Upper,@rCondition_Target &sUnit,&sOperation,&sCoefficient,@rCoefficient_Lower,@rCoefficient_Upper,@rCoefficient_Target BLACKBOX,,w0,-w0bnd,w0bnd, BLACKBOX,,w1,-w1bnd,w1bnd, BLACKBOX,,w2,-w2bnd,w2bnd, BLACKBOX,,w3,-w3bnd,w3bnd, BLACKBOX,,w4,-w4bnd,w4bnd, BLACKBOX,,w5,-w5bnd,w5bnd, BLACKBOX,,w6,-w6bnd,w6bnd, BLACKBOX,,w7,-w7bnd,w7bnd, BLACKBOX,,w8,-w8bnd,w8bnd, BLACKBOX,,d1,-d1bnd,d1bnd, BLACKBOX,,d2,-d2bnd,d2bnd, BLACKBOX,,t1,-t1bnd,t1bnd, BLACKBOX,,t2,-t2bnd,t2bnd, BLACKBOX,,p1,-p1bnd,p1bnd, BLACKBOX,,p2,-p2bnd,p2bnd, &sUnit,&sOperation,&sCoefficient,@rCoefficient_Lower,@rCoefficient_Upper,@rCoefficient_Target Conditions-&sMacro,@sValue X1, w0*U1[1] - w1*U1[2] - w2*U1[3] - w3*U1[4] - w4*U1[5] - w5*U1[6] - w6*U1[7] - w7*U1[8] - w8*U1[9] + d1*X1[1] + d2*X1[2] Z, Y - X1 A, t1*A[1] + t2*A[2] + Z[0] - p1*Z[1] - p2*Z[2] D1STABILITY, d2 + d1 D2STABILITY, d2 - d1 P1STABILITY, p2 + p1 P2STABILITY, p2 - p1 Conditions-&sMacro,@sValue ConditionsUOCondition-&sUnit,&sOperation,&sCondition,@sType,@rValue,@sValue BLACKBOX,,X1,?,3,X1 BLACKBOX,,Z,?,3,Z BLACKBOX,,A,?,3,A BLACKBOX,,D1STABILITY,?,3,D1STABILITY BLACKBOX,,D2STABILITY,?,3,D2STABILITY BLACKBOX,,P1STABILITY,?,3,P1STABILITY BLACKBOX,,P2STABILITY,?,3,P2STABILITY ConditionsUOCondition-&sUnit,&sOperation,&sCondition,@sType,@rValue,@sValue !!!!!!!!!!!!!!!!!!!!!!!!!!!!!!!!!!!!!!!!!!!!!!!!!!!!!!!!!!!!!!!!!!!!!!!!!!!!!!!! ! Cost Data (Pricing)
- 14. !!!!!!!!!!!!!!!!!!!!!!!!!!!!!!!!!!!!!!!!!!!!!!!!!!!!!!!!!!!!!!!!!!!!!!!!!!!!!!!! &sUnit,&sOperation,&sCondition,@rConditionPro_Weight,@rConditionPer1_Weight,@rConditionPer2_Weight,@rConditionPen_Weight BLACKBOX,,A,,,1.0/SE, &sUnit,&sOperation,&sCondition,@rConditionPro_Weight,@rConditionPer1_Weight,@rConditionPer2_Weight,@rConditionPen_Weight !!!!!!!!!!!!!!!!!!!!!!!!!!!!!!!!!!!!!!!!!!!!!!!!!!!!!!!!!!!!!!!!!!!!!!!!!!!!!!!! ! Command Data (Future Provisos) !!!!!!!!!!!!!!!!!!!!!!!!!!!!!!!!!!!!!!!!!!!!!!!!!!!!!!!!!!!!!!!!!!!!!!!!!!!!!!!! &sUnit,&sOperation,@rSetup_Lower,@rSetup_Upper,@rBegin_Time,@rEnd_Time BLACKBOX,,1,1,START,END &sUnit,&sOperation,@rSetup_Lower,@rSetup_Upper,@rBegin_Time,@rEnd_Time &sUnit,&sOperation,&sCondition,@rCondition_Lower,@rCondition_Upper,@rCondition_Target,@rBegin_Time,@rEnd_Time BLACKBOX,,U1,u1,u1,,START,PERIOD BLACKBOX,,Y,y,y,,START,PERIOD BLACKBOX,,A,-1000,1000,,START,BEGIN ,,A,-1000,1000,0.0,BEGIN,END &sUnit,&sOperation,&sCondition,@rCondition_Lower,@rCondition_Upper,@rCondition_Target,@rBegin_Time,@rEnd_Time