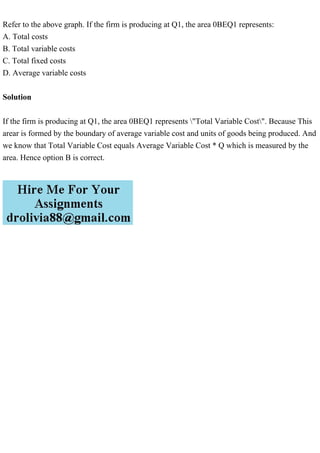
Refer to the above graph. If the firm is producing at Q1, the area 0BEQ1 represents:
A. Total costs
B. Total variable costs
C. Total fixed costs
D. Average variable costs
Solution
If the firm is producing at Q1, the area 0BEQ1 represents \"Total Variable Cost\". Because This
arear is formed by the boundary of average variable cost and units of goods being produced. And
we know that Total Variable Cost equals Average Variable Cost * Q which is measured by the
area. Hence option B is correct..
Refer to the above graph. If the firm is producing at Q1, the area 0.pdf
1. Refer to the above graph. If the firm is producing at Q1, the area 0BEQ1 represents:
A. Total costs
B. Total variable costs
C. Total fixed costs
D. Average variable costs
Solution
If the firm is producing at Q1, the area 0BEQ1 represents "Total Variable Cost". Because This
arear is formed by the boundary of average variable cost and units of goods being produced. And
we know that Total Variable Cost equals Average Variable Cost * Q which is measured by the
area. Hence option B is correct.