
Recomendados
Mais conteúdo relacionado
Mais procurados
Mais procurados (20)
Semelhante a Ecg
Semelhante a Ecg (20)
Mais de akifab93
Mais de akifab93 (20)
Último
Último (20)
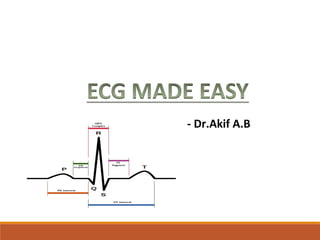
Ecg
- 5. P-waves P-waves represent atrial depolarisation. In sinus rhythm, there should be a P-wave preceding each QRS complex. PR interval The PR-interval is from the start of the P-wave to the start of the Q wave. It represents the time taken for electrical activity to move between the atria and ventricles. QRS complex The QRS-complex represents depolarisation of the ventricles. It is seen as three closely related waves on the ECG (Q,R and S wave).
- 6. QT-interval The QT-interval starts at the beginning of the QRS complex and finishes at the end of the T-wave. It represents the time taken for the ventricles to depolarise and then repolarise. T-wave The T-wave represents ventricular repolarisation. It is seen as a small wave after the QRS complex. ST segment The ST-segment starts at the end of the S-wave and finishes at the start of the T- wave. The ST segment is an isoelectric line that represents the time between depolarization and repolarization of the ventricles (i.e. contraction).
- 7. V1 – 4th intercostal space – right sternal edge V2 – 4th intercostal space – left sternal edge V3 – midway between V2 and V4 V4 – 5th intercostal space – midclavicular line V5 – left anterior axillary line – same horizontal level as V4 V6 – left mid-axillary line – same horizontal level as V4 & V5 CHEST ELECTRODES POSITIONS
- 9. V1 Septal view of heart V2 Septal view of heart V3 Anterior view of heart V4 Anterior view of heart V5 Lateral view of heart V6 Lateral view of heart
- 10. LIMB ELECTRODES LA left arm RA right arm LL left leg RL right leg – neutral – not used in measurements
- 11. OTHER LEADS Lead I Lateral view (RA-LA) Lead II Inferior view (RA-LL) Lead III Inferior view (LA-LL) aVR Lateral view (LA+LL – RA) aVL Lateral view (RA+LL – LA) aVF Inferior view (RA+LA – LL )
- 13. -Each small square represents 0.04 seconds -Each large square on the paper represents 0.2 seconds -5 large squares therefore = 1 second - 300 large squares = 1 minute HOW TO READ ECG PAPER
- 14. The shape of the ECG waveform -When the electrical activity of the heart travels towards a lead you get a positive deflection. - When the electrical activity travels away from a lead you get a negative deflection. Electrical activity in the heart flows in many directions at once. The wave seen represents the average direction. The height of the deflection also represents the amount of electricity flowing in that direction. The lead with the most positive deflection is closest to the direction the hearts electricity is flowing. If the R-wave is greater than the S-wave it suggests depolarisation is moving towards that lead. If the S-wave is greater than the R-waves it suggests depolarisation is moving away from that lead. If the R and S-waves are of equal size it means depolarisation is travelling at exactly 90° to that lead.
- 15. In healthy individuals you would expect the axis to lie between -30° and +90º. The overall direction of electrical activity is towards leads I,II and III (the yellow arrow below). As a result you see a positive deflection in all these leads, with lead II showing the most positive deflection as it is the most closely aligned to the overall direction of electrical spread.
- 16. You would expect to see the most negative deflection in aVR. This is due to aVR looking at the heart in the opposite direction to the overall electrical activity.
- 17. Right axis deviation Right axis deviation (RAD) is usually caused by right ventricular hypertrophy. In right axis deviation the overall direction of electrical activity is distorted to the right (between +90º and +180º). Extra heart muscle causes a stronger positive signal to be be picked up by leads looking at the right side of the heart. This causes the deflection in lead I to become more negative and the deflection in III to be more positive. RAD is associated with pulmonary conditions as they put strain on the right side of the heart. It can also be a normal finding in very tall individuals
- 18. deflection in lead I to become more negative and the deflection in III to be more positive. RIGHT AXIS DEVIATION Normally : Lead II is more positive than Lead I & III
- 19. In left axis deviation (LAD) the direction of overall electrical activity becomes distorted to the left (between -30° and -90°). This causes the deflection in lead I to become more positive and the deflection in III to be more negative. LAD is usually caused by conduction defects and not by increased mass of the left ventricle. LEFT AXIS DEVIATION
- 20. Normal Cardiac axis Right axis deviation Left axis deviation Lead II is more positive than Lead I & III Lead III is more positive than Lead I & II Lead I is more positive and Lead II & III are negative Normal Cardiac axis Right axis deviation Left axis deviation
- 21. The mnemonic RRAW can help you remember what you should be looking for and in what order: Rate Rhythm Axis Waveform (the various parts of the ECG mentioned above) Reading ECGs
- 22. Heart rate can be calculated simply with the following method: Work out the number of large squares in one R-R interval Then divide 300 by this number and you have your answer e.g. if there are 4 squares in an R-R interval 300/4 = 75 beats per minute RATE
- 23. Look at the R-R intervals again – if they are equally spaced from each other the rhythm is regular. If not the rhythm is irregular. You can use the ‘card method’ to mark out the distance between each R wave to check the spacing. An irregular rhythm with no distinct P-waves suggests atrial fibrillation. RHYTHM
- 24. Cardiac axis describes the overall direction of electrical spread within the heart. In a healthy individual the axis should spread from 11 o’clock to 5 o’clock. To figure out the cardiac axis you need to look at leads I,II and III. AXIS
- 25. Normal cardiac axis In normal cardiac axis Lead II has the most pos itive deflection compared to Leads I and III Right axis deviation In right axis deviation Lead III has the most positive deflection and Lead I should be negative. This is commonly seen in individuals with right ventricular hypertrophy. Left axis deviation In left axis deviation Lead I has the most positive deflection and Leads II and III are negative. Left axis deviation can suggest underlying heart conduction system defects.
- 26. Normal duration = 120 msec Represents Atrial Depolarisation
- 27. P-waves represent atrial depolarisation. In sinus rhythm, there should be a P-wave preceding each QRS complex. Look at the p waves and comment on a number of things: •Are P-waves present? •Do they occur regularly? •Is there sinus rhythm (does a P-wave precede each QRS complex?) •Do the P-waves look normal? (smooth, rounded and upright) •If P-waves are absent and there is an irregular rhythm it may suggest atrial fibrillation. P-waves
- 28. Seen in MITRAL STENOSIS P-PULMONALE Seen in Right Atrial Hypertrophy P-MITRALE
- 29. The P-R interval should be between 0.12-0.2 seconds (3-5 small squares). P-R INTERVAL Normal duration = 120- 200 msec PR interval The PR-interval is from the start of the P-wave to the start of the Q wave. It represents the time taken for electrical activity to move between the atria and ventricles. Short PR Interval (<120msec) Prolonged PR Interval (>200msec) Tachycardia Heart Blocks Wolf Parkinson White Sx
- 31. SA Node AV Node ECG : PR interval is Prolonged but remains constant Treatment : Oral Atropine ( Pacemakers is of no use since defect is in conduction but not at nodes)
- 32. Dropped Beat -Poor conduction of AV node -PR interval lengthens i.e is not constant -Sudden missed beats present
- 34. -Poor conduction of Bundle of His -PR interval= Normal and is constant -Heart rate is low -Treatment : Pacemakers
- 35. -Complete destruction of AV node -P-P Interval : Not constant -R-R Interval : Mot constant -Rx: Pacemaker
- 36. Used In Not used in Sick sinus Sx 1st Degree Heart Block Mobitz type II Mobitz Type I 3rd Degree Heart Block
- 37. Duration =80-120msec (2 small squares) QRS complex The QRS-complex represents depolarisation of the ventricles. It is seen as 3 closely related waves on the ECG (Q / R / S wave): •The first downward deflection is the Q-wave •Any upward deflection is an R-wave •A downward deflections after an R-wave is called the S-wave Check the width of the QRS complexes: •The QRS complexes should be approximately 0.12 seconds (3 small squares) If longer than 0.12 seconds it suggests the complex originated in the ventricles. If shorter than 0.12 seconds it suggests the complex is supraventricular in origin.
- 39. J Wave or Osborne wave
- 41. 2) Atrial Fibrillation 3) PSVT
- 42. -Paroxysmal Supraventricular Tachycardia -Only Arrhythmia which can occur in Normal Heart -Spontaneous termination with vomiting since it stimulates vagus -R-R Interval is shortened but is constant -Hidden P waves Sudden onset of PSVT
- 43. -Ectopic focus = At Cavo Tricuspid Isthmus -Rate = 240-350 -AV Nodal block = 2:1 -Max. Heart rate : 175bpm -R-R Interval : Shortened but constant -Narrow complex QRS -Flutter/ Saw tooth waves
- 44. ATRIAL FLUTTER ATRIAL FIBRILLATION Ectopic focus : Cavo Tricuspid Isthmus Left atrium Atrial Rate : 240-350 300-600bpm AV nodal block : 2:1 4:1 Max. Heart rate : 350/2 = 175bpm (AV nodal block=2) 600/4 = 150bpm R-R Interval : Decreased and constant Decreased and variable Narrow complex QRS Narrow complex QRS PSVT is differentiated from Atrial flutter by presence of only one P wave
- 45. -Ectopic site of firing is present on ventricle -Ventricular rate = 200bpm -Atria is under SA node control. Hence Atrial Rate =100bpm -So Atrio Ventricular Dissociation
- 46. CAUSES Hypokalemia ( Cholera) Hypomagnesemia ( Gitelman Sx) Class IA/IC/III Anti-arrhytmic drugs Erythromycin + Astemizole/Terfinadine/Ketoconaz ole Erythromycin + Cisapride Treatment : Magnesium Sulphate
- 47. -Na+ channel defect -ST segment elevation + T wave inversion +ve h/o sudden death of sibling
- 49. -MC Arrhythmia of Digoxin Toxicity -Most characteristic arrhythmia of Digoxin Toxicity = Non Paroxysmal Atrial Tachycardia with AV block
- 50. The ST-segment starts at the end of the S-wave and finishes at the start of the T- wave. It represents the interval between ventricular depolarisation and repolarisation. It should be level with the PR-segment and the T-P segment in healthy individuals. ST SEGMENT
- 51. ST ELEVATION ST elevation is significant when it is greater than 1mm (1 small square) in 2 or more contiguous limb leads or >2mm in 2 or more chest leads. It is most commonly caused by acute full thickness M.I
- 52. Normal ECG
- 53. Artery compromised Leads Lateral wall M.I Left Circumflex vessels V5, V6 , I, aVL Septal wall M.I Septal Br. Of Left Anterior descending A. V1, V2, I,aVL Anterior wall M.I LAD V1- V4 , I, aVL Extensive AWMI LMCA V1- V6 , I, aVL Post. Wall M.I Post. Descending Artery > Lt. Circumflex A. V7, V8,V9 : ST elevation V1-V4 : ST depression
- 58. ST DEPRESSION ST depression ≥ 0.5 mm in ≥ 2 contiguous leads indicates myocardial ischaemia. ST depression
- 59. ST SEGMENT Elevation Other Features 1)Pericardial Friction Rub 2)MC Cause : TB
- 62. ECG Changes in Atrial Fibrillation 1) Variable R-R Interval 2) Narrow QRS (normal QRS=80-100msec : 2 small squares) 3) Absent P waves